Arctic sea ice extent, after growing along the winter season at a decent rate, suddenly started shrinking at the beginning of March. The average Arctic sea ice extent in February 2022 was 14.61 million square kilometers (5.64 million square miles), ranking fourteenth lowest in the satellite record A marked negative sea ice extent anomaly affected Antarctica, which set an all-time record low in 44 years of satellite observations. A premature heat wave is now affecting the Arctic with possible early widespread melting across the Arctic Ocean.

ARCTIC SEA ICE FEBRUARY 2022
The average Arctic sea ice extent in February 2022 was 14.61 million square kilometers (5.64 million square miles), ranking fourteenth lowest in the satellite record. its extent was 13.88 million square kilometers (5.36 million square miles). After being well within the interdecile range in the whole winter, abruptly decreased in the last weeks according to the Arctic Data archive System, NIPR.
The interdecile range is a measure of statistical dispersion of the values in a set of data. This means although below average, it is actually within the normal sea-ice inter-annual variability. The magenta line in the image below shows 1981 to 2010 average extent for that month.

Through most of February, the 2022 sea ice extent was 690,000 square kilometers (266,000 square miles) below the 1981 to 2010 average, although well above the recent 2010s average for most of the winter. Sea ice extent defined the area of the ocean with at least 15% sea ice.
In the image below we can see the sea ice extent on March 14th, 2022. The rapid shrinkage is clearly visible and gives the idea of how fast the sea ice is melting or moving north due to storms in the area. This shows the large natural daily variability in sea ice conditions, while the average extent represents an important indicator of current weather and possible feedback in the upcoming Spring season.

Indeed, it is not clear if the annual maximum has been already reached at the end of February, mainly because in the latest years it occurred pretty late in March. Nevertheless, winter ice extent at this stage of the season is a weak indicator of what the ice extent will look like in September when we will face the annual minimum.
In the video we set below, you can track sea ice extent evolution in the Arctic during the winter season 2021-2022, as well as its evolution in February updated every 5 days from February 1st to March 7th.
The second part of the video above shows the 5-days sea ice volume variability in the Northern Hemisphere, excluding the Baltic Sea and the Pacific. The data are available thanks to the DMI’s model calculations through the Polar Portal http://polarportal.dk/en/
At present, Arctic sea ice extent is one of the lowest ever observed at this stage of the season, as it is clearly visible in the image below set by Zachari Labe. The yellow line shows how the daily extent lost roughly 0.4 million square kilometers in the last week.

Down here we see the detail of the first half of March 2022. After being perfectly aligned to the last-twenty-years average, a sharp sea ice extent decline began on day 8 and continue until the present situation.
The image, set by Zachari Labe, shows the cumulative change in Arctic sea ice extent for March 2022 (yellow line) updated through 14 March 2022.

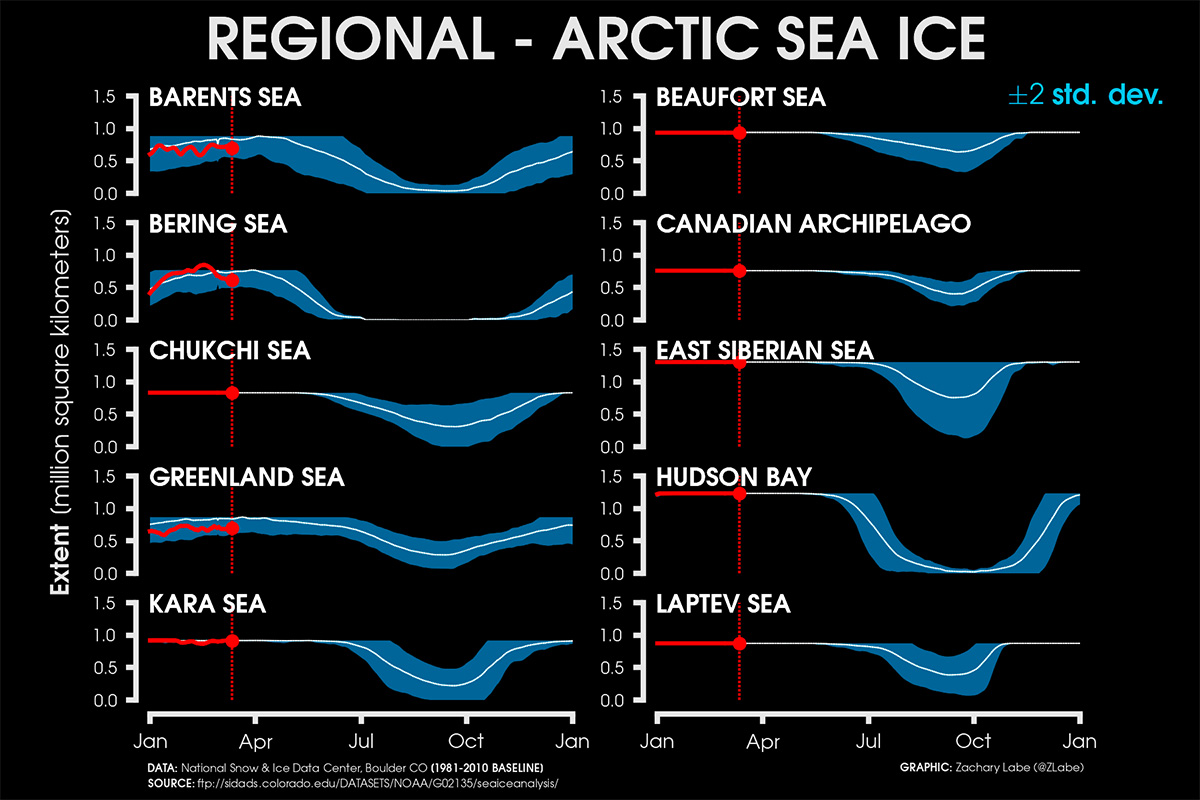
Arctic sea ice remains below normal in the Barents Sea, in the Greenland Sea, and in the Bering Sea, thus in all the open-water sectors of the Arctic. It wasn’t like this in January when the Bering Sea sector remained well above average for most of the month.
Nevertheless, it is worth remembering how, thanks to a cool summer and autumn this last season, the Arctic sea ice extent was among the highest in recent years in November, particularly in the Western Ocean. A marked negative anomaly instead affected the Hudson Bay which remained entirely free of ice until December and delayed by more than a month the usual see freezing.
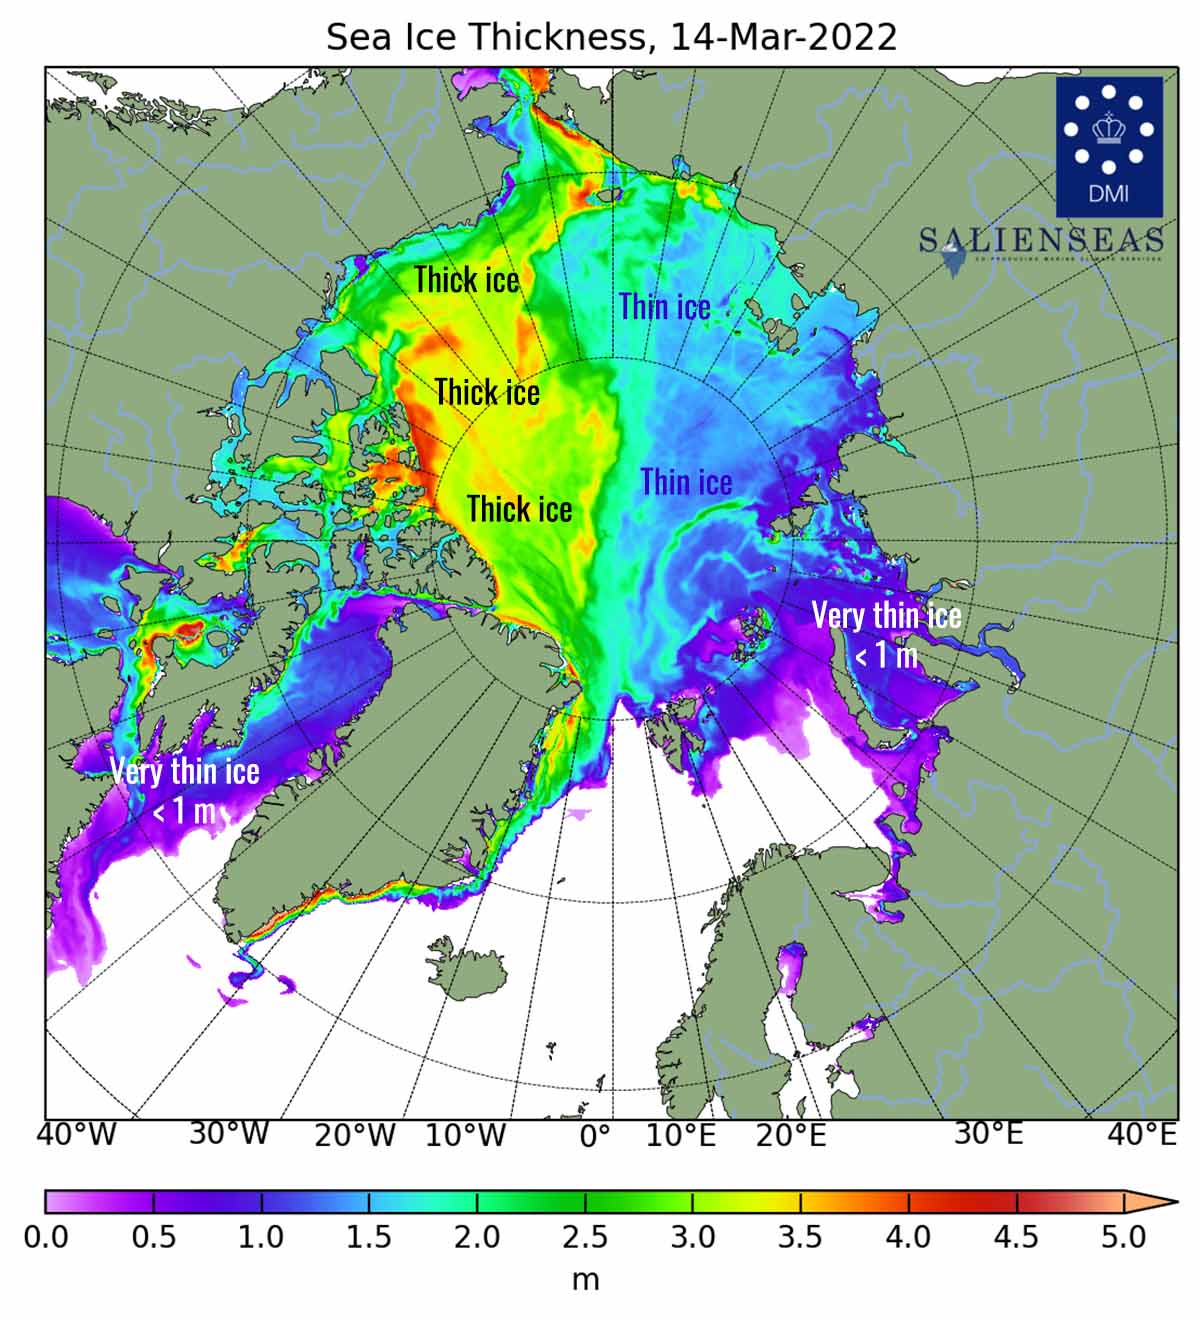
Although sea ice was relatively extensive compared to recent winters, though remained relatively thin. This is crucial in forecasting the evolution of the upcoming Spring and Summer, ‘cause thin ice more easily melts and breaks compared to thick and old multiannual ice.
In the image below we can see how the thinnest ice less than 1 meters thick is actually present in vast sector of the Hudson Bay, in the Baffin Bay west of Greenland, and in the Barents Sea and the Kara Sea between Svalbard and Russia
WHAT IS SEA ICE
Sea ice means all sorts of ice that form when seawater freezes. Sea ice that is not fast ice refers to drift ice, and, if the concentration exceeds 70%, it is called pack ice. When sea ice concentration is lower than 15% this is considered open water, and the boundary between open water and ice is called the ice edge.
Sea ice cover in the Arctic grows throughout the winter and peaks in March. In September the sea ice extension reaches its minimum, which is generally only around one-third of its winter maximum. In order to get a proper picture of the sea ice state, there is the need of determining both extents and volumes. Such numbers primarily include the ice thickness, generally linked to the age of the ice. In the image below, Arctic sea ice climatology from 1981-2010 by the Snow and Ice Data Center, University of Colorado, Boulder.
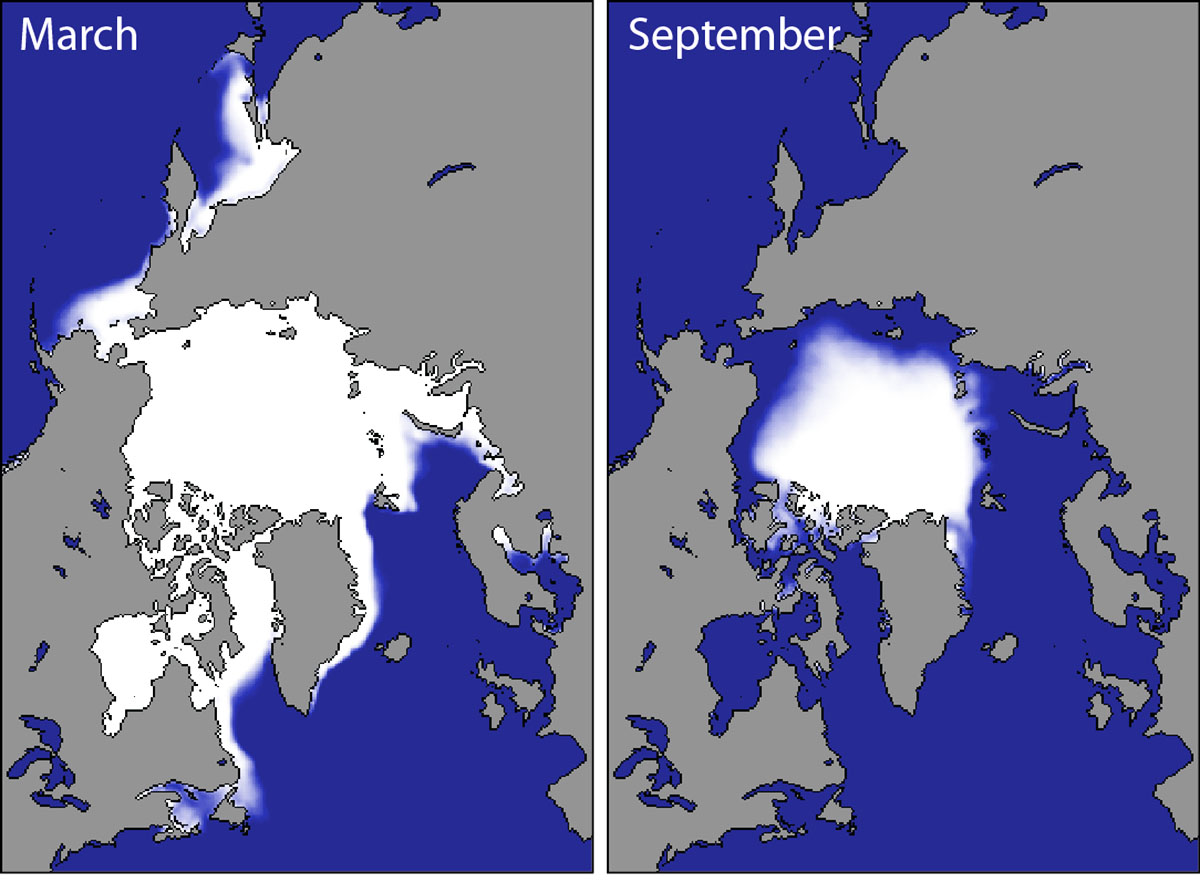
As we stated a few paragraphs above, winter ice extent is a weak indicator of what the ice extent will look like this coming September when we will face the annual minimum. The seasonal cycle of Arctic sea ice is characterized by the maximum annual extent in March, decreasing through spring and summer to an annual minimum extent in September.
Since 1979 it has been possible to monitor sea ice by satellite. At present, We have 43 years of reliable information on the extent of the sea ice cover. The sea ice had continuously diminished and particularly since the end of the 1990s. Nevertheless, the winter trend is different from the summer trend.
In the image below the Arctic sea ice extent development at the end of the winter season (March maximum) and by the end of the summer (September minimum)

HOW WAS THE WEATHER LIKE IN THE ARCTIC IN FEBRUARY 2022?
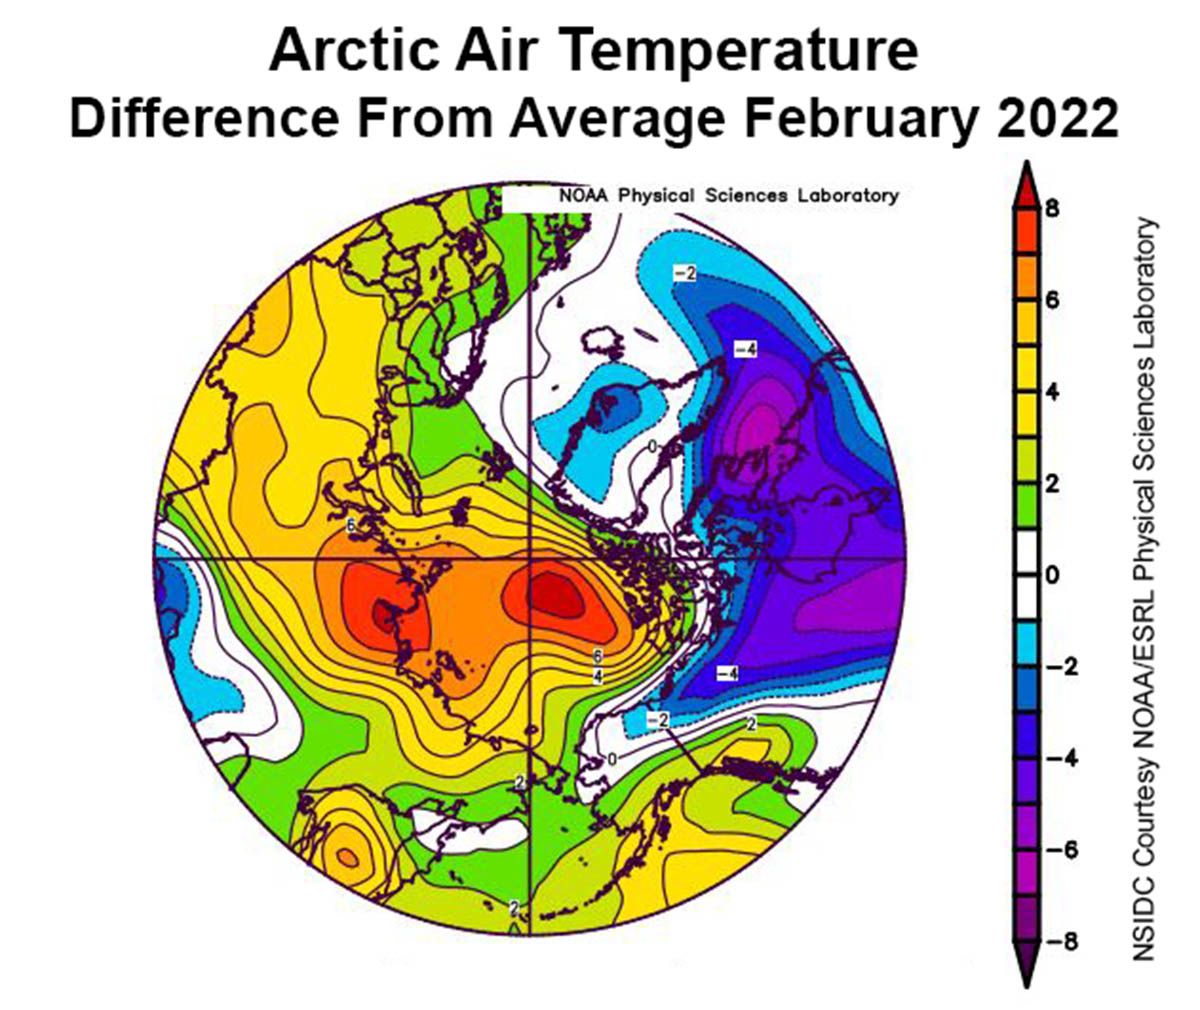
Regional temperature distribution in February at the 925 hPa level (about 2,500 feet above sea level) in the Arctic ranged from 1 to over 8 degrees Celsius (2 to 14 degrees Fahrenheit) above the 1981 to 2010 average along the coast of Eurasia and across the central Arctic Ocean.
Cool conditions prevailed over Canada and the Baffin Bay and here the temperature was mostly 2 to 7 degrees Celsius (4 to 13 degrees Fahrenheit) below average.
The image below shows air temperature anomalies in degrees Celsius in the Arctic at the 925 hPa level. Yellows and reds indicate higher than average temperatures; blues and purples indicate lower than average temperatures. The image is NSIDC courtesy of NOAA Earth System Research Laboratory Physical Sciences Laboratory
In February the sea level pressure pattern was characterized by strong and persistent low pressure centered over the North Atlantic and high pressure over central Asia. Both structures, produced persistent air flows northward from Eastern Europe to the Arctic. This is consistent with the observed above-average temperatures there.
In North America, arctic air flew southward over eastern Canada, bringing colder conditions to the area, due to the low pressure over the North Atlantic, extending over the Baffin Bay.

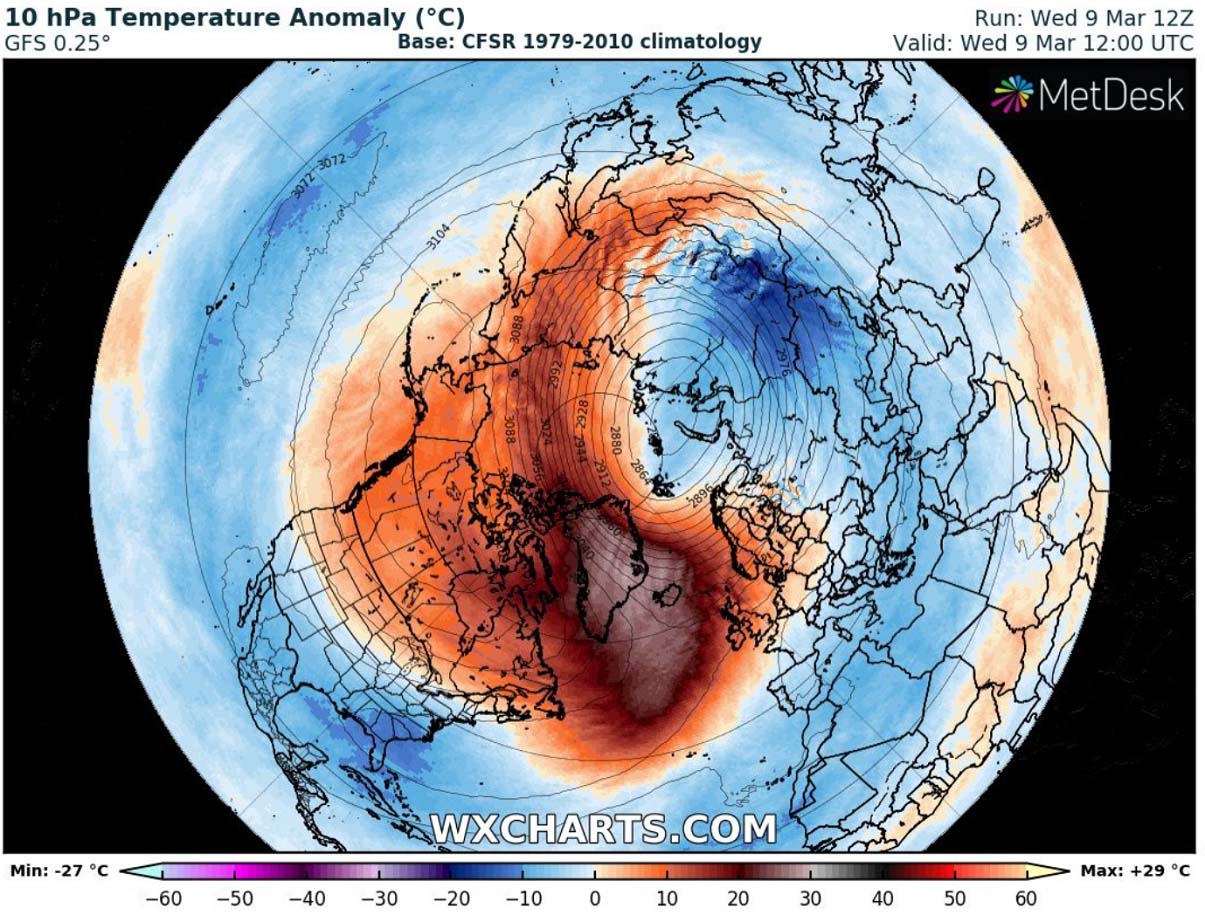
The general pattern this year was strongly influenced by an unusually strong polar vortex. The Polar Vortex during February and in early March is generally very intense and cold, as we can see from the following chart below. However, the most intense part of its southern lobe shifted from North America towards Asia and Europe in early March.
When looking at the intensity of the Polar Vortex, we check the temperatures and their anomalies at the 10 hPa pressure level. That is directly within the stratosphere layer. This level is placed at around 30 kilometers altitude.

Temperatures in the core of the lobe from -65 to -75 °C were detected, which is extremely cold even for these levels and especially for early spring. The temperatures within the Polar Vortex core are now nearly 30 °C below normal for this time as it shifted on the other side of the hemisphere. Temperatures on the other side of the vortex, precisely above Canada and Greenland, are extremely warmer as is evident from the image below
The temperature anomaly there is around 30 degrees Celsius above normal for mid-March which is pretty extreme. Both together give a combo of a massive dipole pattern over the northern hemisphere.
THE POLAR VORTEX
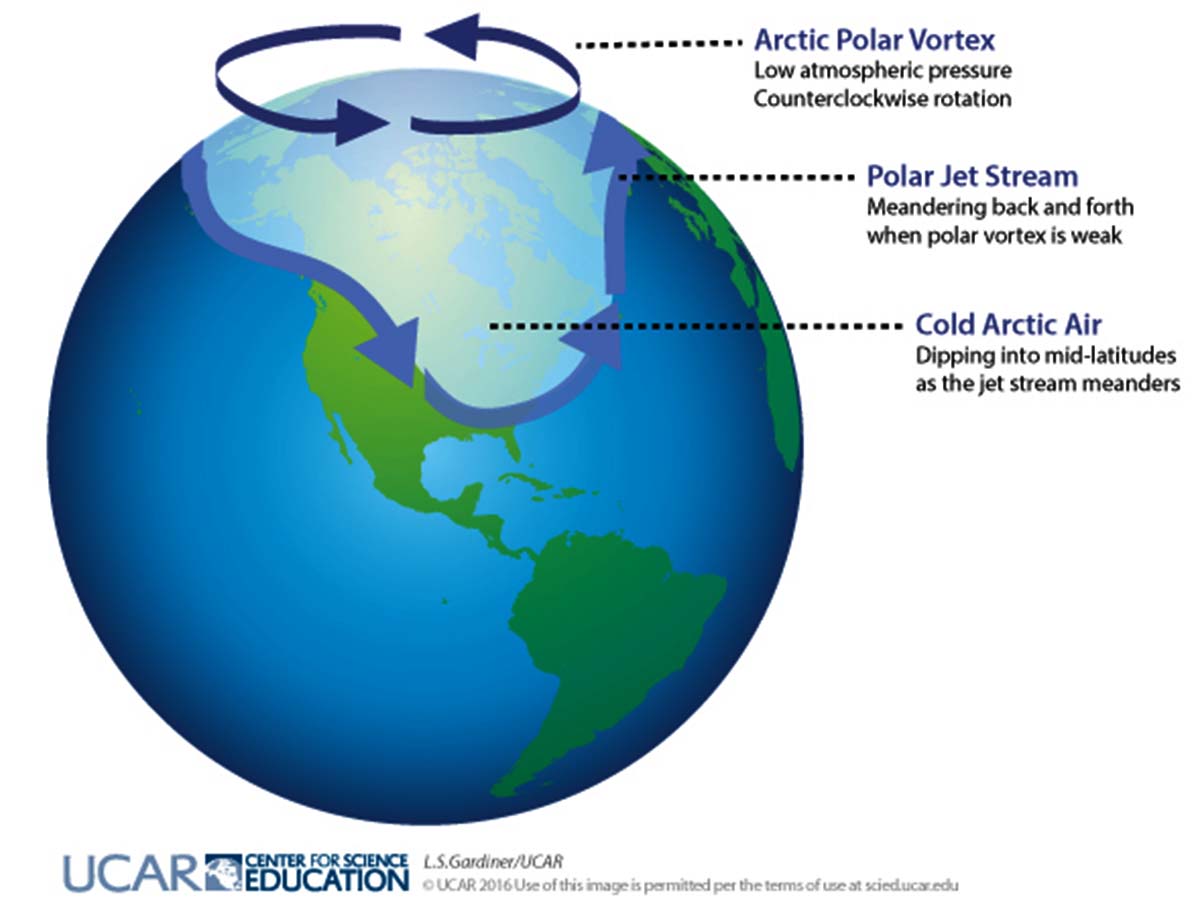
In meteorology, the polar vortex is a semi-permanent low pressure located just above the north pole. It is a large region of rotating, cold air that encircles both polar regions.
Several meteorologists consider the polar vortex to be no more and no less than the mean zonal flux at high latitudes. This structure, flowing around the Earth, gives rise to a vortex (closed isobars, approximately circular and concentric) when viewed by an observer located just above the Arctic.
The polar vortex might be seen as a semi-permanent stable cold circulation pattern describing two distinct phenomena. The stratospheric polar vortex, and the tropospheric polar vortex.
The stratospheric polar vortex is a large-scale baric structure especially active in the cold, winter season. High-speed cyclonically rotating winds are located between roughly 15 kilometers and 50 kilometers high. The stratospheric polar vortex strengthens and extends in the autumn and shrinks and fills in the spring. In summer, the polar vortex is practically absent as its autumn genesis is due to the cold air forming in the surrounding arctic areas.

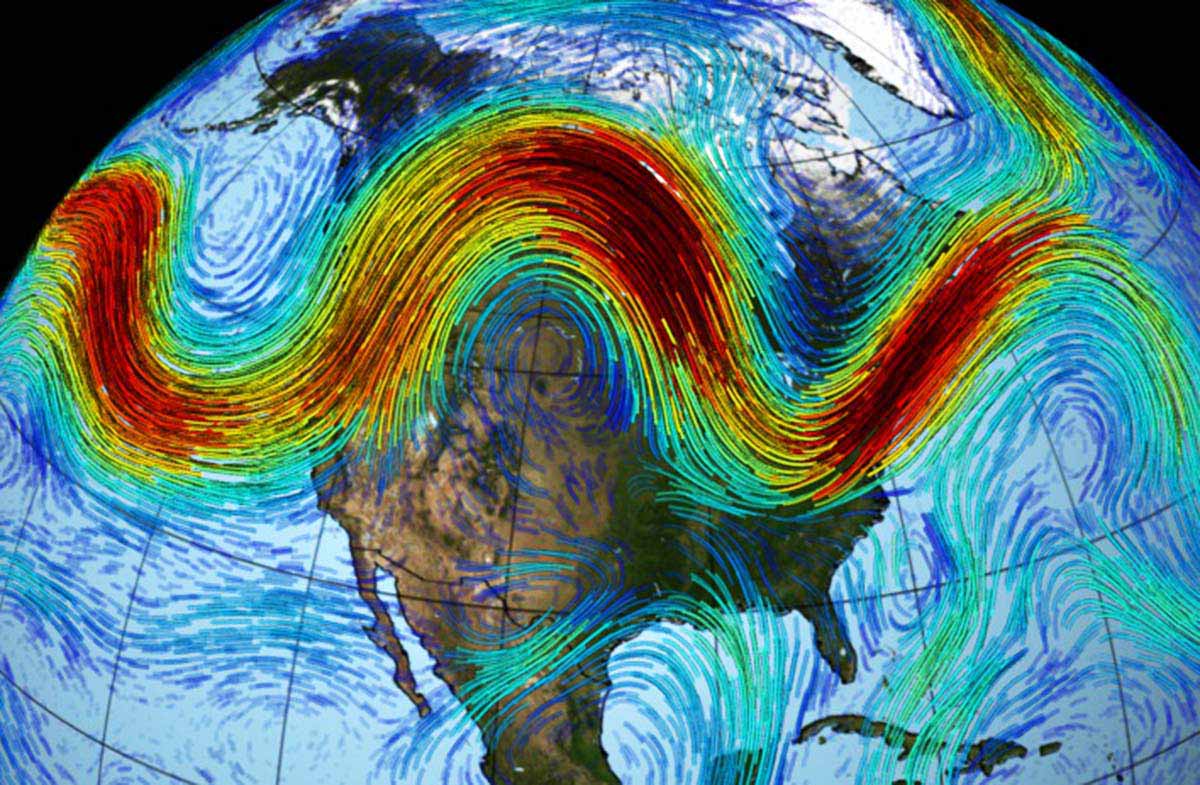
The tropospheric polar vortex is instead often defined as the area poleward of the tropospheric jet stream, extending from the ground up to about 10-15 kilometers. Unlike the stratospheric polar vortex, the tropospheric polar vortex exists all year round. Temporary events can jeopardize its existence. For example, the development of lobes that cause it to shatter towards the mid-latitudes could cause intense cold outbreaks in Europe or the U.S.
If the polar vortex weakens, the jet stream tends to be more meandering. This allows the arctic cold air to drop suddenly in latitude affecting North America or Western Europe.
Sometimes the stratospheric vortex deepens downwards triggering a tropospheric vortex and the two baric figures can feed each other.
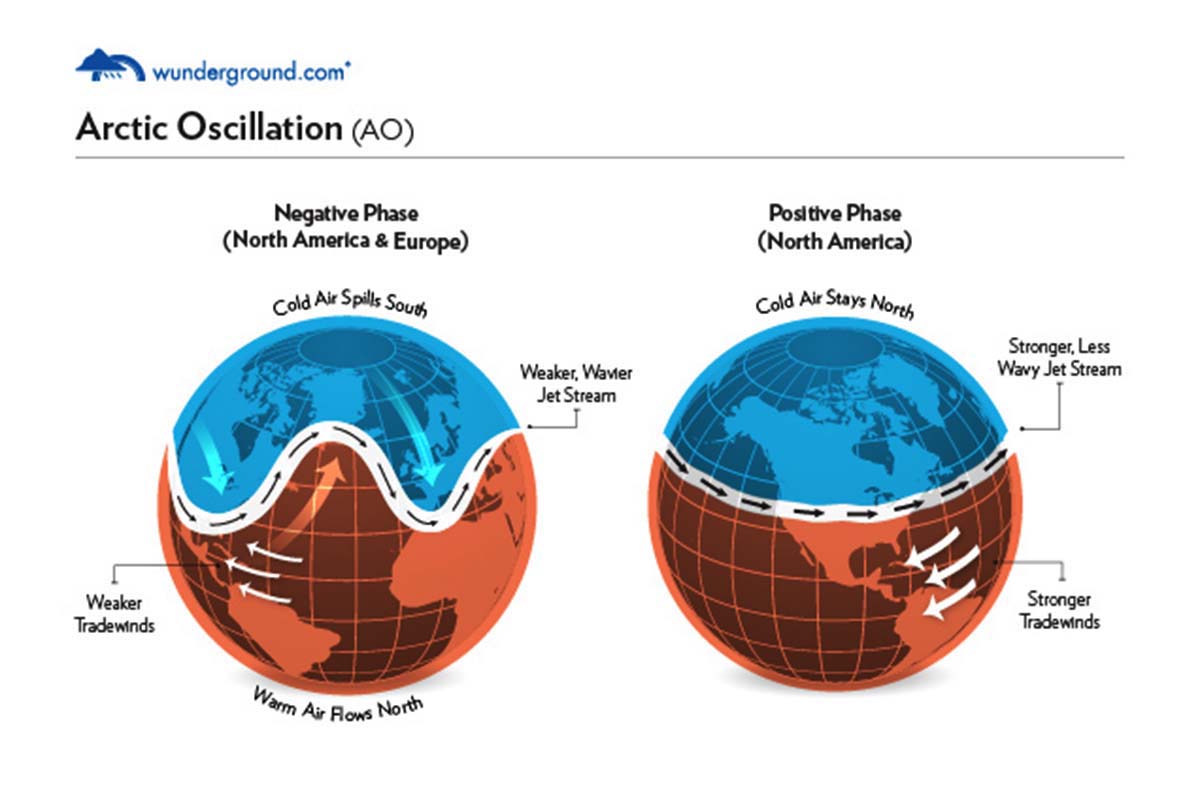
A measure of the intensity of the polar vortex is given by the Arctic Oscillation. In turn, the Arctic Oscillation (AO) has close links with the North Atlantic Oscillation (NAO) located in the North Atlantic. The North Atlantic oscillation is a teleconnection index depending on differences in the atmospheric pressure between Iceland and the Azores islands. In the Pacific Ocean, The North Pacific Oscillation (NPO) is an oscillation of atmospheric pressure and sea-surface temperature in the North Pacific Ocean that affects, among other things, winter temperature over most of North America.
The NPO is similar to the NAO in having a low-index state and a high-index state. A low NPO index is associated with southerly winds along the west coast of North America, which tends to bring warmer air into the region. A high NPO index brings a northerly airflow, with the corresponding movement into the region of cold, sub-polar air.
Figures courtesy of J. Wallace, University of Washington from the National Snow and Ice Data Centre1.
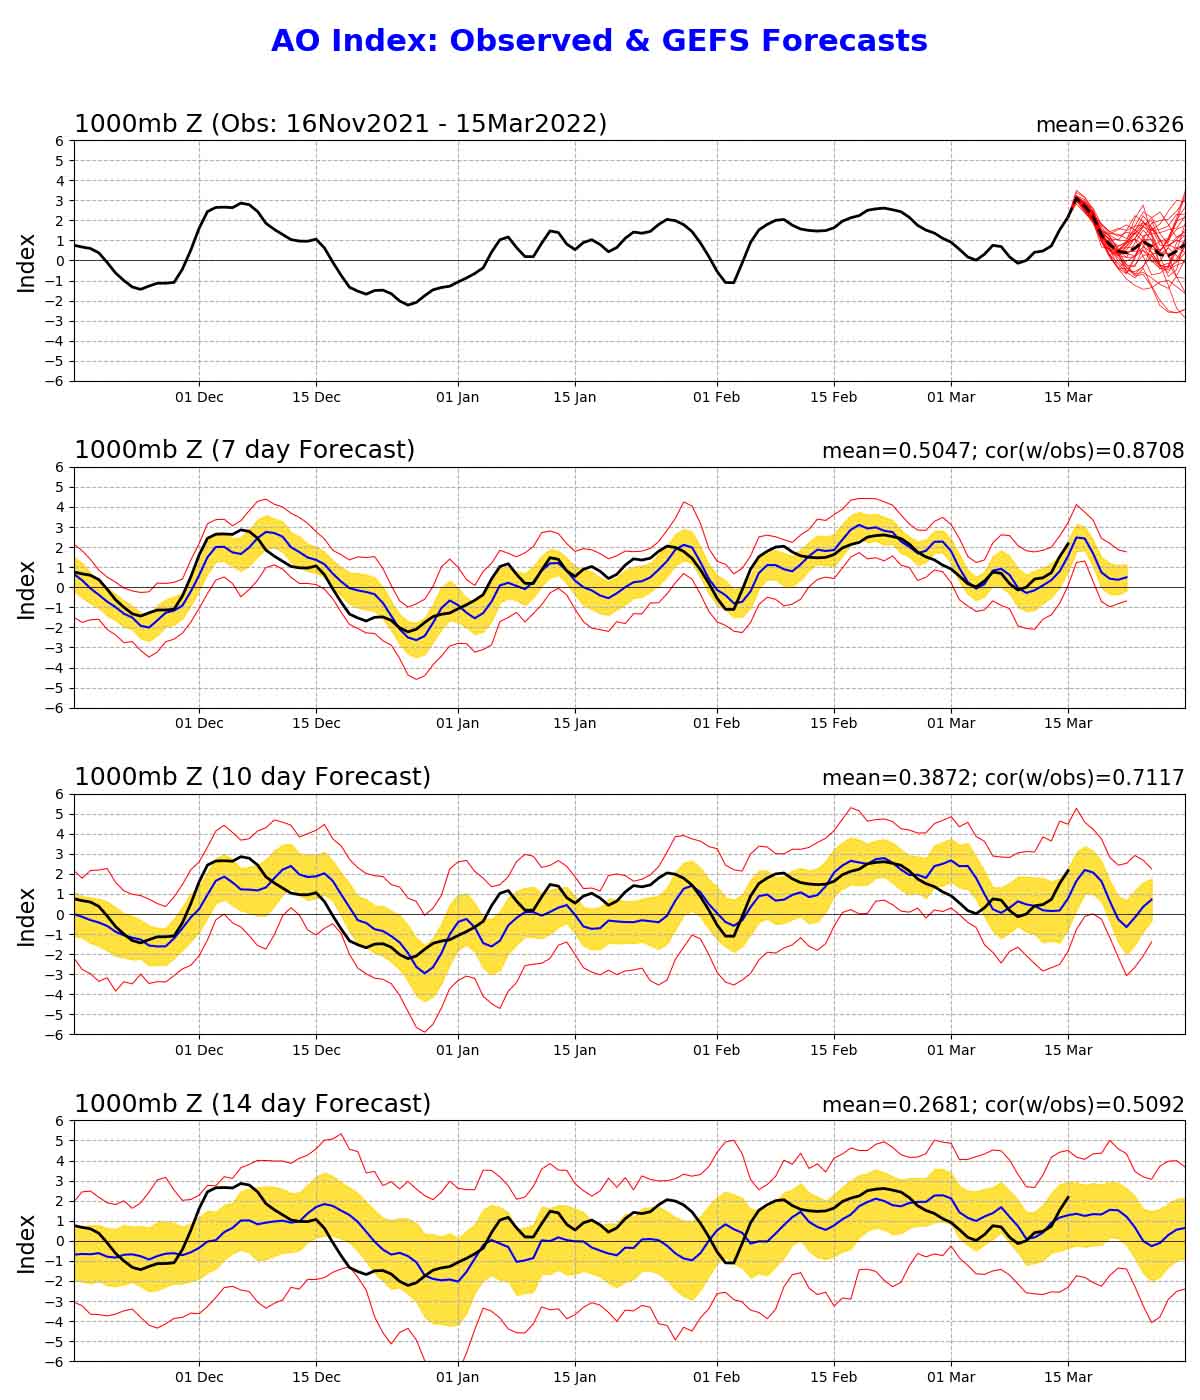
The Arctic Oscillation (AO) is currently positive and is predicted to remain neutral to positive through late-March with mixed to mostly negative pressure/geopotential height anomalies across the Arctic especially the North Atlantic side of the Arctic and mixed pressure/geopotential height anomalies across the mid-latitudes.
The North Atlantic Oscillation (NAO) is also positive and is predicted to remain positive as pressure/geopotential height anomalies are predicted to remain negative across Greenland the next two weeks.
Recent research has shown that the regional anomalies that are most highly correlated with the strength of the stratospheric PV are across the Barents-Kara seas region where low Arctic sea ice favors a weaker winter PV.
Low sea ice in the Chukchi, Beaufort, and Bering seas may favor colder temperatures across North America but has not been shown to weaken the PV.
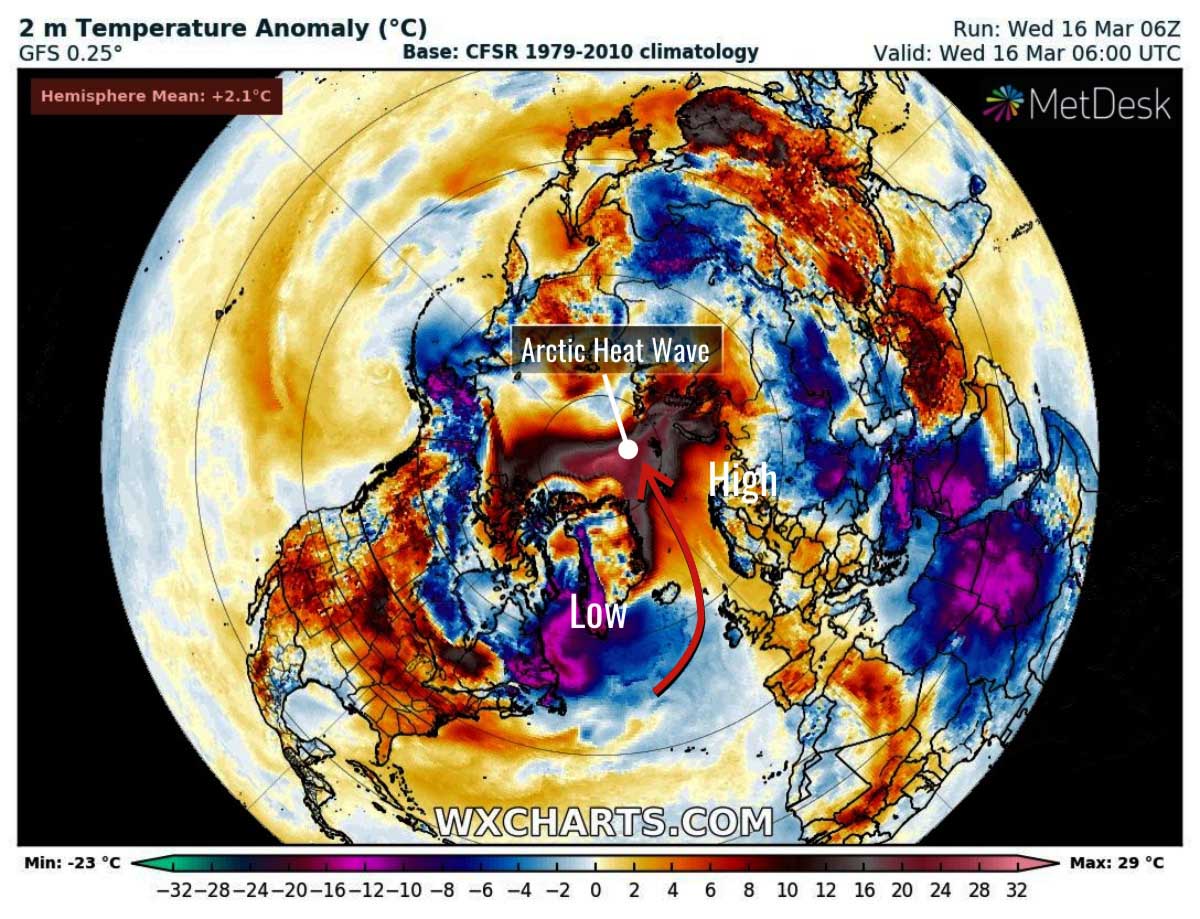
Nevertheless, after a record-breaking season, the polar vortex is now weakening and the first signs of this might be seen in the heatwave in effect in the North Atlantic sector of the Arctic these days.
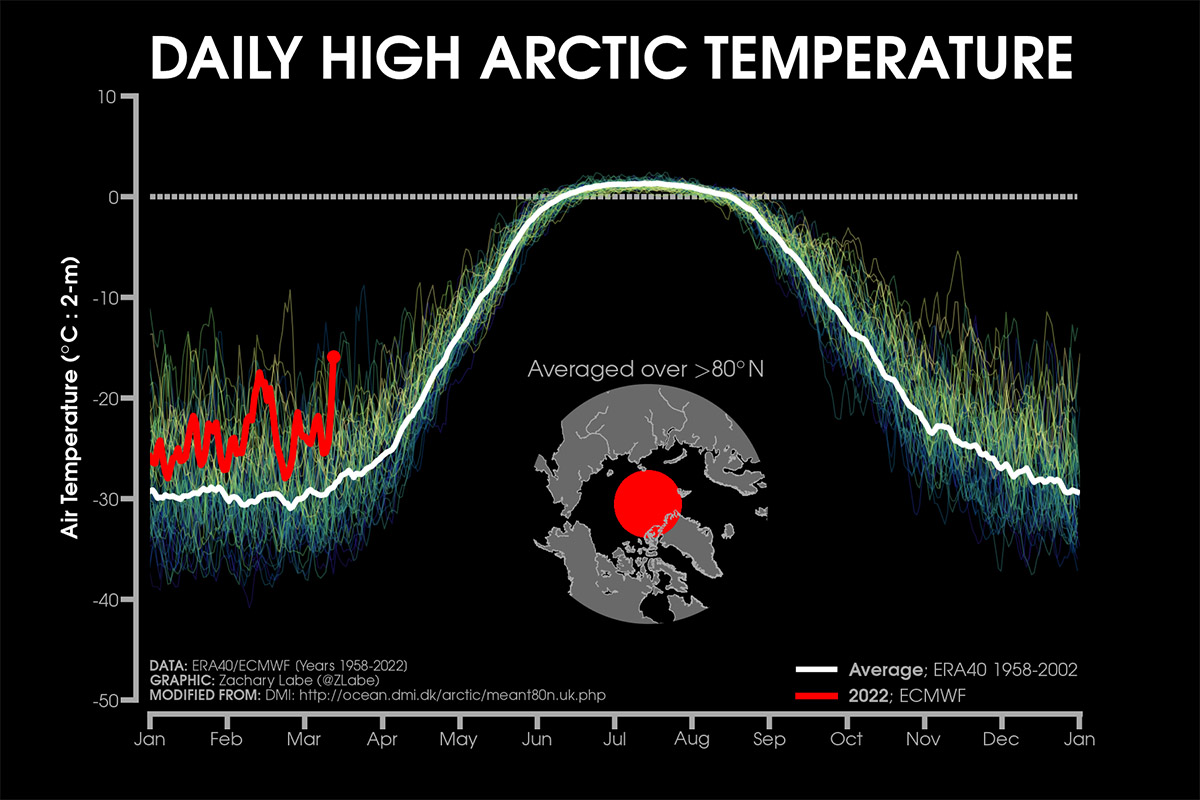
In the image above set by Zachari Labe, daily 2 m surface air temperature for the Arctic averaged above 80 degrees north is shown. Individual years from 1958 to 2020 are shown by the sequential blue/purple to yellow lines. 2022 is indicated by the red line. ERA40 has been applied for the 1958-2002 climatology (white line), while the operational ECMWF is used for the current year.
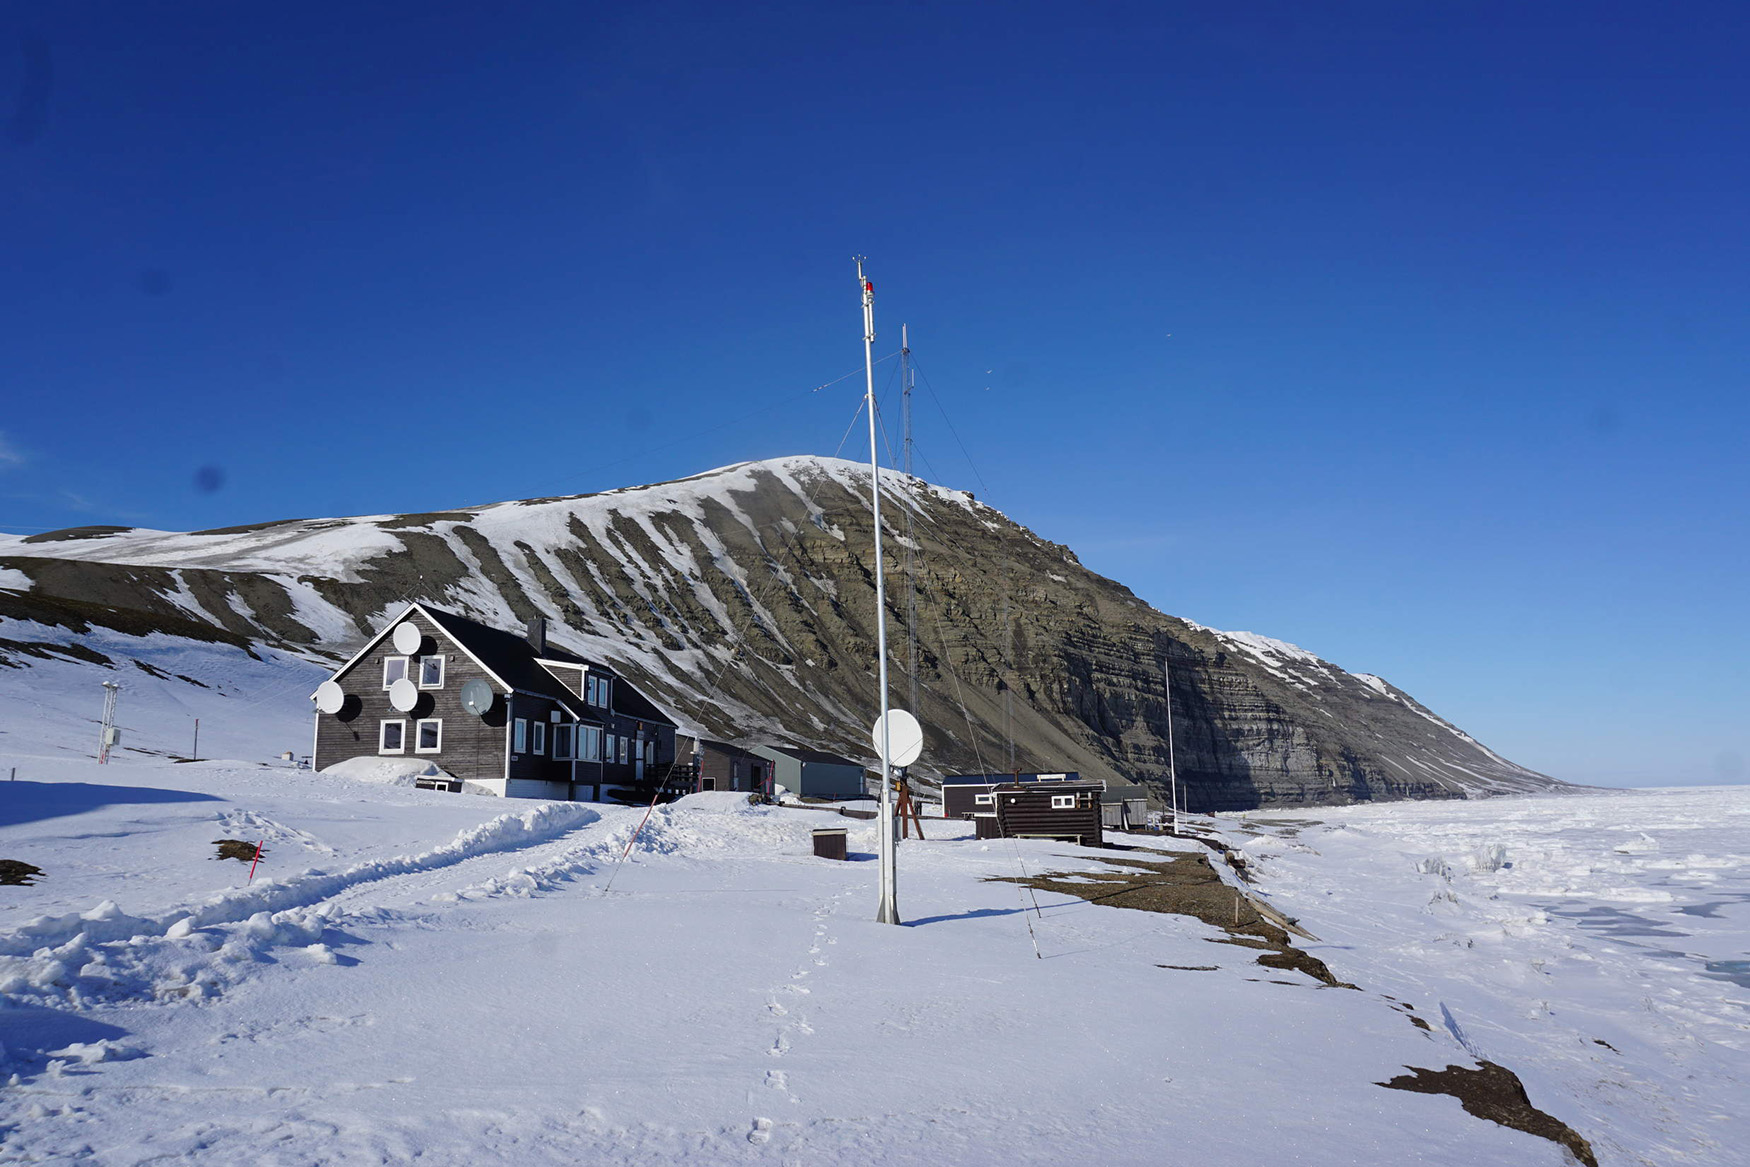
A maximum temperature of 3.9 degrees Celsius was recorded at the manned weather station Hopen in high Arctic Svalbard 76 degrees north on March 16th. This is the highest temperature recorded at Hopen during March according to Ketil Isaksen. Observations at Hopen started in November 1944.
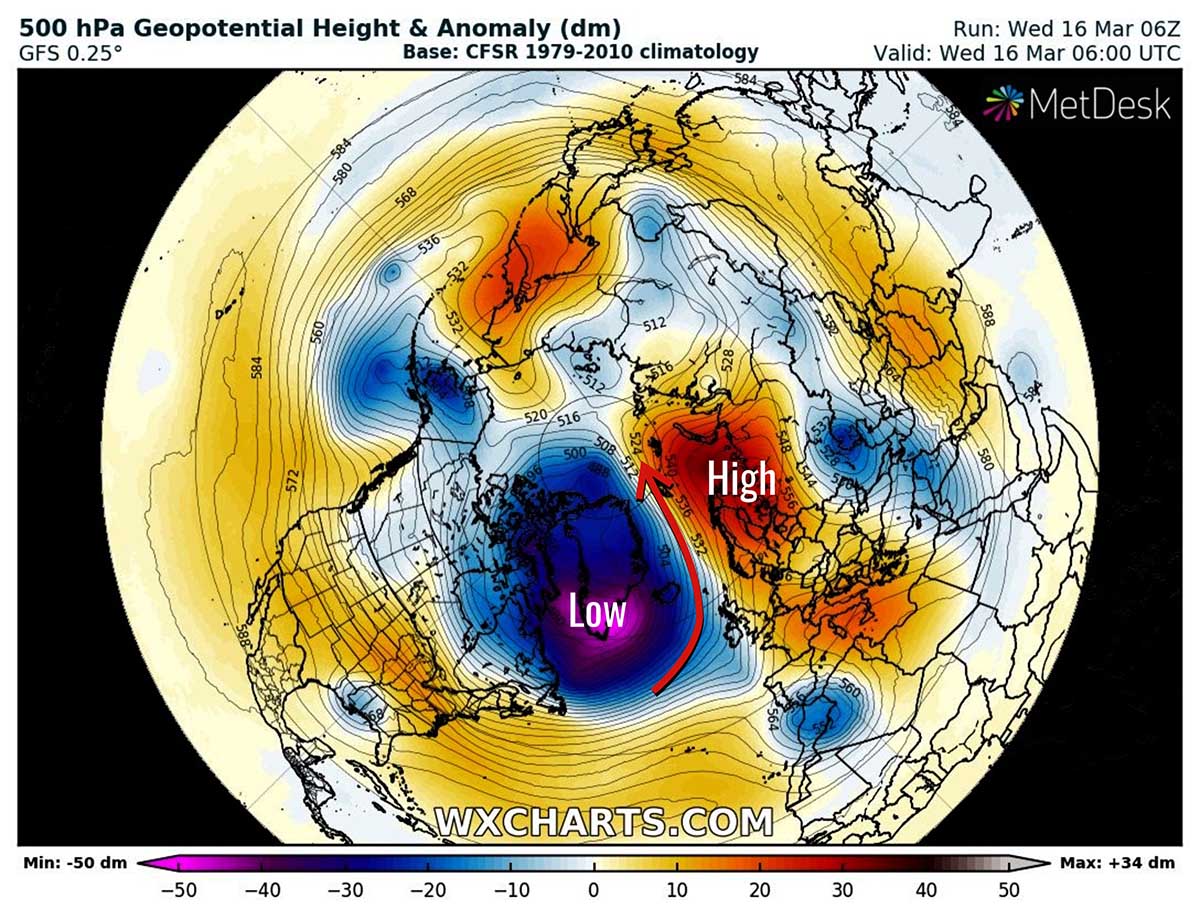
Such a strong heatwave is triggered by both a deep low centered over southern Greenland and a strong high developing between Scandinavia and Siberia. The counterclockwise motion of air around a low is bringing temperate air into the central Arctic as we speak.
The image below shows the present situation which actually opened a large corridor of strong and mild winds from the North Atlantic towards the Arctic Ocean. The image is provided by wxcharts and shows the geopotential anomaly at 500 hPa.
The result is that a powerful heatwave has developed in most of the Arctic with widespread above-average temperatures. The image below shows the temperature anomaly at 2 meters height compared to the 1979-2010 climatology.
We can see how in locations very close to the geographic North Pole, thus close to 90 degrees latitude, we have temperature anomalies exceeding 20 degrees Celsius.
This powerful heatwave is mostly affecting sectors of the Arctic characterized by thin, seasonal sea ice, as we saw above. With such intense warm anomalies now in effect, there is a high chance the present abrupt melting that occurred in early March will continue into the month, as the heatwave seems to not disappear in a few days.
WHAT IS HAPPENING IN ANTARCTICA
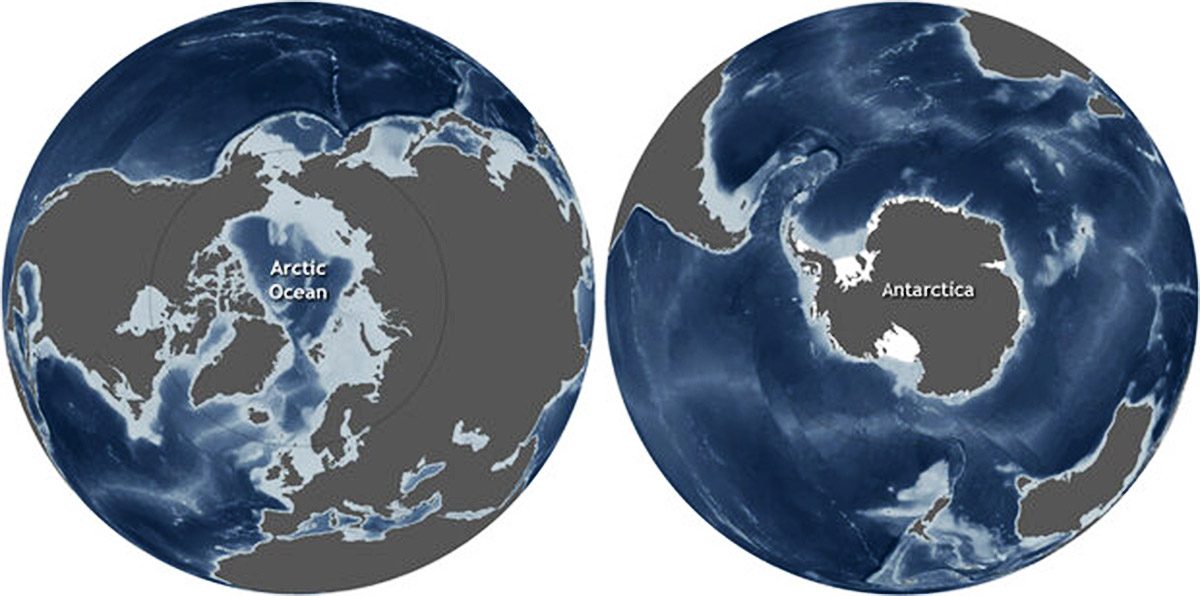
The Arctic and Antarctic are geographic opposites, and not just because they stand on opposite ends of the Earth’s globe. They also have opposite land-sea arrangements. In the Arctic, continents surround an ocean, while in Antarctica the continent is surrounded by oceans.
These differences in the arrangement of land and water contribute to differences in each polar region’s climate, oceanic and atmospheric circulation patterns, and sea ice.
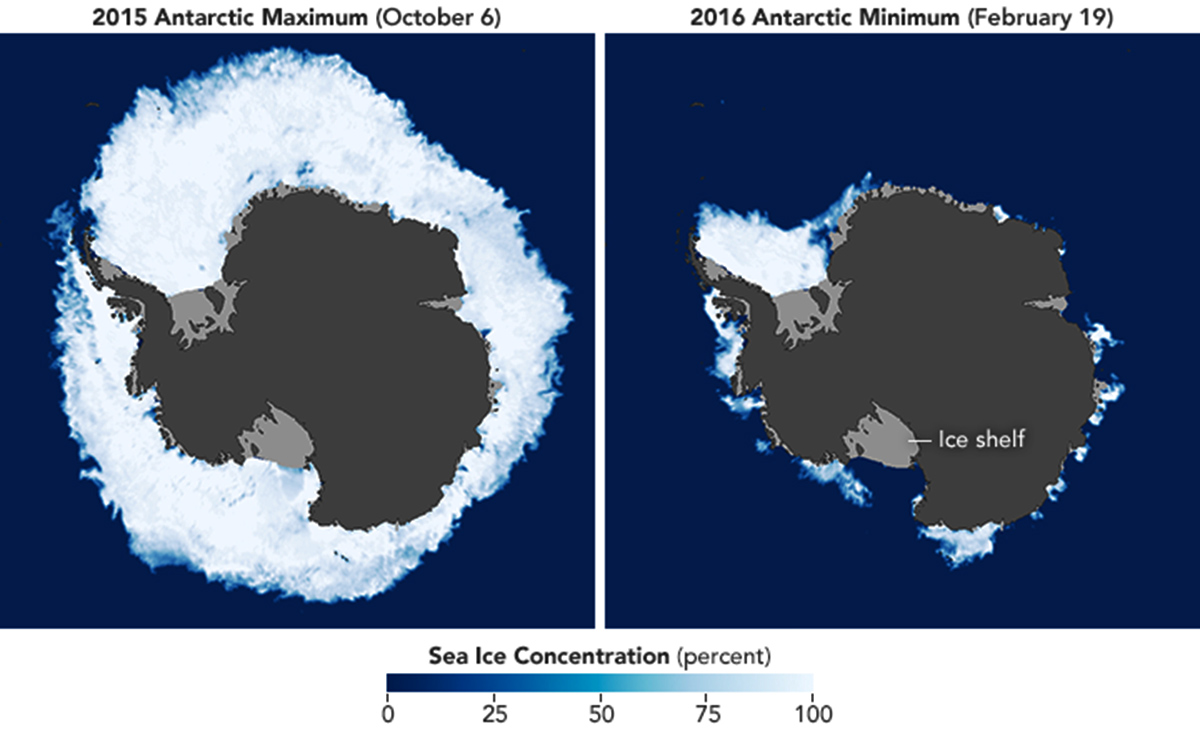
Antarctic sea ice normally peaks in September or October and reaches a minimum in February. In some places, sea ice melts completely in the summer. In the NASA Earth Observatory maps below by Joshua Stevens, using AMSR2 data supplied by GCOM-W1/JAXA, sea ice extent in Antarctica in the season 2015-2016
The cold waters around Antarctica allow rapid sea ice formation in winter. At its maximum extent in September, sea ice cover is around 16 million square kilometers or 6.2 million square miles, shrinking to about 2 million square kilometers or 0.77 million square miles in February. This is a much larger fluctuation than in the Arctic, where the configuration of the continents encourages the retention of ice for longer periods.
Antarctica experienced definitely warmer temperature in summer 2021-22. As a consequence, at the end of February sea ice extent was the lowest in the 44-year record. The image below shows the Antarctic sea ice extent at the end of February, along with daily ice extent data for 2021 and 2017.
According to the National Snow and Ice Data Center of Boulder, Colorado’s sea ice extension on February 25th was 1.924 million square kilometers or 0.742 million square miles while the previous 2017 minimum was recorded on March 3rd, 2017 with 2.110 million square kilometers or 0.811 million square miles.

Although February 25th does not represent the most negative anomaly of the record as a whole, it is so for the end of February when the usual annual climatic minimum occurs. This is also clearly evident in the image below which shows the Antarctic sea ice extent anomalies stretching from January 1979 to the present-day thanks to satellite-era, NSIDC, DMSP SSM/I-SSMIS. The anomalies are plotted by using a five-day running mean from the 1981-2010 climatological baseline and updated to February 28th.
While overall sea ice extent has only slightly increased since the late 1970s, the rate of increase began to accelerate in 2000, and ice extent reached a record high in 2014. But then something unexpected happened. It dropped drastically over the next three years, reaching a record low in 2017.

The year-to-year variability and the increase by about 1.7% in the extent of the Antarctic sea of 2000s ice have been well observed since the beginning of the satellite era, from 1978-79 to the present. In the 2000s, several highly positive anomaly peaks contrast with those negatives observed in the very last seasons.
In fact, when looking at this curve from a different perspective, we can see at least three short-term trends. In the image below, redrawn from the original one set by Zachari Labe showed above, we highlight the recent sea ice variability and short trends. The slow increase observed in the 2000s, and particularly evident in the period 2011-2015 when sea ice extent was substantially always above average, ended abruptly in 2016.
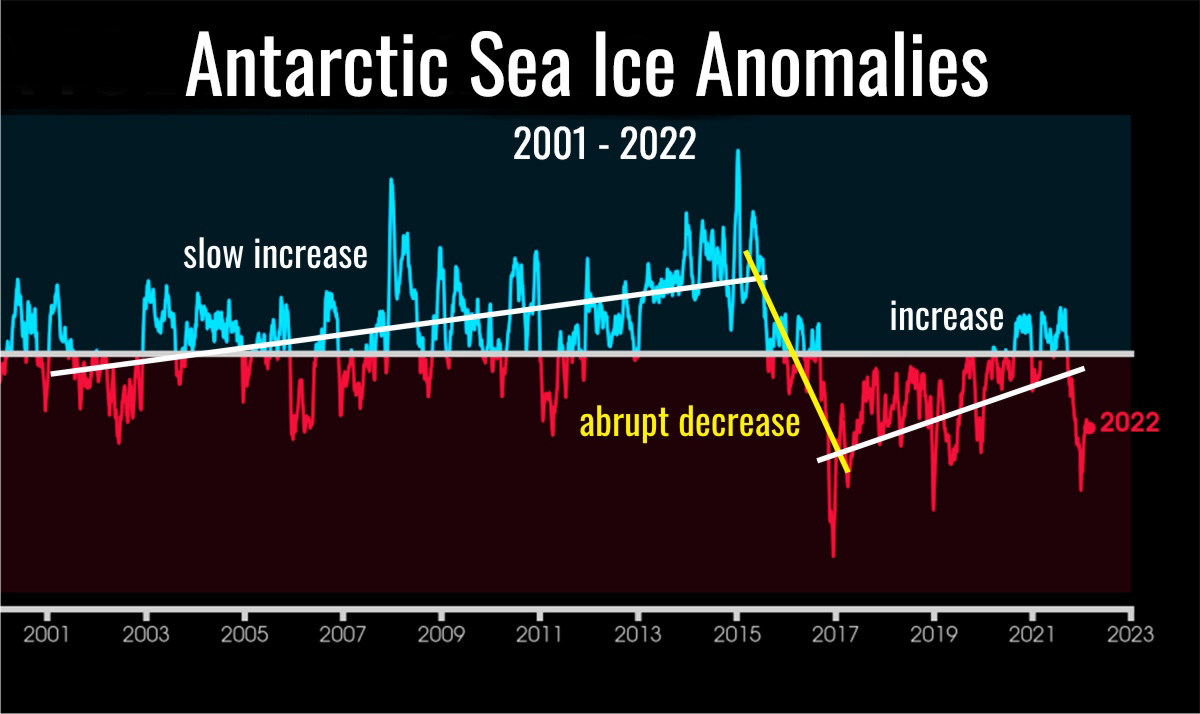
A rapid and extensive decrease with massive negative anomalies peaked in 2017, and for about four years sea ice extent was continuously below the 1981-2010 average.
From 2017 on, a new slow increase has been observed, and in 2021 the sea ice extent showed again periods of positive anomalies. The three main negative peaks occurred at the end of 2016 and 2018, and in February 2022 as well as the positive peaks, apparently follow the same increasing trend.
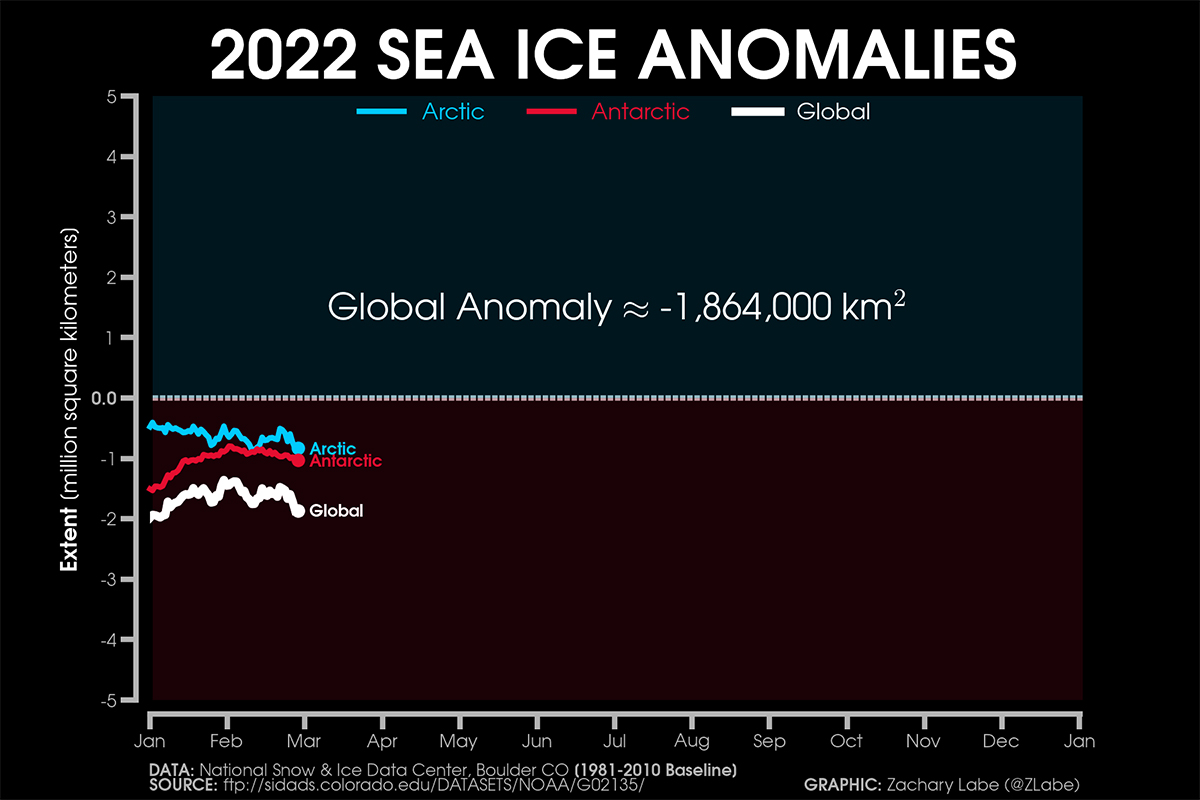
Both the Arctic and Antarctic Sea Ice extent push the global anomaly at -1.864 million square kilometers or about 0.720 million square miles. In the image below the current sea ice extent anomalies for the Arctic and Antarctic, source NSIDC, DMSP SSM/I-SSMIS F-18 edited by Zachari Labe. Anomaly-based on 1981-2010 climatology
We will keep you updated on this and much more, so make sure to bookmark our page. Also, if you have seen this article in the Google App (Discover) feed or social media, click the like button (♥) to see more of our forecasts and our latest articles on weather and nature in general.