New research finds the global average temperature at 7.8°C (46°F) during the last glacial maximum with a polar vortex shifted south by many degrees of latitude compared to today. The consequences on the global cryosphere due to cold conditions were dramatic and impressive, and able to freeze on continental ice masses tens and tens of meters of sea level. Today, the worse winter conditions we face in terms of cold temperature due to the polar vortex south shift, are basically those that were normal during the last glacial maximum.
In recent years, the term polar vortex is no longer used exclusively by professional meteorologists, but by the general public as well. Often, the term polar vortex is used a bit abusing it, but it is certainly something that attracts people’s attention. The polar vortex variability, in fact, is the main trigger of the greatest cold waves affecting the U.S. and Europe. But what is the polar vortex?
THE POLAR VORTEX
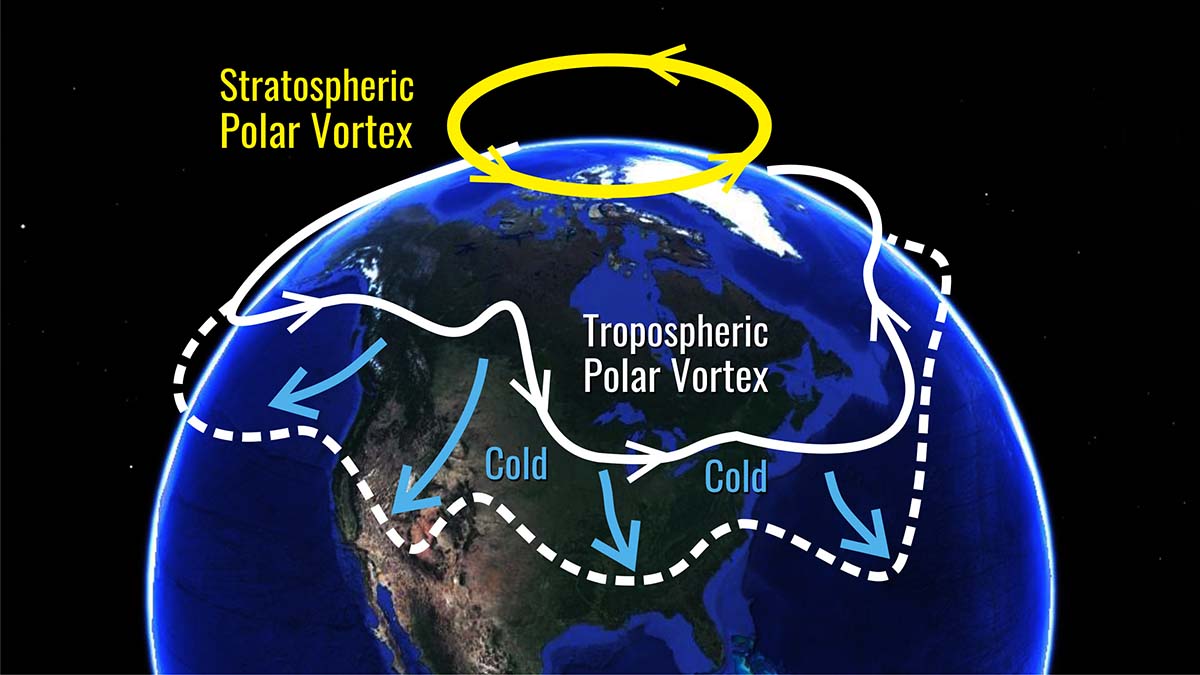
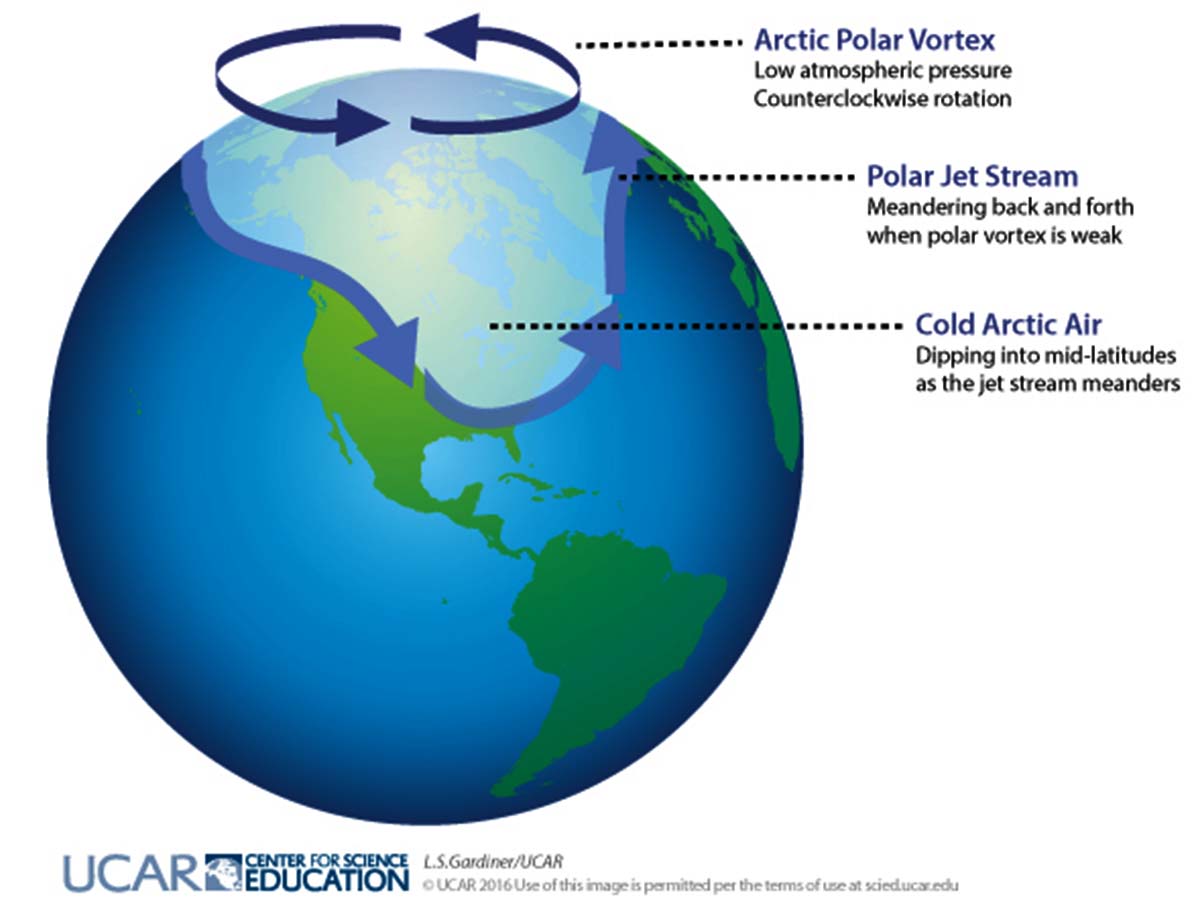
In meteorology, the polar vortex is a semi-permanent low pressure located just above the North Pole. It is a large region of rotating, cold air that encircles both polar regions.
Several meteorologists consider the polar vortex to be no more and no less than the mean zonal flux at high latitudes. This structure, flowing around the Earth, gives rise to a vortex (closed isobars, approximately circular and concentric) when viewed by an observer located just above the Arctic.
The polar vortex might be seen as a semi-permanent stable cold circulation pattern describing two distinct phenomena: the stratospheric polar vortex, and the tropospheric polar vortex.
The stratospheric polar vortex is a large-scale baric structure especially active in the cold, winter season. High-speed cyclonically rotating winds are located between roughly 15 kilometers and 50 kilometers high. The stratospheric polar vortex strengthens and extends in the autumn and shrinks and fills in the spring. In summer, the polar vortex is practically absent as its autumn genesis is due to the cold air forming in the surrounding arctic areas.
The original version of the image above source NOAA is available at EcoWatch article.
The tropospheric polar vortex is instead often defined as the area poleward of the tropospheric jet stream, extending from the ground up to about 10-15 kilometers. Unlike the stratospheric polar vortex, the tropospheric polar vortex exists all year round. Temporary events can jeopardize its existence. For example, the development of lobes that cause it to shatter towards the mid-latitudes could cause intense cold outbreaks in Europe or the U.S.
Until the seventies, the concept of polar vortex was replaced by the simpler and more generic one of the polar front. The polar front ideally separates the arctic cold air from milder sub-tropical air of the mid-latitudes. The term polar front is inherited from the Norwegian meteorological school.
The video above is a mosaic animation by NASA/JPL-Caltech
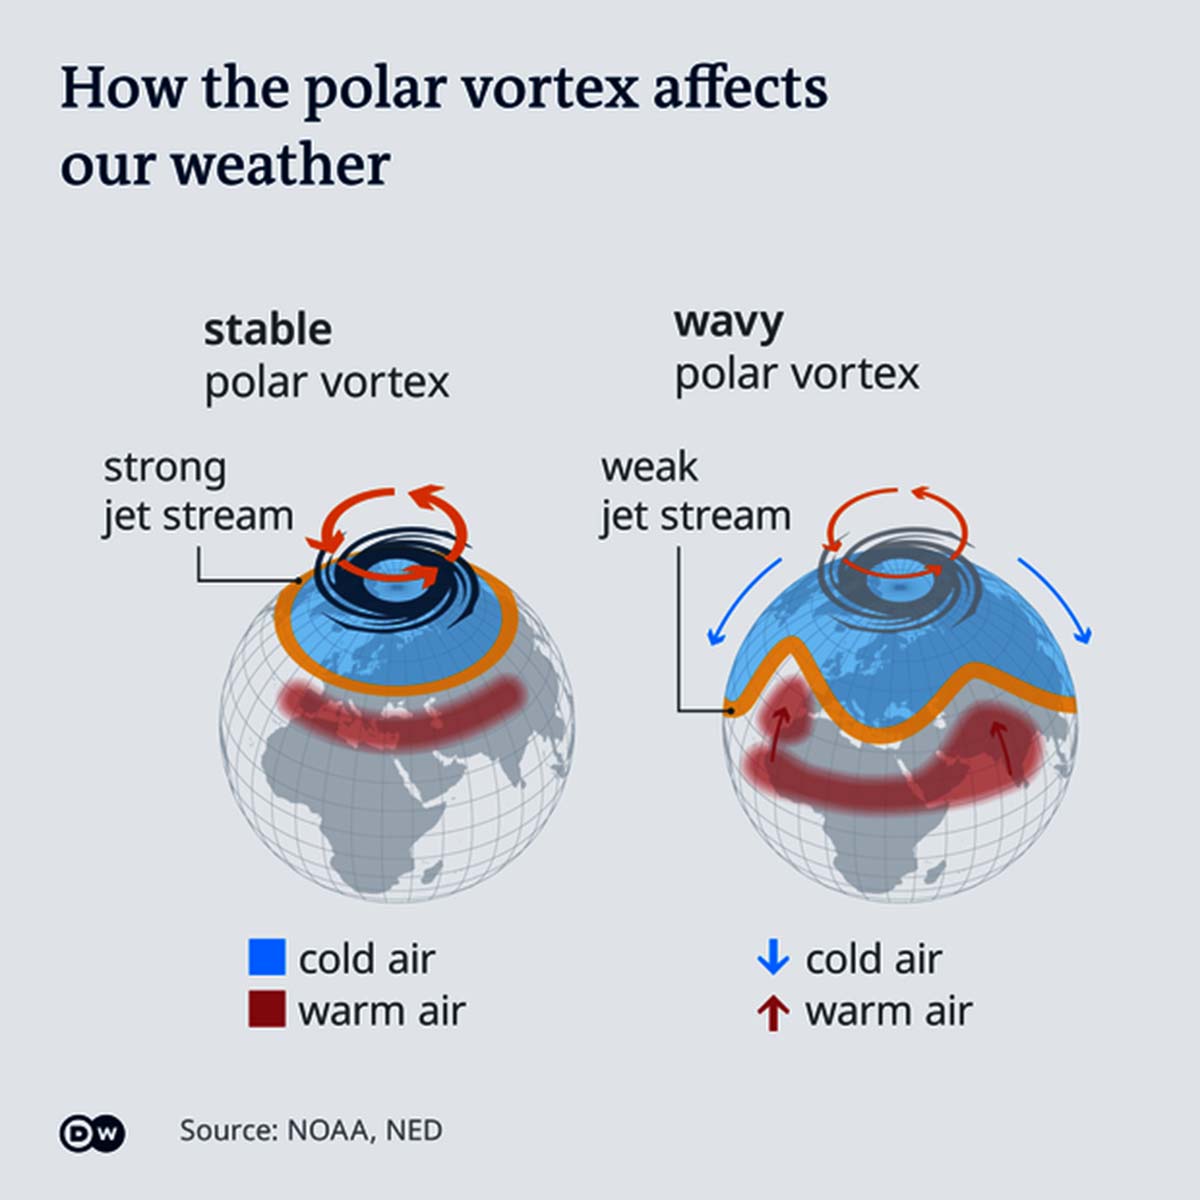
The low-pressure area can be imagined as a large top at high altitude with a counterclockwise circulatory motion, centered on the vertical of the North Pole. On the other hand, in the troposphere, the prevailing baric regime is of high pressure. The higher the rotation speed and the more intense the vortex, the lower the probability of polar cold outbreaks towards mid-latitudes.
If the polar vortex weakens, the jet stream tends to be more meandering. This allows the arctic cold air to drop suddenly in latitude affecting North America or Western Europe.
Sometimes the stratospheric vortex deepens downwards triggering a tropospheric vortex and the two baric figures can feed each other.

Above, an image courtesy of NASA showing the typical jet stream meandering
A measure of the intensity of the polar vortex is given by the Arctic Oscillation (AO). In turn, the Arctic Oscillation has close links with the North Atlantic Oscillation (NAO). The North Atlantic oscillation is a teleconnection index depending on differences in the atmospheric pressure between Iceland and the Azores islands.
In the Pacific Ocean, The North Pacific Oscillation (NPO) is an oscillation of atmospheric pressure and sea-surface temperature in the North Pacific Ocean. NPO affects, among other things, winter temperature over most of North America.
The NPO is similar to the NAO in having a low-index state and a high-index state. A low NPO index is associated with southerly winds along the west coast of North America, which tends to bring warmer air into the region. A high NPO index brings a northerly airflow, with the corresponding movement into the region of cold, sub-polar air.

The figure above is courtesy of J. Wallace, University of Washington) from the National Snow and Ice Data Centre1.
Among meteorological enthusiasts, the polar vortex is a meteorological and climatic structure to be kept under control all the time. In particular, for example, when sudden stratospheric warmings are in effect, the polar vortex is destabilized.
In a few weeks from the sudden stratospheric warming, arctic air tends to be advected at great speed towards southern latitudes. This leads to cold outbreaks with very marked negative temperature anomalies. The main issue, however, is linked to the fact that when sudden stratospheric warming occurs, we are almost sure there will be a spill of cold Arctic air towards the southern latitudes. Anyway, it is difficult to know what the precise target of the cold will be.

The image above shows an example of the cold outbreak that occurred in February 2021
Very often, the primary target is represented by the U.S. Occasionally, such cold outbreaks affect Western Europe. Practically, a shift of the polar vortex to the south, as occurred on many occasions in the past, brings Europe and U.S. back to the similar normal conditions that should have been in place during the last glacial maximum.
THE LAST GLACIAL MAXIMUM
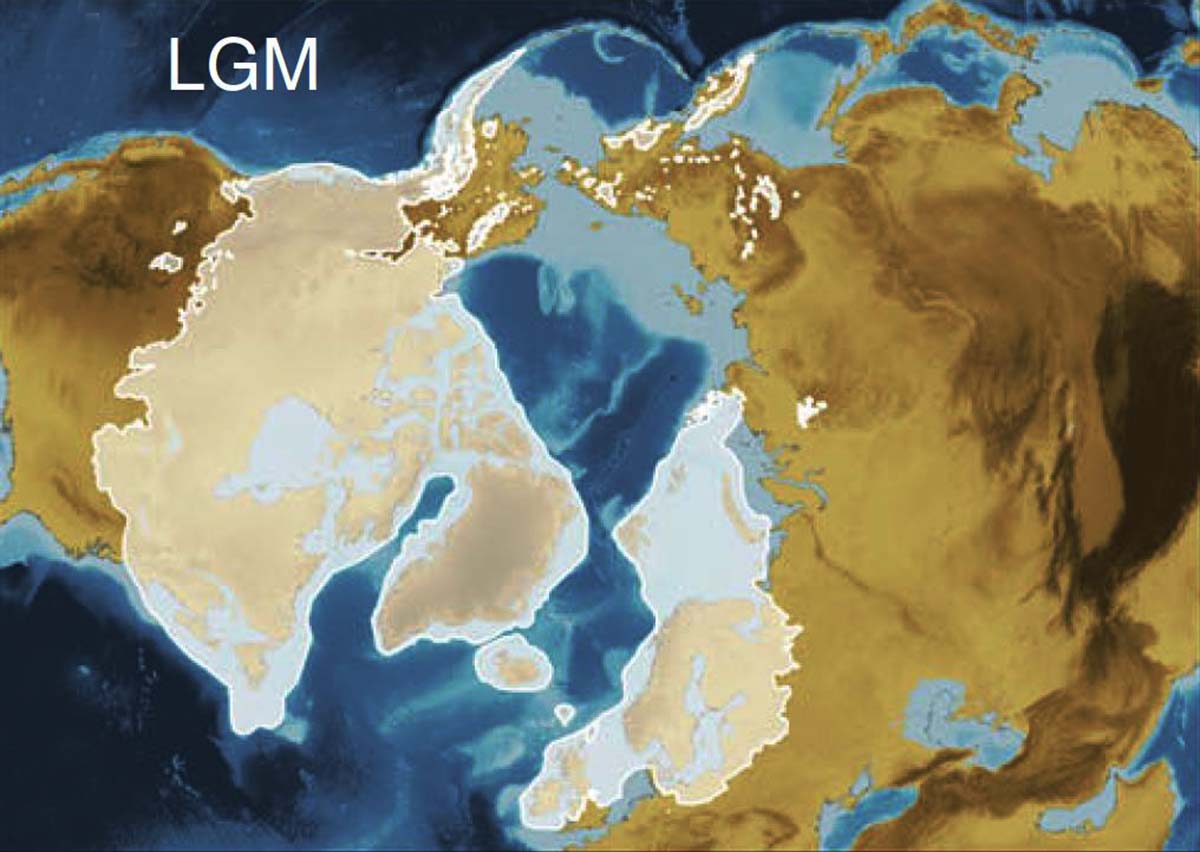
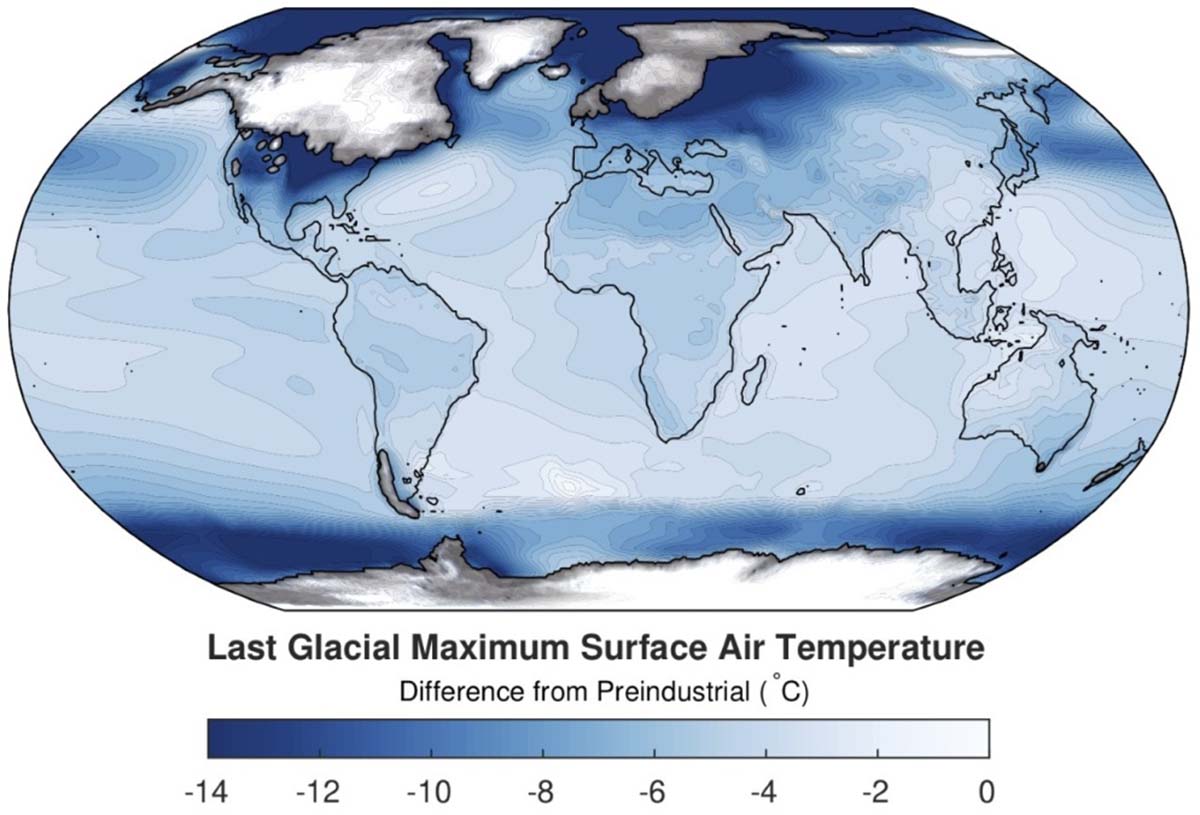
Last Glacial Maximum refers to the most recent time during the Last Glacial Period when ice sheets were at their greatest extent. The image below shows the ice sheets and glaciers distribution reconstructed for the Last Glacial Maximum in the northern hemisphere.
A recent study by Jessica Tierney and others (she is an associate professor at the University of Arizona Department of Geosciences), and published in the prestigious scientific journal Nature, calculated how was the most likely global average temperature during the last glacial maximum, about twenty thousand years ago.
The research team used models that connected data from ocean plankton fossils to sea-surface temperature. This technique is called data assimilation, used in weather forecasting, and was employed to link the fossil data with climate model simulations of the last glacial maximum.
Basically, what normally happens in a weather office is they measure the temperature, pressure, humidity and use these measurements to update a forecasting model and predict the weather. In this case, scientists used the Boulder, Colorado-based National Center for Atmospheric Research climate model to produce a hindcast of the Last Glacial Maximum. Then, they updated this hindcast with real data to predict what the climate was like.
The original image above is available in Nature article.
More, the team of scientists calculated the Equilibrium Climate Sensitivity. Climate Sensitivity is a measure of how much the Earth’s climate will cool or warm after a change in the climate system. For example, how much it will warm for doubling in carbon dioxide concentrations. The equilibrium climate sensitivity has been calculated at 3.4°C (6.1°F). Carbon levels during the Ice Age were about 180 parts per million, then rose to about 280 parts per million during the Holocene (the last interglacial), and have by now reached 419 parts per million.
During the Last Glacial Maximum, the calculated Earth’s temperature with this method was most likely 7.8°C (46°F). The decrease, compared to the pre-industrial period (1850), equals to -6.1°C (-11°F) with a maximum probability range between -5.7°C and -6.5°C. The global average temperature of the 20th century was 14°C. The current average temperature of the Earth is now close to 15°C.

The image above shows the locations of the proxies used for the Last Glacial Maximum reconstruction. The original is available at https://www.nature.com/articles/s41586-020-2617-x
Nowadays, with global warming in effect, some areas of the planet are affected differently by climate change, mainly due to feedbacks. For the same reason, the Arctic areas of the planet cooled twice as much during the Last Glacial Maximum and had a temperature about 14°C lower than today.
Like the arctic areas, mountain areas are also climatic hot spots. The European Alps, for example, probably cooled by around 10°C compared to pre-industrial values. The decidedly colder climate led the planet’s cryosphere to react, obviously in a direction completely opposite to what is happening today.
The ice sheets expanded and new ones formed. In Northern Europe, the Eurasian Ice sheet covered Scandinavia, part of Northern Europe, and part of the British Isles up to Ireland.
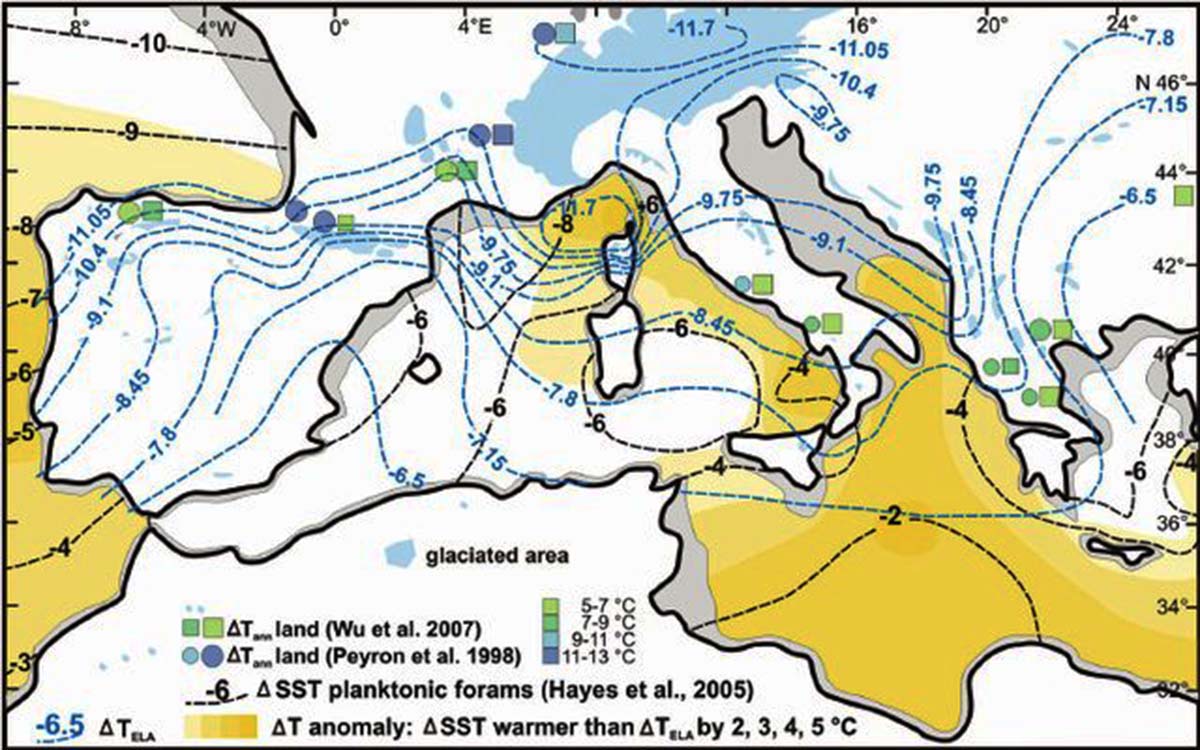
The image above shows the calculated summer temperature drop in the Mediterranean and the Alps during the last ice age, by Kuhlemann and others, Science. Calculations are derived from reconstructed ELA. To know better what the ELA is, you can follow this link and read a recent article about the ELA
Central Europe was entirely affected by frozen ground and permafrost which, in some cases, reached hundreds of meters of depth. The Eurasian ice sheet is estimated to have had a maximum ice thickness of about 3,000 meters (9,800 feet).
Even today, due to the weight of this enormous ice mass, Scandinavia is reacting with the phenomenon of isostasy. The Scandinavian continental part, that is, continues to rise slowly especially in its central area where the ice sheet was thicker.
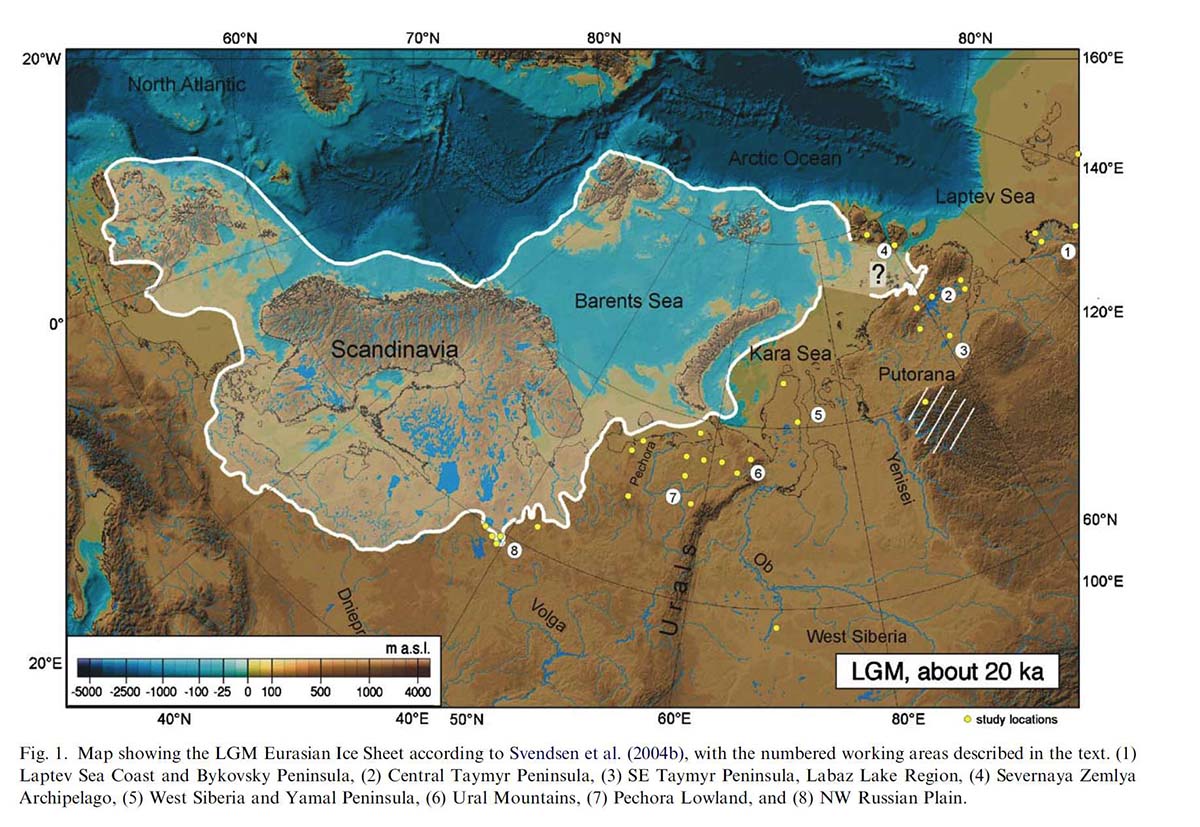
The image above shows the Eurasian ice sheet extent at the LGM credits Svendsen and others (2004)
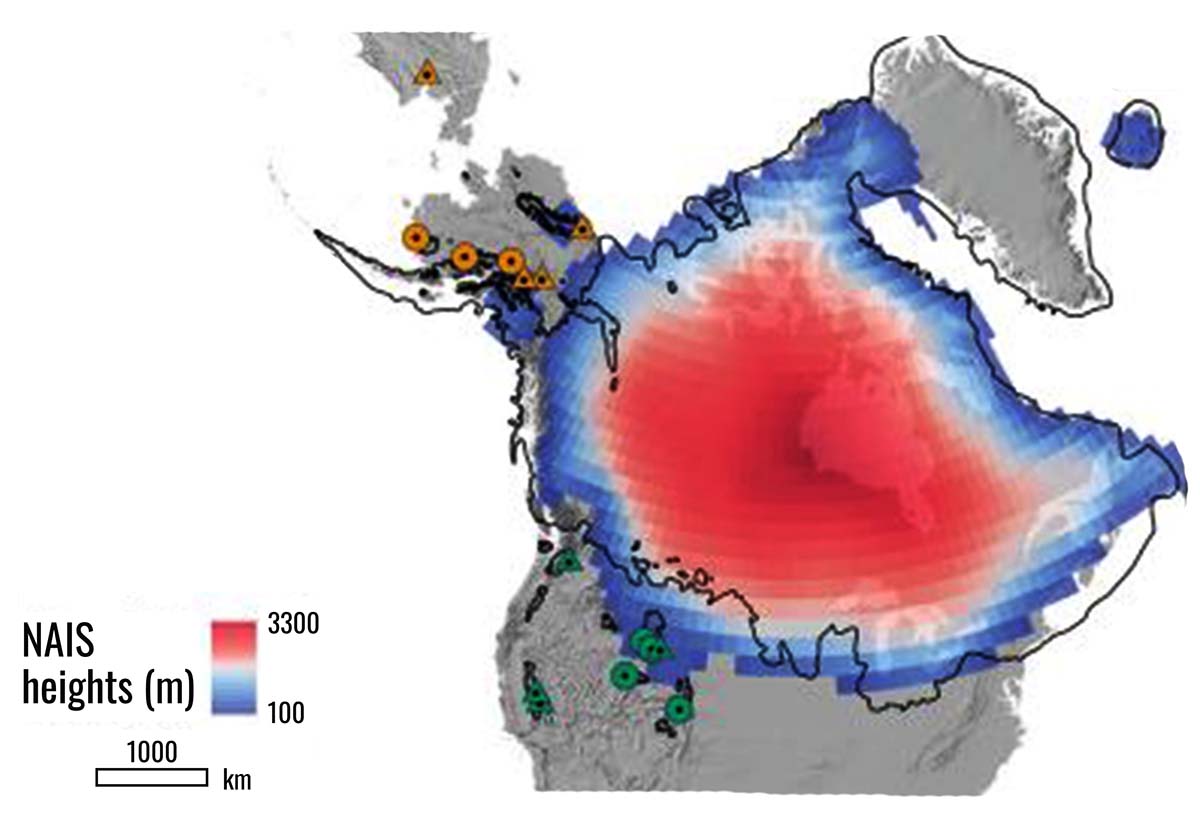
The same thing happened in North America. Here, the North American Ice Sheet was almost 3 kilometers (2 miles) thick and covered North America from the Canadian Arctic all the way to the modern U.S. state of Missouri.
The North American Ice Sheet pushed south to about the latitude of Seattle, Bismarck, Madison, and New York. A lobe close to the U.S. East coast dropped in latitude to the cities of Indianapolis, Columbus, and Pittsburgh.
The original image above is available at this link from Nature
But it was the very presence of the large ice sheets that further changed the general global circulation, as well as the extent of sea ice. In the Atlantic Ocean, the sea-ice surrounded all of Greenland and Iceland. Instead, the seasonal sea-ice reached as far as the coasts of France and sometimes northern Spain. In the Pacific Ocean, sea-ice entirely surrounded the Aleutian Islands in Alaska. A vast landmass, called Beringia, linked Siberia to Alaska.

In particular, recent Italian research by Giovanni Monegato and others published in the scientific journal Nature’s Scientific Reports explained how the growth of the North American Ice Sheet between 26 thousand and 24 thousand years ago led to a further drop in the polar front to the latitude of northern Spain.
This has contributed to the growth of glaciers in the European Alps thanks to precipitation increase. The moisture entered the Mediterranean from the west thanks to the south shifted polar front, feeding in that way the alpine glaciers.
In the video below the animation of temperature variation and glacier response over the European Alps from 100 thousand years ago up to the present day. The original video is available by Seguinot et al. following this link https://tc.copernicus.org/articles/12/3265/2018/
Then, the subsequent modification of precipitation and currents led to a slight rise of the polar front towards the north which allowed the Eurasian Ice Sheet to enlarge and reach its maximum size between 23 thousand and 17 thousand years ago.
The image below, explains precisely what we just described. Before this work, the thousands-years-time lag when the two main ice sheets reached their maximum size during the Last Glacial Maximum, had not yet been explained properly
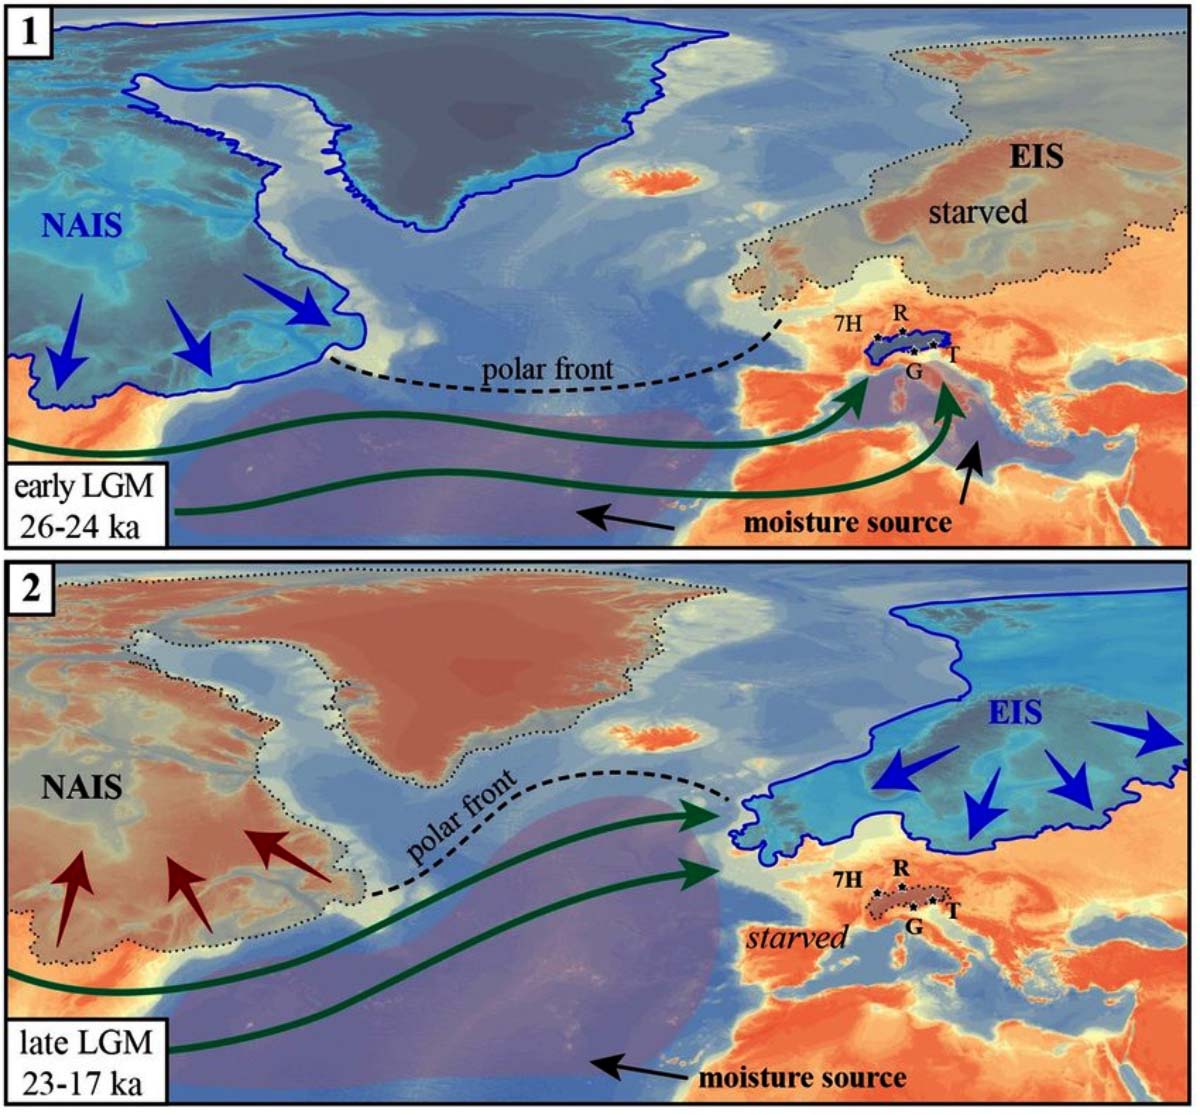
The original Image above is available at https://www.nature.com/articles/s41598-017-02148-7
WHAT CAUSES AN ICE AGE
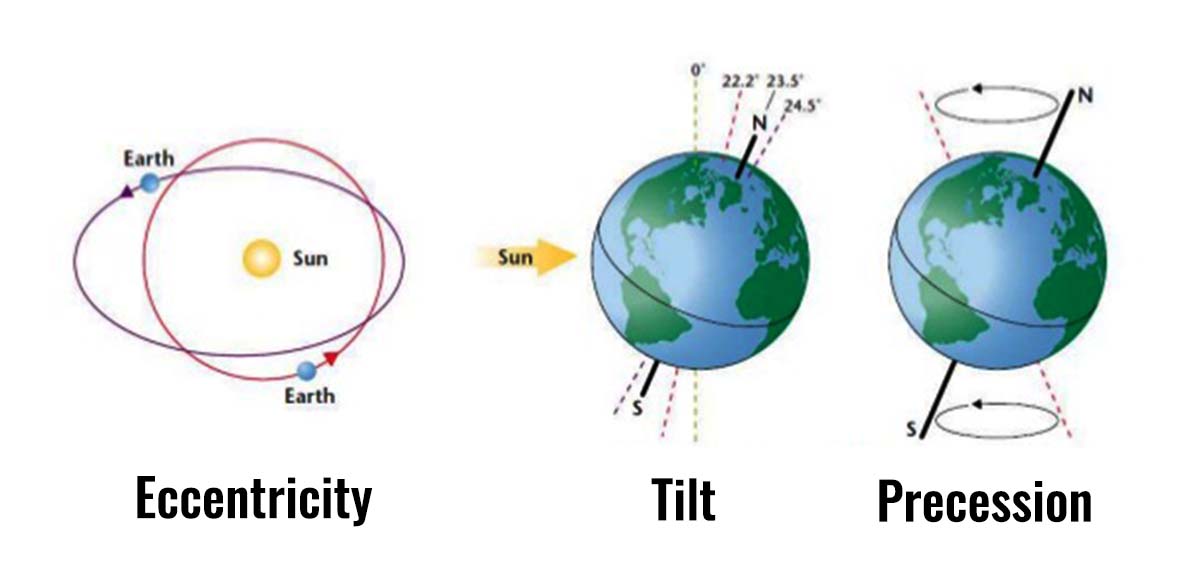
The causes of the ice ages are well known and linked in particular to astronomical forcing. Variations in eccentricity, axial tilt, and precession resulted in cyclical variation in the solar radiation reaching the Earth. These orbital forcings strongly influence the Earth’s climate patterns. Wavering periodically give rise, when their effects are in phase, to glaciations every 100 thousand years.
The Earth’s axis completes a precession cycle every 26 thousand years. The elliptical orbit completes one cycle every 22 thousand years. Furthermore, the angle between the Earth’s axis and the normal of the orbital plane varies periodically between 22.5° and 24.5°, with a period of 41 thousand years.
The combined effects of these three types of orbital cycles affect the amount of solar energy that reaches the Earth in different seasons, especially at high latitudes.
With cold weather, snowfalls of course increase during the ice age. More, summer ablation is also greatly reduced. The consequence is that snowfalls fail to melt in the short summers characterized by a polar front much further south.
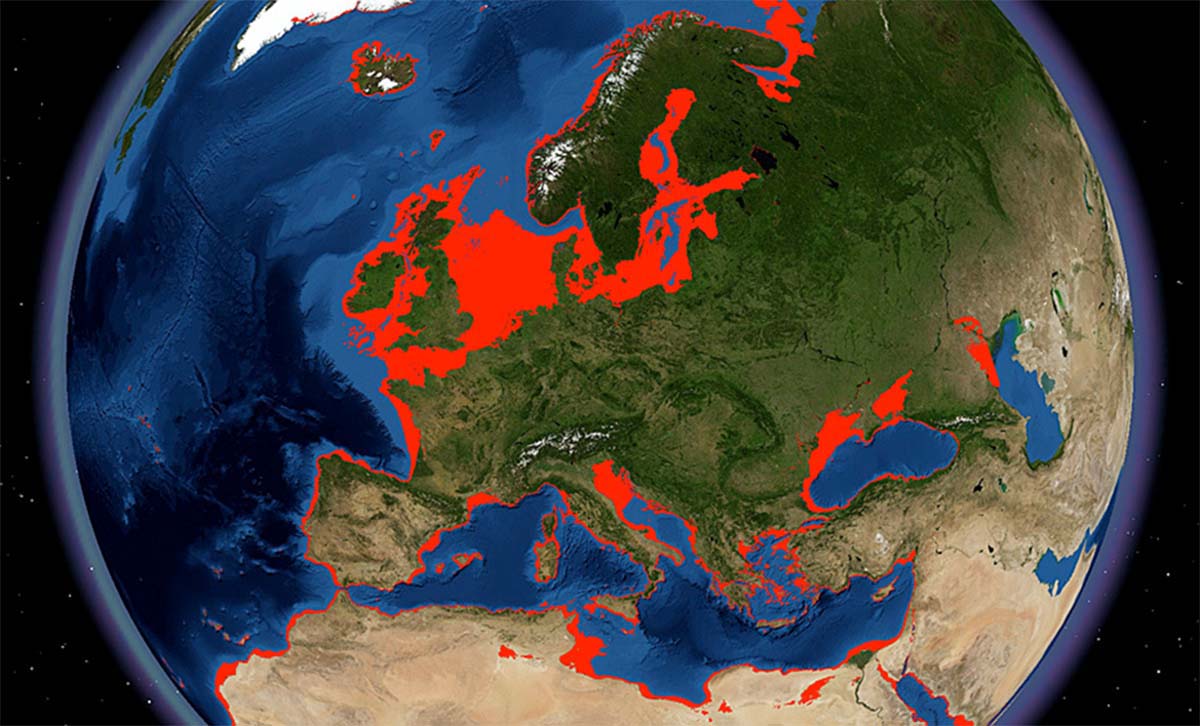
This causes massive amounts of freshwater to freeze in continental ice. An ice age, in the end, helps remove part of the water of the atmosphere from the Earth’s hydrological cycle. The most direct consequence is a global sea-level lowering.
In the image below you can see in red the areas of land that emerged during the Last Glacial Maximum in Europe.
Therefore, the polar vortex is a meteorological and climatological structure so well known today. It certainly makes thousands of weather amateurs dream about it. But at the same time it makes millions of people fear about it, due to the extreme cold, snow, blizzards it brings with it.
The polar vortex, in the past, represented a fundamental element in modulating variations of the Earth’s climate history and reacted, as well, responding to changes in climatic parameters. In particular, the last 2.56 million years have been characterized by a sequence of recursive ice ages and shorter interglacial periods.
Today, we are lucky enough to be able to taste from time to time what the average conditions might have been during the Last Glacial Maximum. We can experience short-time ice-age conditions thanks to the polar vortex south shift. The polar vortex is able to bring to our home, in a short time, the typical conditions the Earth was facing 20 thousand years ago.
We will keep you updated on this and much more, so make sure to bookmark our page. Also, if you have seen this article in the Google App (Discover) feed or social media, click the like button (♥) to see more of our forecasts and our latest articles on weather, climate, cryosphere, and nature in general.