Arctic Amplification and modification of the Rossby waves with the increasingly warm sea surface among the possible causes of winters with extreme snow amount at high altitudes in few sectors of the Southern Alps. This has led to a slight increase in the volume of several small glacial bodies of the Julian Alps in the southeastern sector, in the last 15 years. In the long term, the influence of the Atlantic Multidecadal Oscillation (AMO) modulated the glacial evolution of the Alps in the past.
Glaciers, ice caps, ice sheets, and sea ice are melting at an accelerated rate. Today they lose roughly 31% more snow and ice every year than they did 15 years earlier according to a long record of satellite measurements of all mountain glaciers in the world.
Glaciologists and climatologists all over the world blame human-caused global warming. Among the highest melt rates on the planet, there are glaciers in Alaska. The Columbia glacier retreats about 35 m (115 feet) every year and all Alaskan glaciers melt 100 times faster than previously thought.
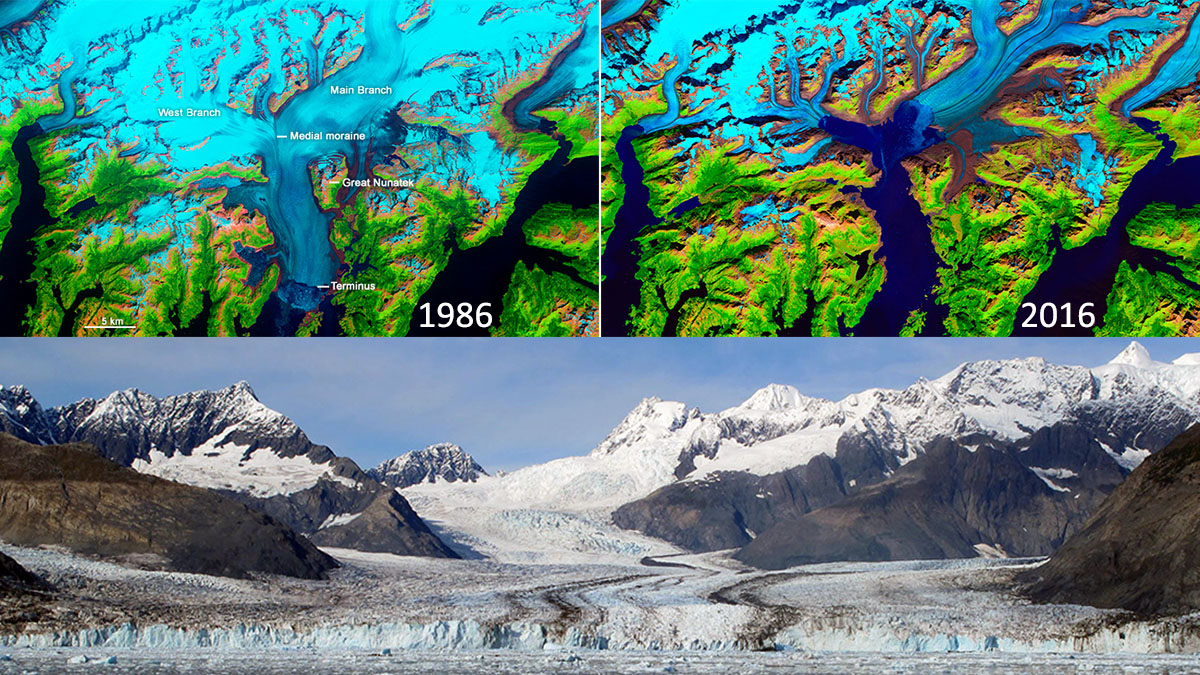
Melting glaciers and ice sheets on land means the sea level rises. Another contributor to sea-level rise is the increase in volume that occurs when water is heated, called thermal expansion. Both thermal expansion and ice melt are the results of the rise in global average temperatures on land and sea. Fast sea level rise is one of the most important issues related to global warming.
The Greenland ice sheet represents the second largest continental ice mass besides Antarctica. Its mass has rapidly declined in the last several years due to surface melting and iceberg calving.
In the video below credits NASA and JPL/Caltech satellite data indicate that between 2002 and 2020, Greenland shed an average of 279 billion metric tons of ice per year, adding to global sea-level rise.
The European Alps is one of the world’s areas with the highest loss of glacier mass. This is mainly due to increased melting caused by longer and warmer summers. Glaciers in the European Alps lost about half of their volume between 1850 and 1975. Another 25% of the remaining amount melted between 1975 and 2000 and an additional 10-15% in the first 5 years of the century.
The Great Aletsch glacier is the longest alpine valley glacier and part of the Unesco World Heritage Site. This glacier is over 20 km long, up to 800 meters deep, and around 80 square km in size. It contains over a fifth of the total ice volume in the Swiss Alps. After slowly retreating since 1870, it lost 32% of its mass and retreated by about 8.5 km in the last 30 years. The evolution of Aletsch glacier since 1856 up to present days is available clicking here.

Figure: Image of the Aletsch glacier modified from the original available at https://www.aletscharena.ch
HOW GLACIOLOGISTS ASSESS GLACIER’S HEALTH
Glaciologists investigate Glacier’s health through repeated mass balance measurements, also referred to as surface mass balance. Mass balance of a glacier is the difference between the snow accumulated in the winter and the snow ice melted during the ablation season.
Such mass differences are generally given in meters of water equivalent (w.e.). If summer melting exceeds what is gained in the previous winter, this means the mass balance of the glacier is negative and the glacier recedes.
On the contrary, If the mass of snow accumulated on glaciers exceeds the mass of snow and ice lost during the summer months, this means the glacier is in a “healthy” state. In this case, mass balance is defined as positive and the glacier expands in size advancing. Glaciers gaining and losing the same amount of snow and ice are though in equilibrium, still “healthy”, and will neither advance nor recede.
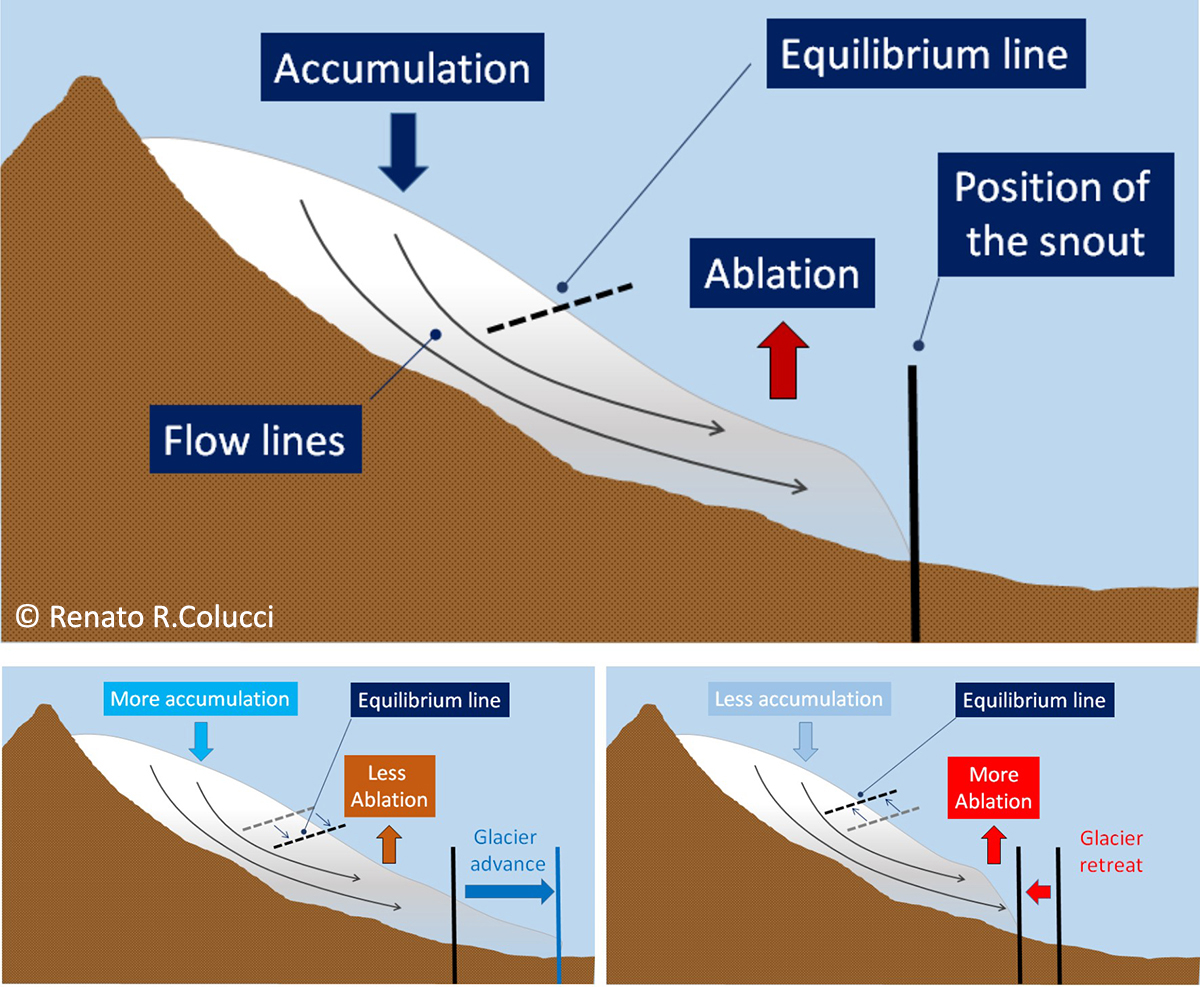
There always should be a sector of the glacier at a certain altitude where the annual mass balance is zero. This elevation is the Equilibrium Line Altitude (ELA) where accumulation equals the melting. It is generally very close to the median elevation of the glacier.
To be clearer, when talking about glaciers advancing, receding, or being in equilibrium we refer to the position of the snout. It is modulated by the continuous flow of the glacier under the force of gravity and internal deformations of the ice body. Ice moves from the upper accumulation zone down to the lower ablation zone where it melts.
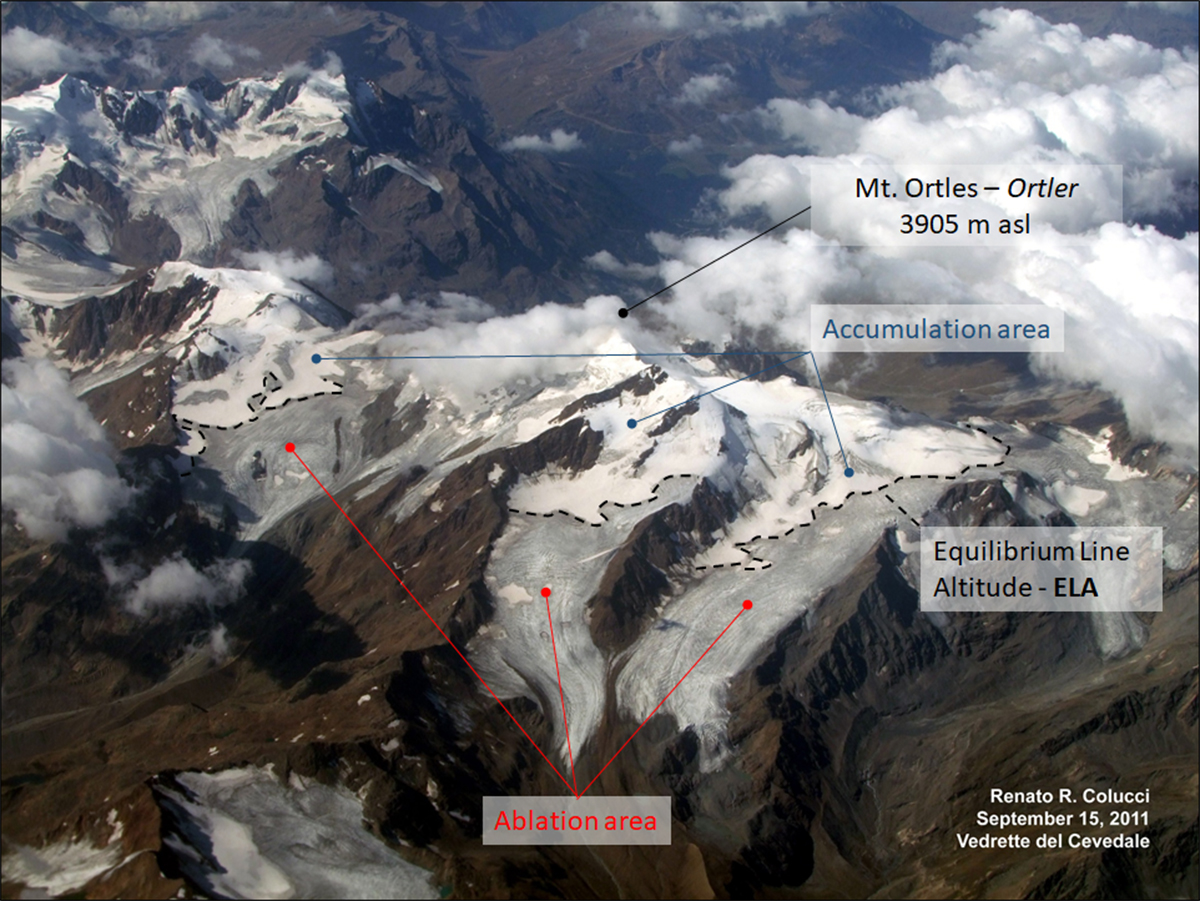
As a matter of fact, the mass balance of a glacier strictly depends on climatic factors, particularly winter precipitation and summer temperature. Precipitation rules accumulation processes including snow and ice from direct precipitation, avalanches, and windblown snow. Conversely, summer temperature rules ablation processes. For this reason, a cold dry winter followed by a long hot summer represents the worst-case scenario for glacier’s health.
In the European Alps 4396 glaciers currently still exist with a total area of 1806 ± 60 km2. The ELA lies at 3234 m asl averaged over the last v30 years (1991-2020). This means that, on average, above this altitude, we are in the accumulation area of alpine glaciers.
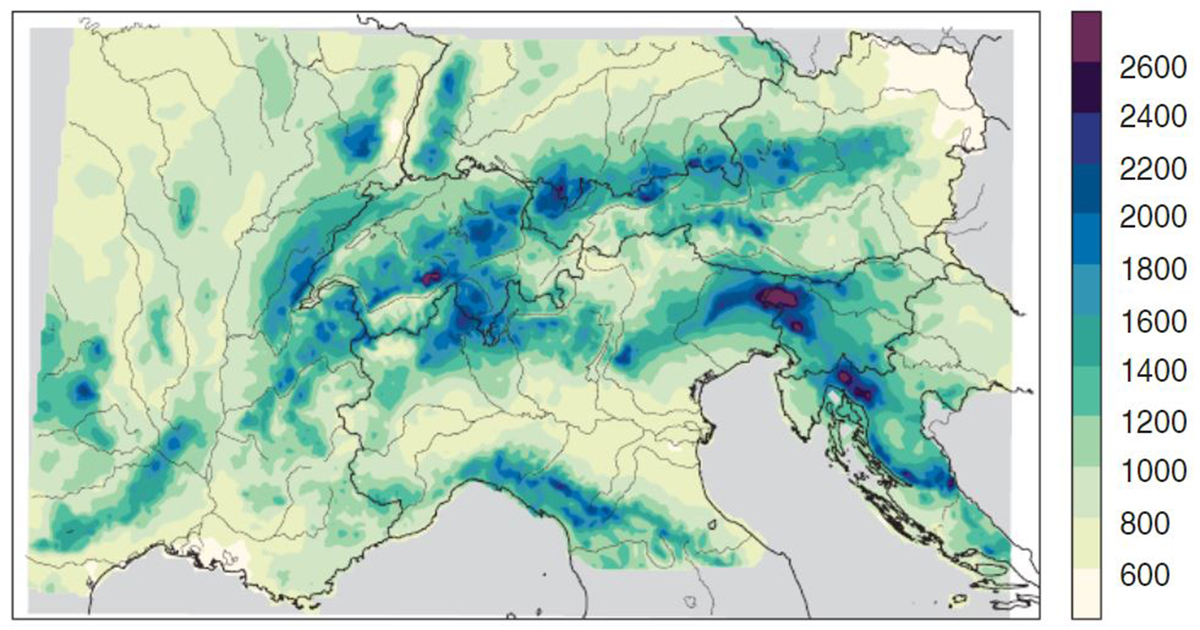
But there are places in the Alps where the ELA is much lower. The southeastern sectors where precipitation is very high represent one of them. Precipitation is particularly abundant in the Julian Alps sector spreading between Italy and Slovenia. Here, Mean Annual Precipitation is greater than 3000 mm of water equivalent (3000 liters of water or snow melted per square meter).
Figure © International Journal of Climatology, by Isotta et al. (2013)
EVOLUTION OF GLACIERS IN THE SOUTHEASTERN ALPS FROM THE END OF THE LITTLE ICE AGE
In the Julian Alps, the easternmost sector of the southern alpine chain, several residual ice bodies very small in size but still active exist. They refer generally to the size category of small mountain glaciers, glacierets, and ice patches. In this sector of the Alps, almost 150 years ago there were 19 main small glaciers covering all together about 2.4 km2.
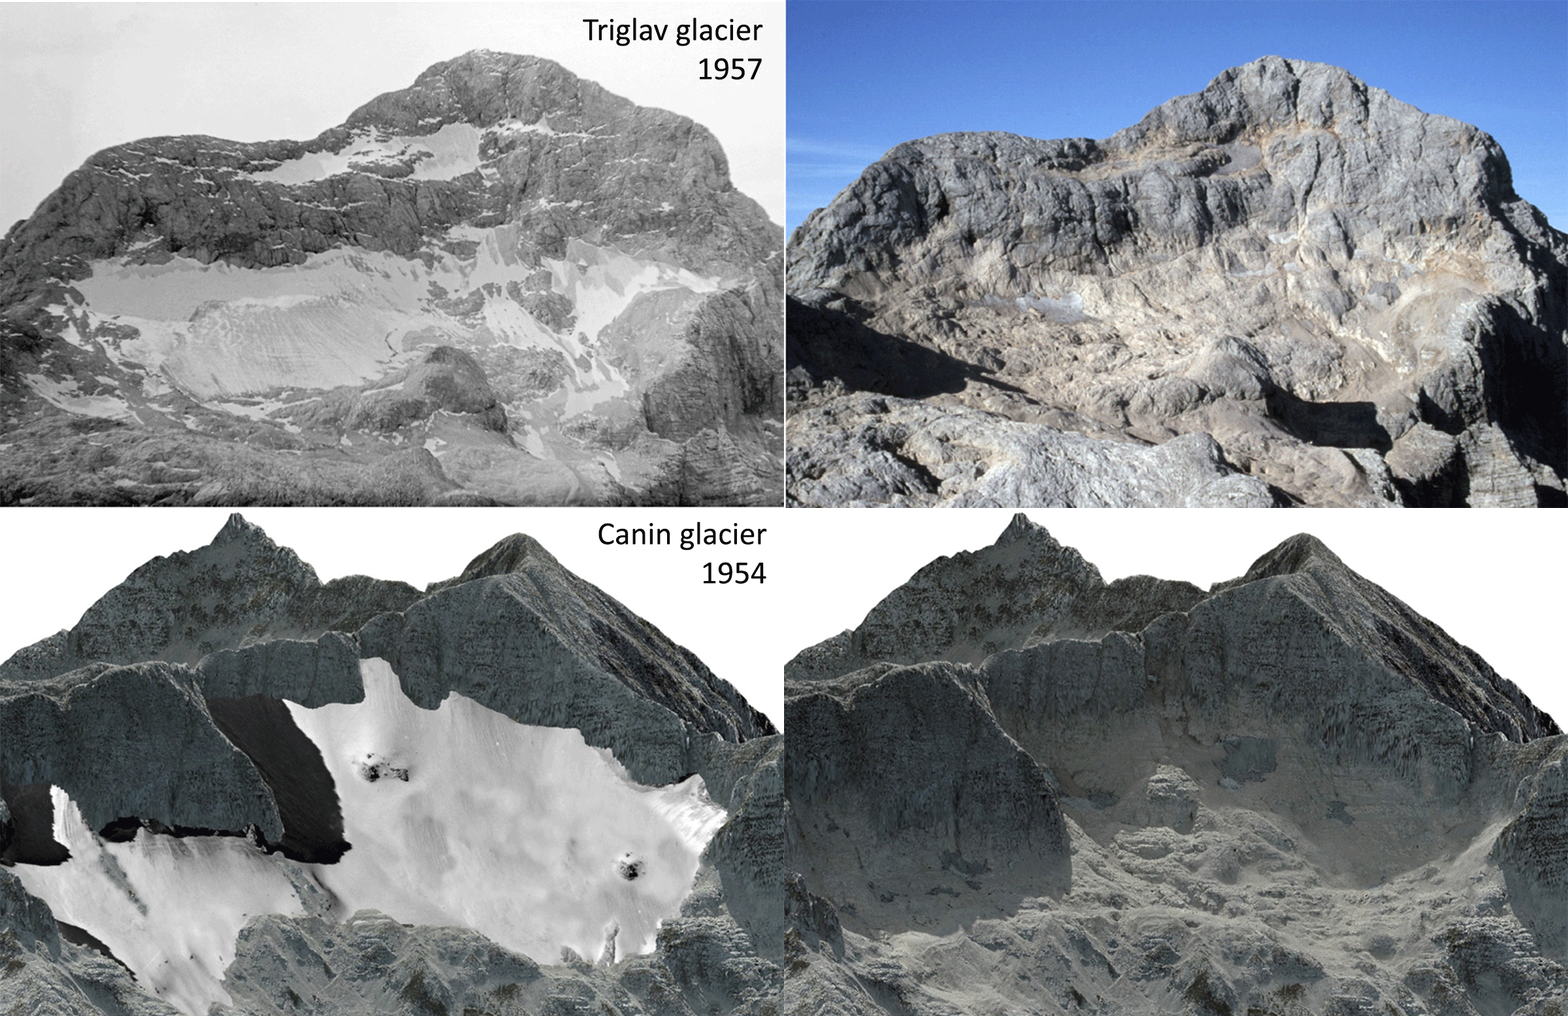
The largest glacier of the Julian Alps was the Canin glacier (Italy), followed by the Zeleni Sneg glacier on Triglav (Slovenia). After the Little Ice Age alpine peak, which occurred between 1630 and ~1850 A.D., these glaciers reduced by about 84% in area and 96% in volume. The Canin glacier, now splitted in several smaller units, reduced from 0.678 km2 to 0.081 km2. The Zeleni Sneg glacier from 0.442 km2 to 0.004 km2.

Besides geomorphological evidence proving the strong retreat glaciers are undergoing in the Alps after the LIA peak, several old pictures and paintings testify to the massive ice melting which is unprecedented during the Holocene. The Holocene represents the present geological epoch that started approximately 11650 years before the present at the end of the Younger Dryas cold event occurred from 12500 to 11650 years ago.
In the animation below we collected two images from the 1950s of Triglav and Canin glaciers and compare them with the present situation. It is indeed clear as most of the ice from the last century is gone.
The long-term evolution of these very small glaciers and ice bodies matches well with changes in mean temperature of the ablation season linked to the variability of Atlantic Multidecadal Oscillation (AMO).
The AMO is a climate index explaining multi-decadal sea surface temperature (SST) variability in the North Atlantic Ocean from 0 to 70°N. AMO has a cycle of 65–70 years and 0.4° C range between extremes. Accordingly, as one of the most prominent modes of climate variability, AMO also influences Europe’s climate.
In the figure below from this recent study, time-series and spatial representations of the AMO are explained. In panel (a) the AMO index 1856–2015; panel (b) shows mean SST anomaly maps (1951–1980 climatology) for warm (left panel) and cool (right panel) years; panel (c) shows average 10-m wind speed during AMO-warm and AMO-cold phase respectively.

The size of glaciers in the Alps has been seen to react in response to AMO-driven variations at least over the last 250 years. Superimposed there are now the effects of Global Warming. AMO influences the mass budget of glaciers mainly through minima and maxima in temperature of the ablation season.
The fast and steady increase in mean summer air temperature from the early 1980s is further superimposed to the AMO. It explains the dramatic glacier reduction that is particularly evident after the 1980s. The message here is that the “cyclic” curve is therefore not to be imagined regularly developed along a plane but inclined downwards.
To better explain what we are talking about, in the figure below we plotted with the red line the Canin glacier length variation and with the blue line the AMO index from NOAA.

NOW THIS IS BIZARRE! GLACIERS REMAINED STABLE IN THE LAST 15 YEARS IN THE JULIAN ALPS
Although summer temperature continued to rise here, small ice bodies of the Julian Alps remained actually stable in the last 15 years instead of rapidly disappearing, as it should be, due to their smaller size. Few of them rather grew in size with a long-term positive mass balance according to a recent study.
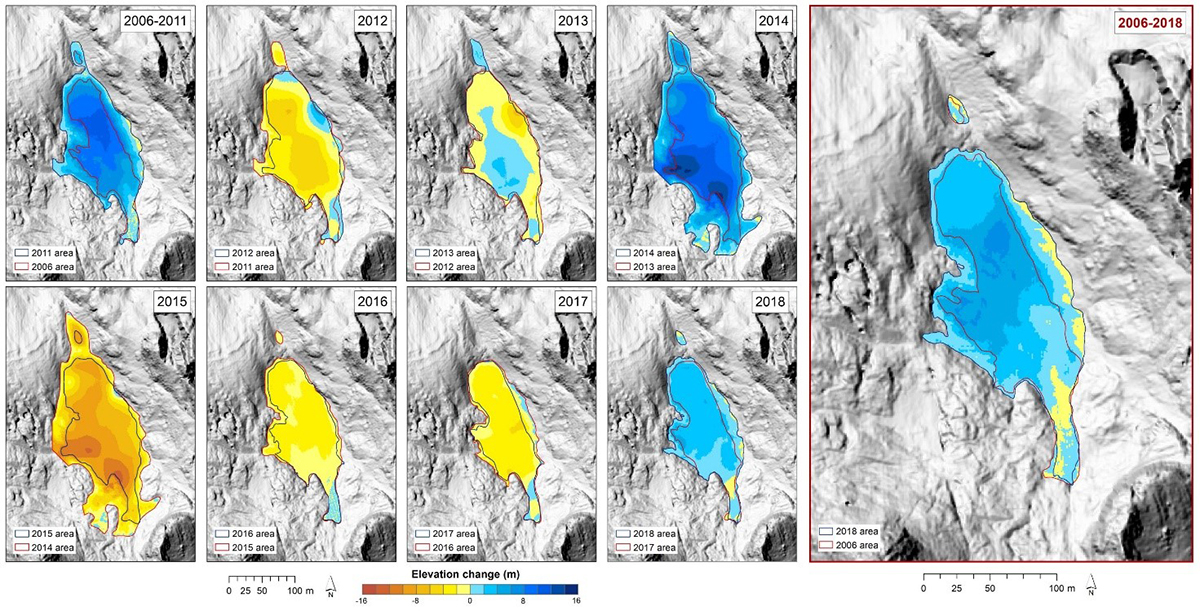
In particular, the residual ice body of the eastern Canin glacier gained 3.53 m of thickness in the period 2006-2018 (see figure below). Converting this value with the density of this mixture of frozen material made by snow, firn and ice (791 kg per cubic meters), this accounts for 2.79 m of water equivalent.
Glaciologists, by using different methodologies including aerial photogrammetry, geodetic surveys, aerial laser scanning, and light detection and ranging, realized how such very small glaciers were able to slightly increase their size and volume.
Few of such ice bodies simply lounge in a steady-state behavior mocking their larger counterparts in the rest of the Alps. The image below shows the annual elevation change rate for the eastern Canin glacier for individual years (smaller images) and for all periods from 2006 to 2018 (larger image)
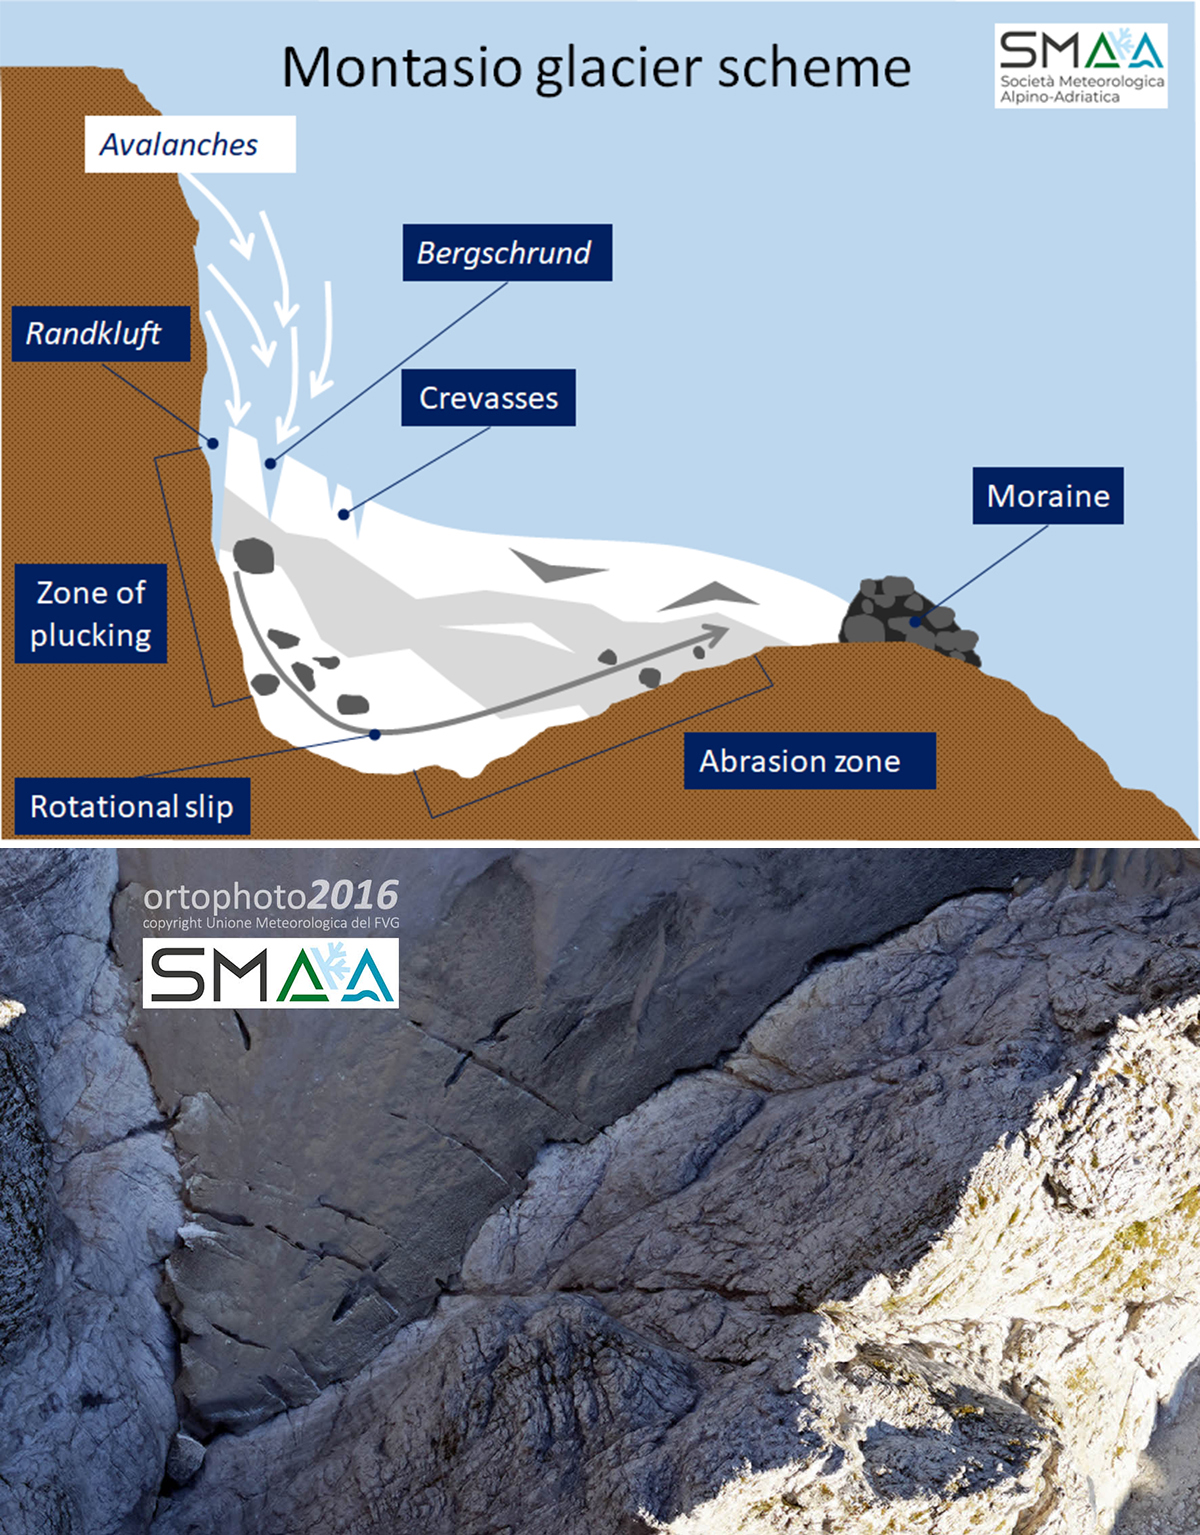
Also, the Montasio glacier, the only ice body of the Julian Alps that can actually be properly defined as such, undergone a similar fate a study showed. The Montasio glacier covers an area of 0.066 km square kilometers and is considered the lowermost Italian glacier with a median elevation of 1900 m. The ice body is characterized by a steep cone-shaped accumulation area fed by frequent winter avalanches, while a gently sloped surface characterizes the ablation area.
Despite its low altitude, a comparison with a wide sample of Alpine reference glaciers in the period from 2006 to 2019 clearly shows how the Montasio Glacier, as the Canin did, has been much less impacted by the present warm phase, at least until now.
The 2006-2019 mass loss rate of the Montasio Glacier was -0.07 m w.e. per year. This is an order of magnitude lower than the rate of −0.87 ± 0.07 m w.e. per year recently estimated for all the glaciers in the Alps and Pyrenees, in the period from 2006 to 2016.
The image below shows annual elevation change rate for (a) individual years and (b) two sub-periods. At bottom annual and cumulated geodetic mass balance compared with the average glaciological annual and cumulated balance of nine reference glaciers in the European Alps, in the period from 2006 to 2019.
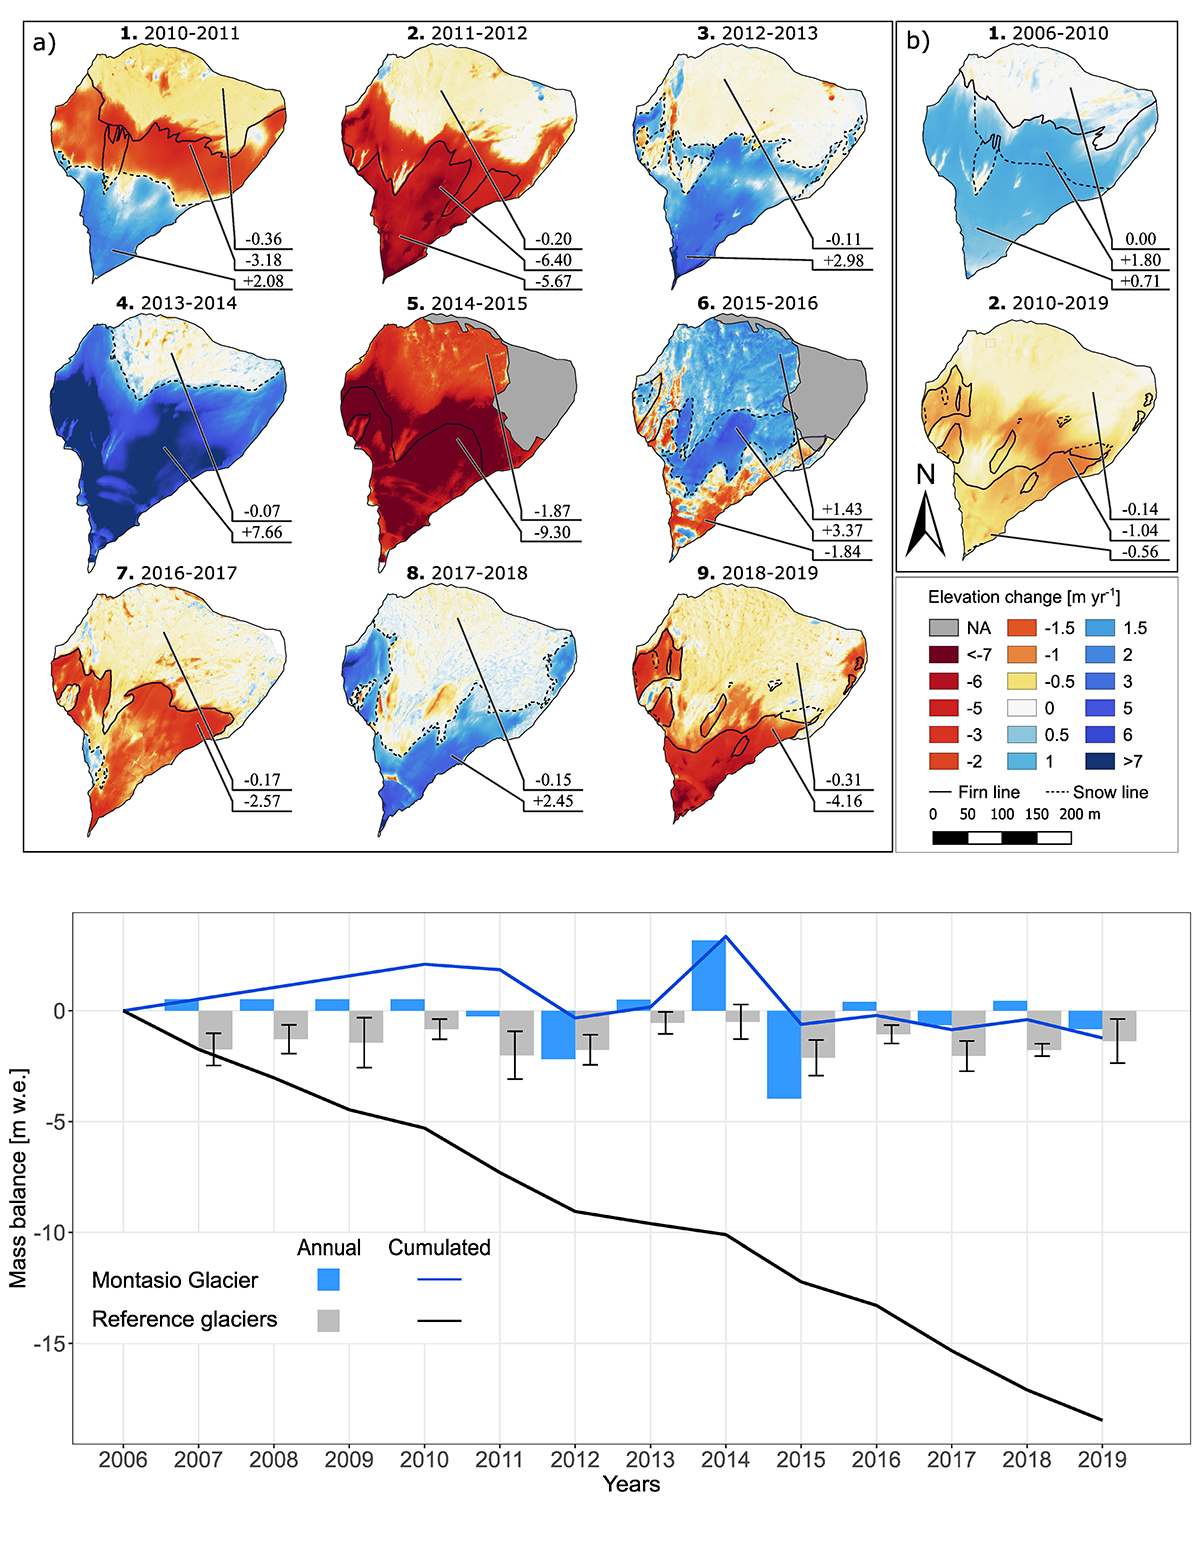 Figure © Atmosphere MDPI, De Marco et al. (2021)
SEVERAL YEARS OF POSITIVE MASS BALANCE, BUT WHY IS THIS HAPPENING?
We just discussed that in the last three decades temperature raised constantly in the Alps and summer became longer and warmer. As a matter of fact, the mean annual air temperature above 2000 m in the Julian Alps and in the last 10 years (2010-2020) was 1.5°C higher than the 30-years-climatology 1961-1990 a study shows.
If we look at the 1991-2020 period, we see how the mean annual air temperature was roughly 1.0°C higher than the previous 30 years. In summer this difference is even larger. The last ten years were 2.3°C warmer than the 1961-1990 climatology. 1991-2020 mean summer air temperature was 1.7°C warmer than the previous 30 years.
The figure below shows the annual mean summer air temperature in the Julian Alps at an altitude of 2200 m asl (grey dots). The blue line is a 10-years moving average better highlighting the trend. The abrupt warming starts at the beginning of the 1980s.
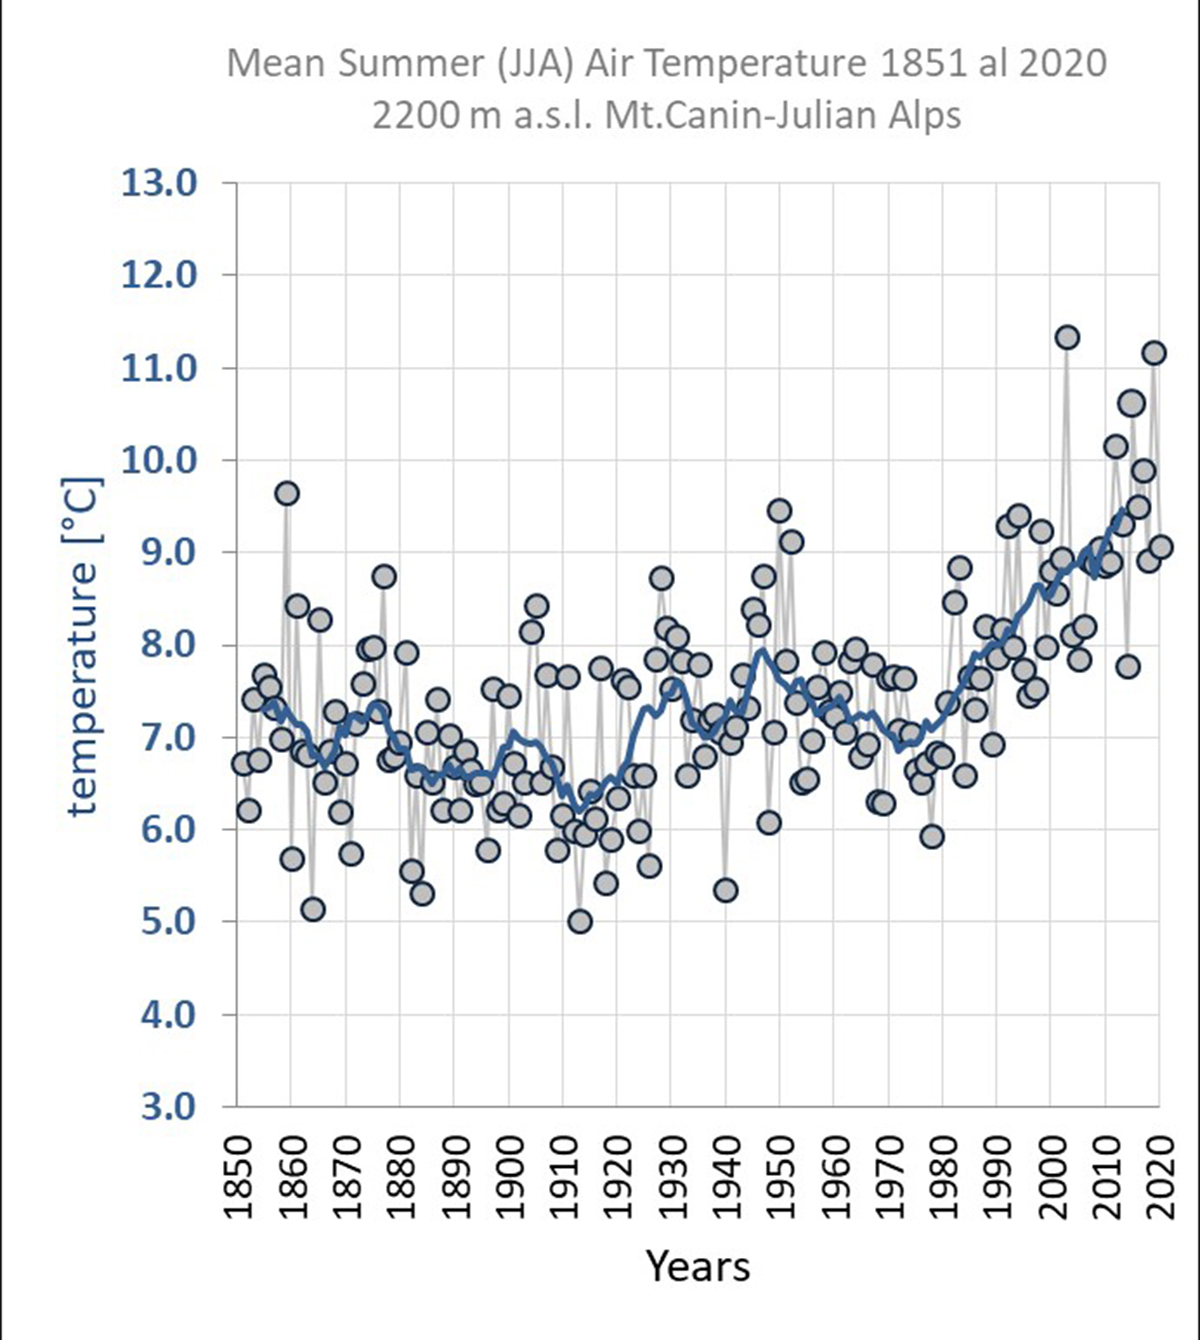
Today, more snow and ice melt compared to the past. Applying a degree-day model for this alpine sector, glaciologists found out how the potential melting increased about 29 mm w.e. per year. From roughly 4119 mm w.e. in the late 1970s, in the late 2010s was equal to 5279 mm w.e. per year. You can clearly see this in the figure below where, on the right, we plotted the length in days of the ablation period. From the late 1970s up to now the melting period increased by roughly two weeks.
For statistical purposes only, the less effective ablation seasons were summer 1984 and 1996 with 3446 and 3621 mm w.e., respectively. The most effective ablation seasons were in 2003 and 2012 with 5747 and 5755 mm w.e. respectively. Summer 2003 recorded the highest temperature for a shorter period. The 2012 ablation period lasted longer but was less extreme in terms of absolute values. Recent positive mass balance cannot thus be attributed to favorable temperature!

HERE IS THE ANSWER: HIGHER FREQUENCY OF EXTREMELY SNOWY WINTERS
The recent increase in winter precipitation and few seasonal winter extremes brought much higher than average snow accumulation over such ice bodies. In the image below we plotted winter precipitation and snow total accumulation for the period 1979-2018.
From 2006 to 2018 this precipitation excess led to ice bodies stability and overall a recorded positive mass balance. New bare ice outcropped over the surface of several ice patches. This proves a long-term trend of ice accretion in this small, but significant, alpine area between Italy and Slovenia.
Two small cirque glaciers in the Orobie Alps, in the central-southern range, also reported the occurrence of particularly snowy winters in 2008–2009 and 2013–2014 according to a recent research. This excess of snow provided accumulation for perennial ice and firn patches that we’re able to survive very warm summers. This area indeed shares several common features with the Julian Alps especially in terms of orographic precipitation.

SO WHY JULIAN ALPS ARE GETTING MORE SNOW LATELY?
First, local topographical factors help larger accumulation from avalanches. Nevertheless, the most relevant cause seems linked to extreme precipitation events induced by recent warming. But the real cause of such changes might be located far from the Alps.
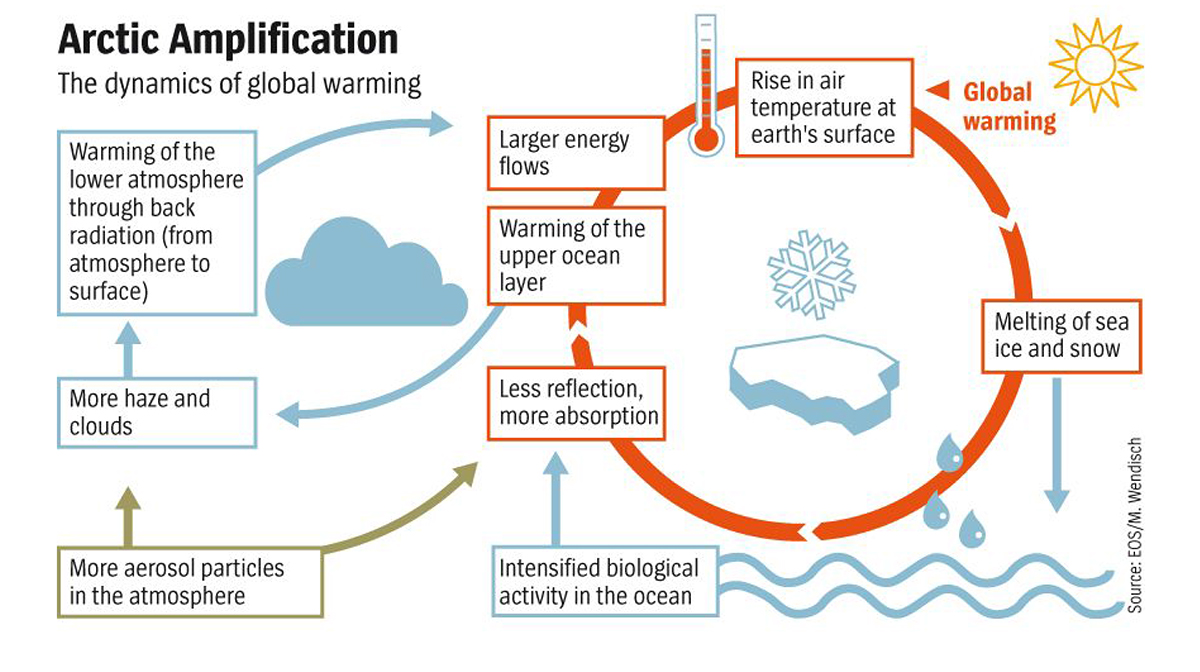
The past few decades have been characterized by Arctic warming, which has almost doubled compared with the entire northern hemisphere. A combination of increased anthropogenic global warming and positive feedback leads to the so-called Arctic Amplification (AA).
Observations and modeling recognized several large-scale modifications in the atmospheric circulation. These changes lead to sea-ice loss and earlier snowmelt, which in turn affect precipitation, seasonal temperatures, storm tracks, and surface winds in mid-latitudes.
The panel below explains all the processes involved in the AA.
Singular strong weather events normally have a dynamical origin and many of them result from persistent weather patterns, typically associated with blocking and high amplitude waves in the upper-level flow. Evidence links AA with an increased tendency for a slower eastward movement of Rossby Waves. This in turn favors weather extremes triggered by persistent weather conditions due to amplified flow trajectories.
Rossby waves, also known as planetary waves, naturally occur in rotating fluids. Within the Earth’s ocean and atmosphere, these waves form as a result of the rotation of the planet and give birth to the typical meandering of the global atmospheric circulation.
The process leading to an increased meandering and slow-down of the Rossby Waves is known as Quasi Resonant Amplification (QRA) and is briefly explained below in the figure.
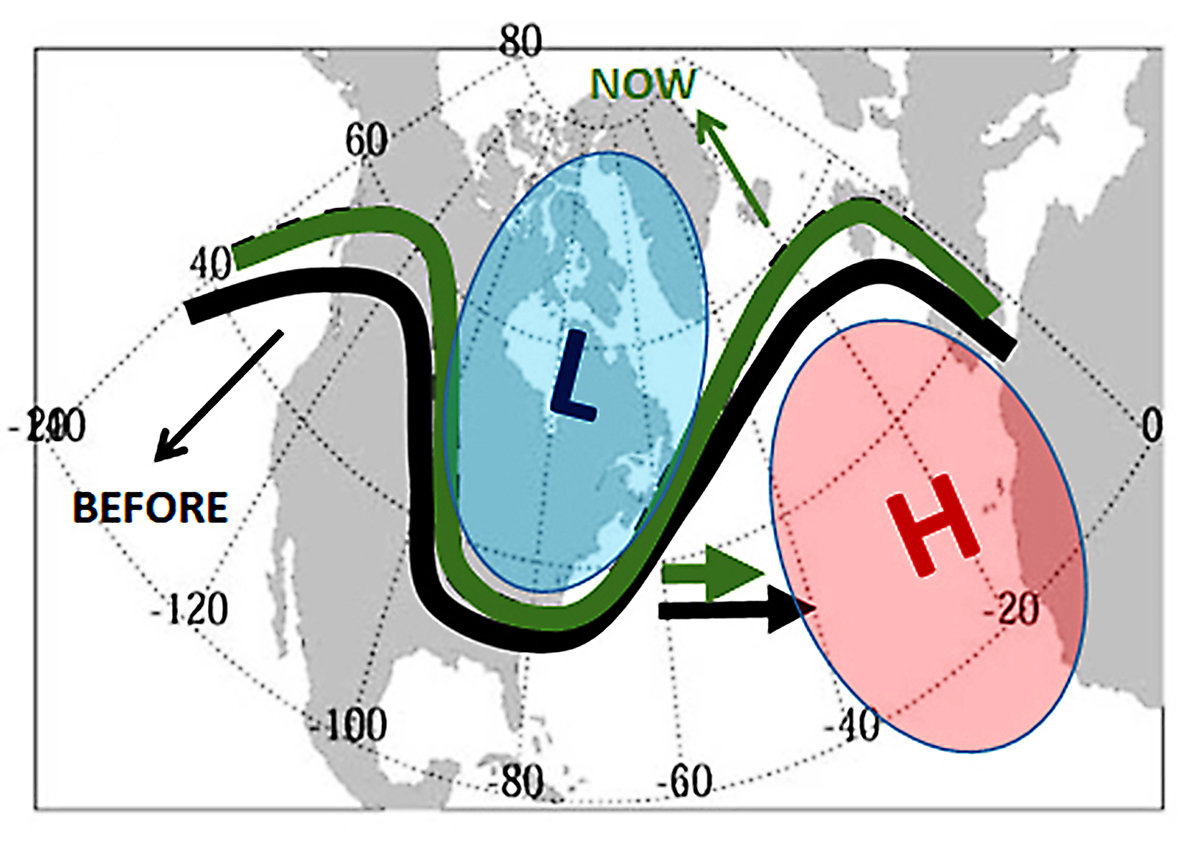
Coming to the end, we can summarize by saying that recently recorded extreme and prolonged winter snowfalls were sufficient to offset longer and warmer summers in this alpine sector. Such extreme seasonal events were also favored by the thermodynamic structure of the low troposphere and increased Sea Surface Temperature.
In fact, a recent study shows as the sea surface temperature of the norther Mediterranean increased by about 1.3°C in less than one century.
More, evidence links the occurrence of amplified upper-level flow trajectories to the Arctic Amplification and, therefore, to ongoing global warming. Although further summer warming is expected in the next decades, modification of weather patterns due to a set of teleconnections and higher occurrence of extreme and persistent snowfall events in winter might represent a crucial input in the survival of small glacial remnants in maritime mountain areas.
But winter temperatures are also increasing, and snow is turning into rain every year higher in the mountains. This might be even more crucial in the next future.
See also:
