The Winter season 2021/2022 forecast update shows the stronger influence of a new La Nina phase developing. It will modify the jet stream pattern over North America and the Pacific Ocean, extending its reach to the rest of the world. The Winter forecast from major weather models captures this jet stream altering by the La Nina and shows its possible weather outcomes.
To try and understand the Winter season and its forecast, we must realize that there are many influences when it comes to weather. Global weather is a very complex system, with many large-scale and small-scale climate drivers. We will look at what this La Nina is and how it will influence the Winter weather season of 2021/2022.
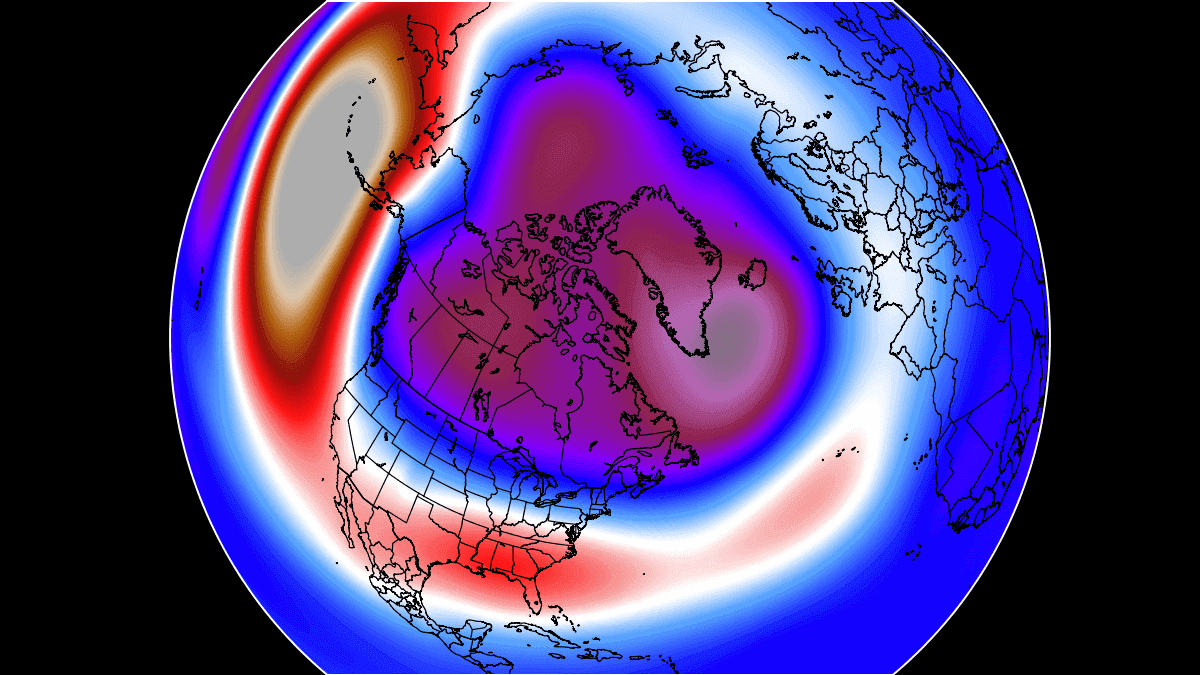
Below we have an example of a pressure pattern in a strong La Nina winter. The main takeaway is a large and strong high-pressure area in the North Pacific, and the jet stream moving across the northern United States. But we will see if we can find anything similar in the updated forecast for Winter 2021/2022.
FROM THE OCEAN AND THE ATMOSPHERE
The development of a cold La Nina phase is the key feature in seasonal weather development for at least the next 6 months. This La Nina is actually just a different name for cold ocean temperatures in the tropical Pacific ocean. The actual ocean-atmosphere system is called ENSO.
To keep it simple, ENSO is short for “El Niño Southern Oscillation”. This is a region of ocean in the tropical Pacific, which changes between cold and warm phases. The tropical trade winds (the easterly winds that circle the Earth near the equator) usually initiate or stop a certain phase, as they mix the ocean surface and impact the ocean currents.
The image below from NOAA Climate shows the typical circulation during a negative ENSO event as we have now. Air is descending in the eastern Pacific, creating stable and dry weather conditions, while rising air in the western Pacific causes frequent thunderstorms and a lot of rainfall.
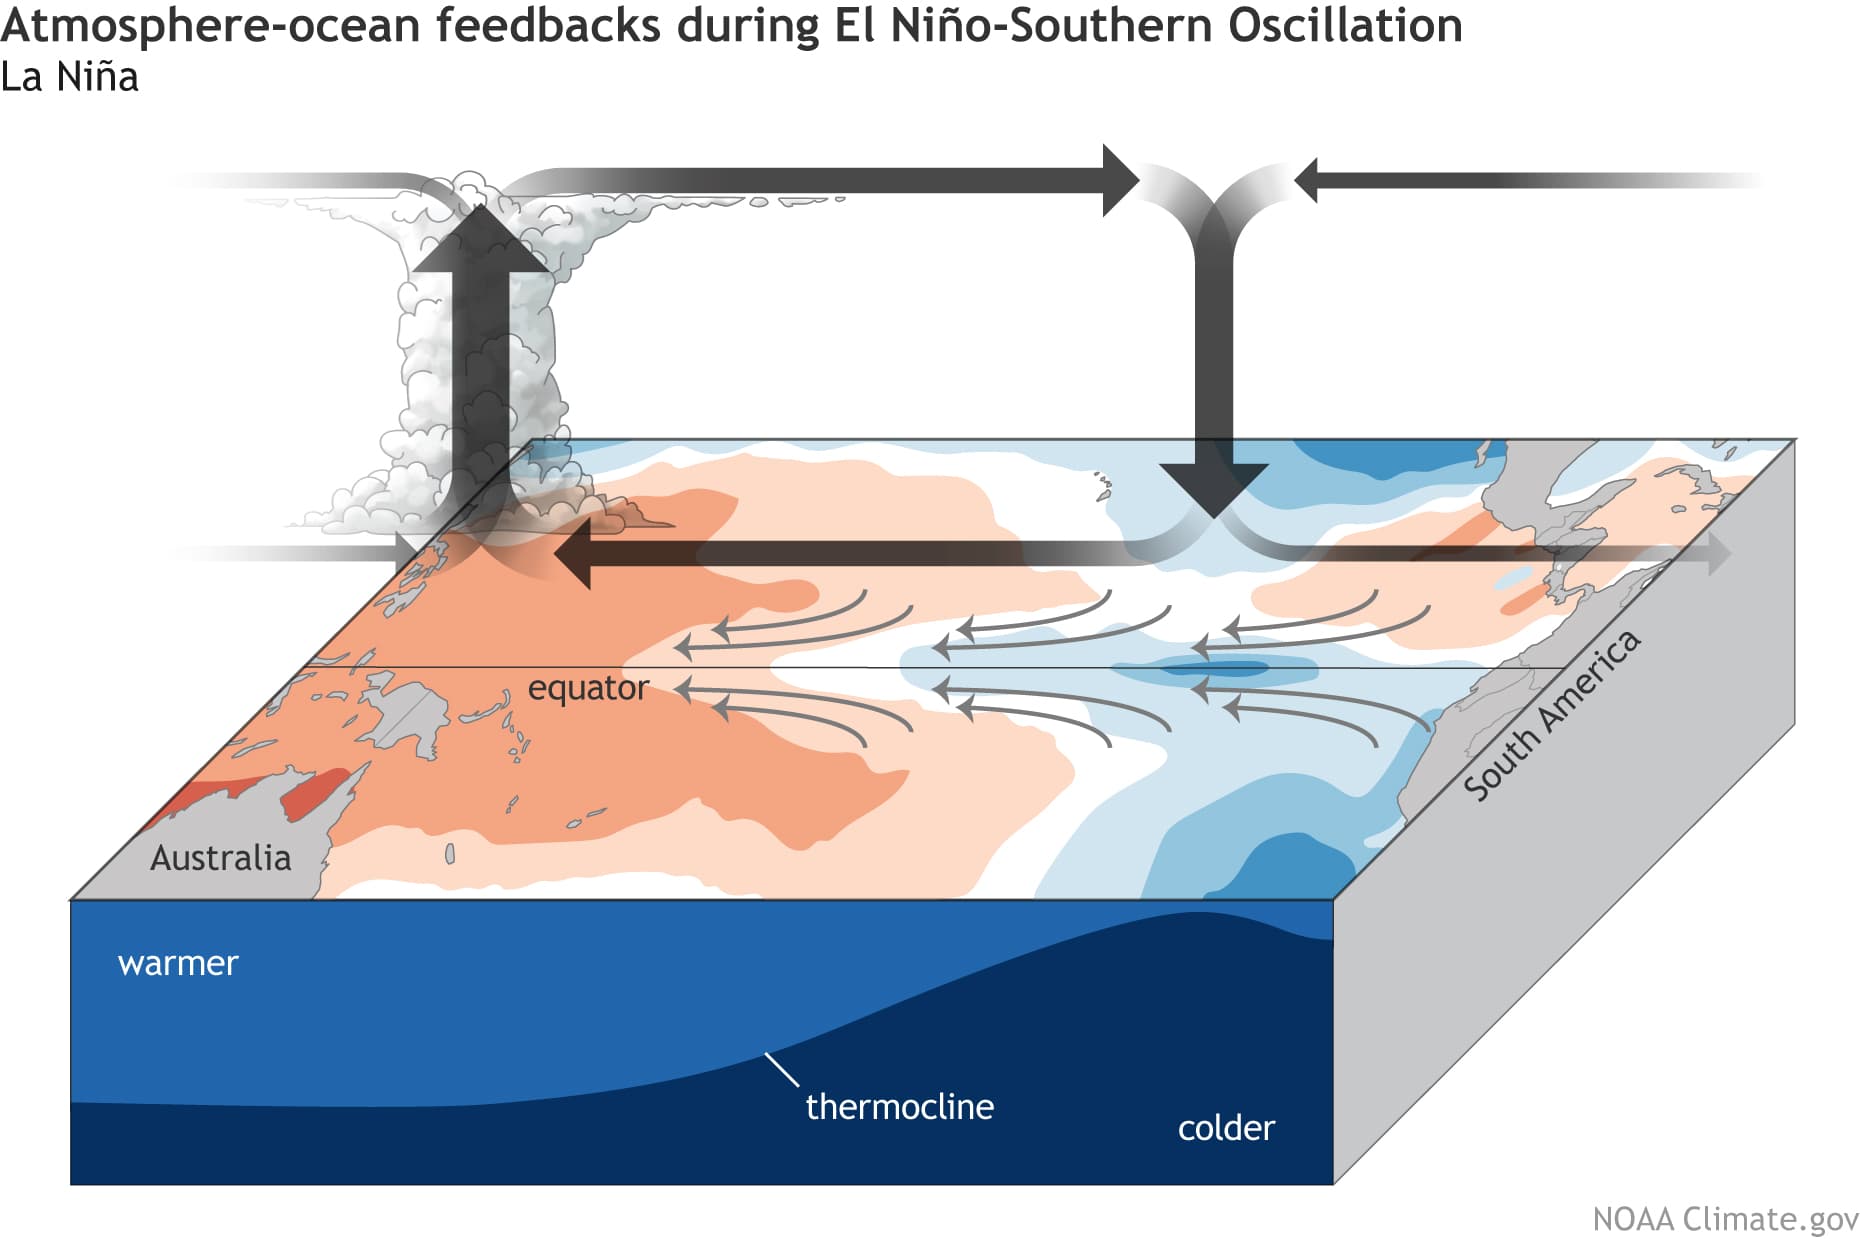
ENSO has a major impact on the tropical convection patterns and consequently on the ocean-atmosphere system, through which its influence is distributed globally. We usually observe a global scale shift in pressure patterns during the emergence of the ENSO phases, each having a unique impact on the weather globally.
Below we have an image that shows all the ENSO regions. The main regions are 3 and 4 and cover a large part of the tropical Pacific. Most calculations and diagnosis is based on a combination of both the 3 and 4 areas, which is why the main region is called ENSO/Nino 3.4.
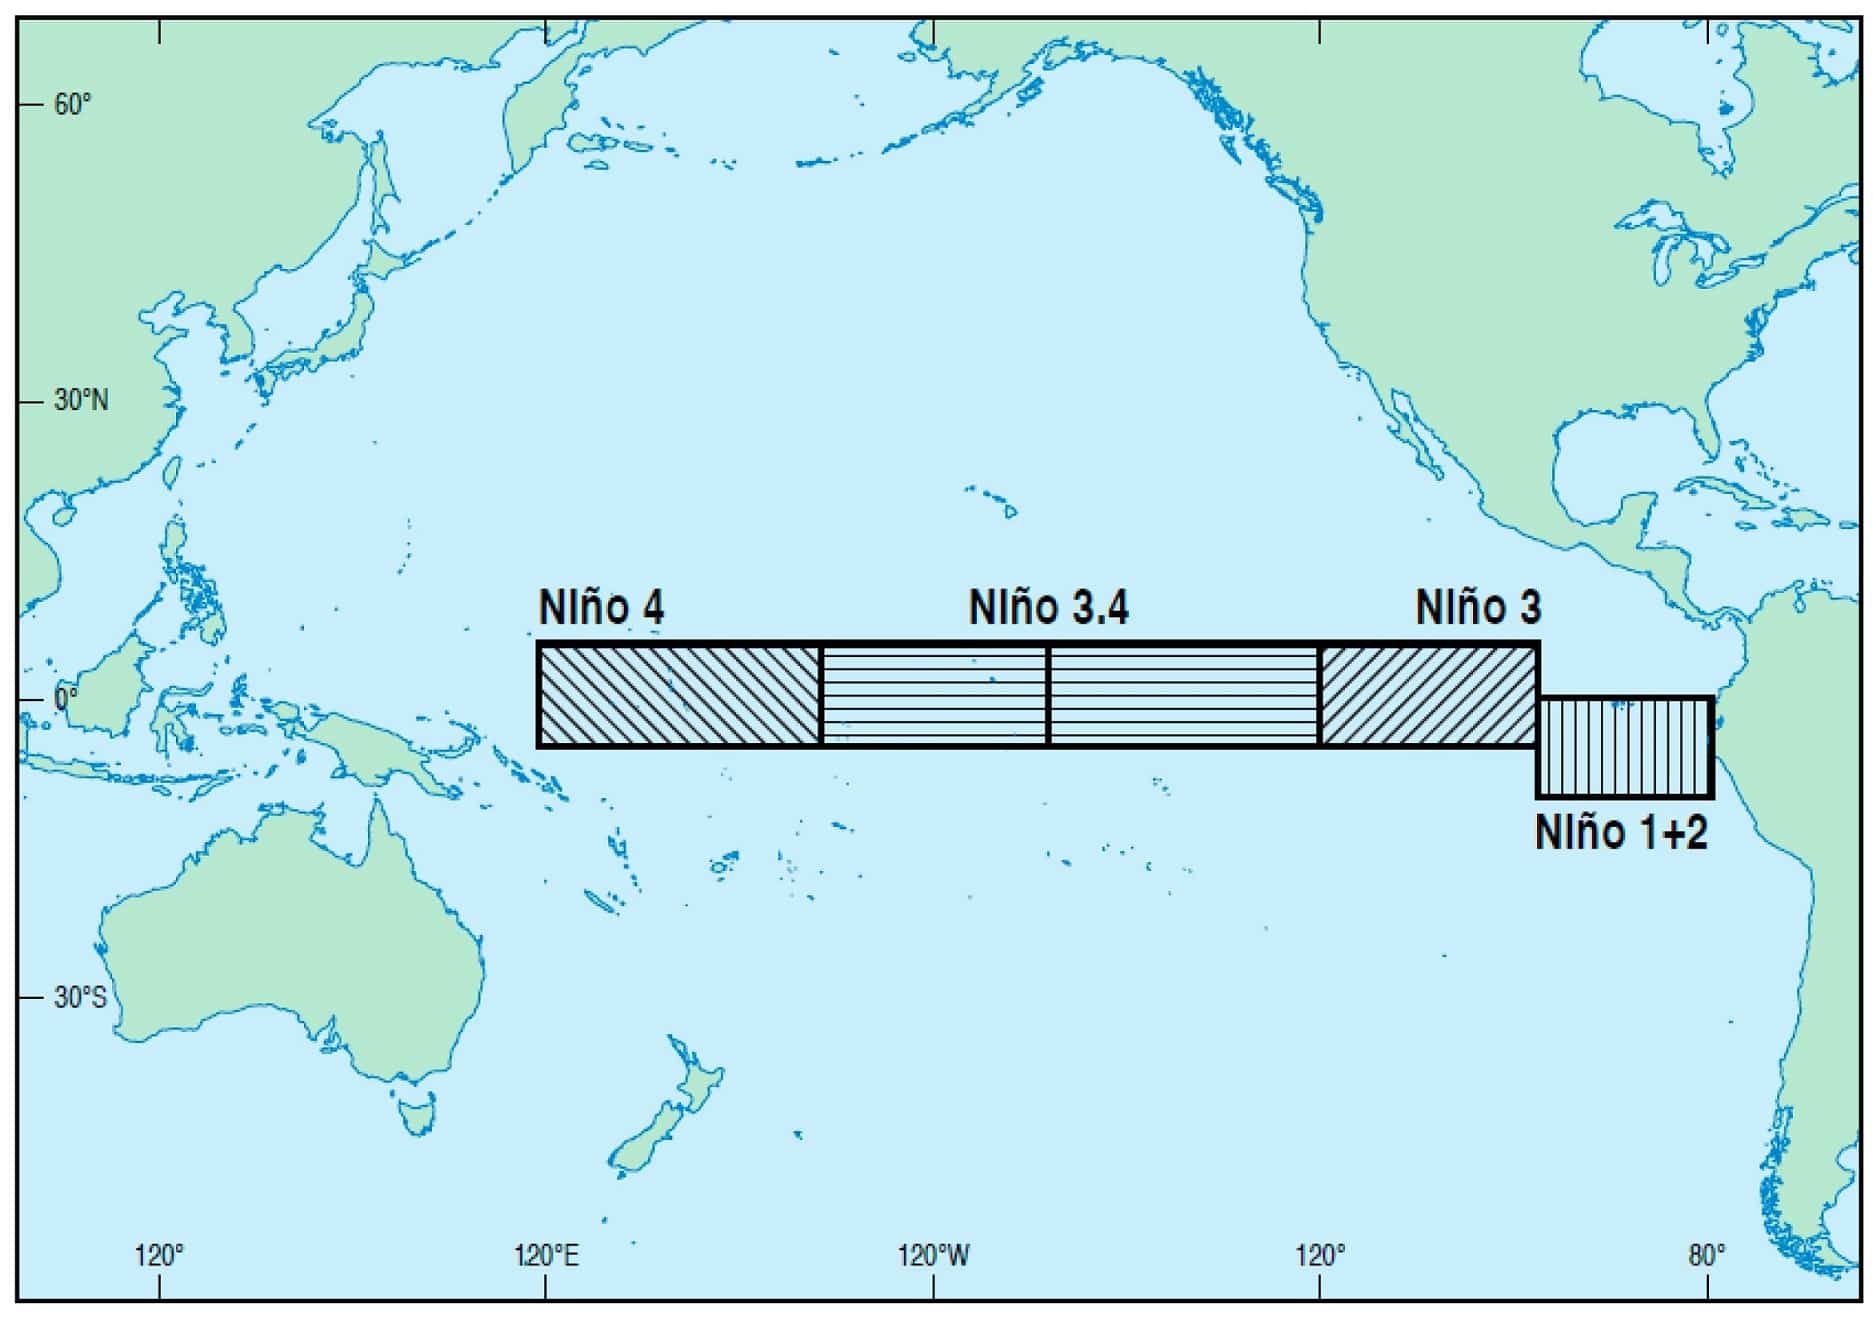
Each ENSO phase has a different influence on the tropical weather and circulation and impacts the seasonal weather worldwide differently. A specific phase (warm/cold) usually develops around late summer and autumn and can last until next summer, or even up to two years in some cases.
The cold phase is called La Niña and the warm phase is called El Niño. Each ENSO phase is determined by the temperature anomalies (warmer/colder) in the ENSO 3.4 region in the tropical Pacific, as seen on the image above.
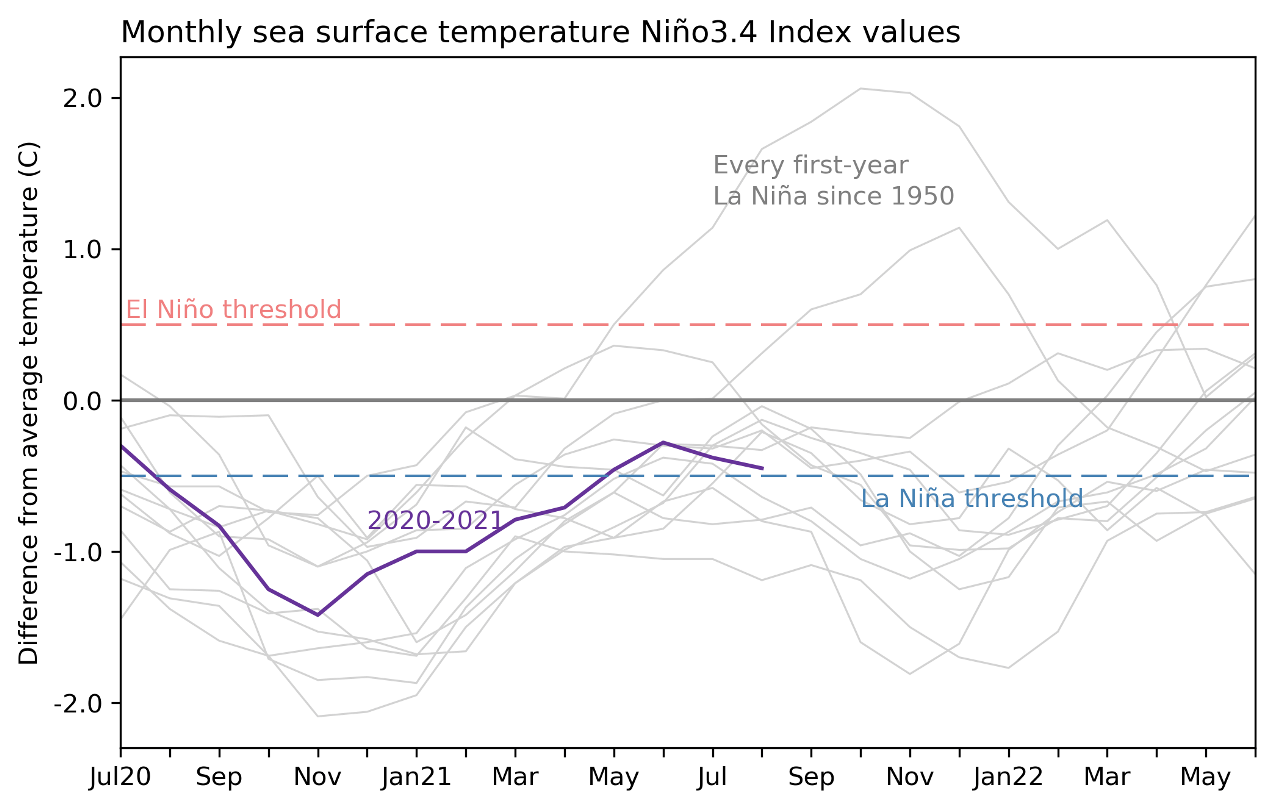
Looking at the 3.4 regions in recent times, you can see on the image below how the ocean temperatures dropped in summer and autumn 2020. That was the development of the La Nina last year. New cooling emerged this summer, which was the start of a new cold phase.
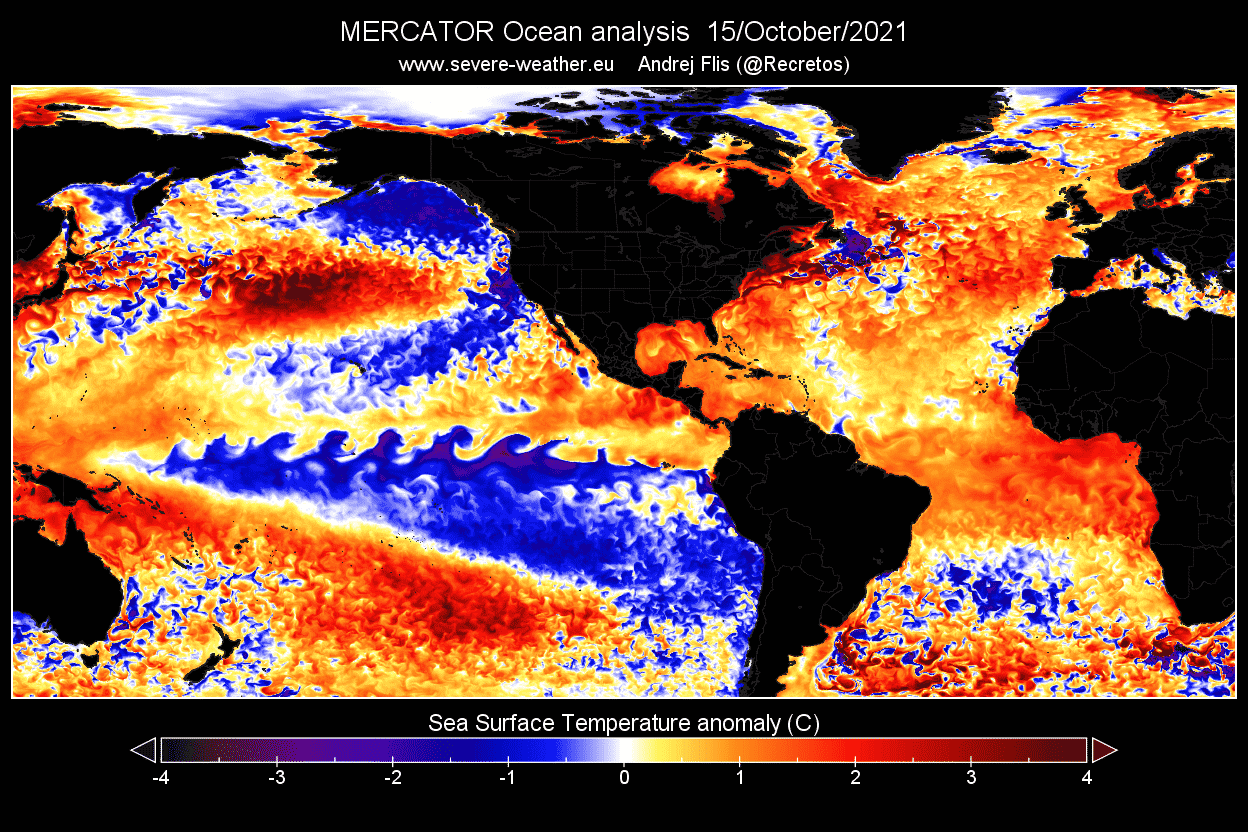
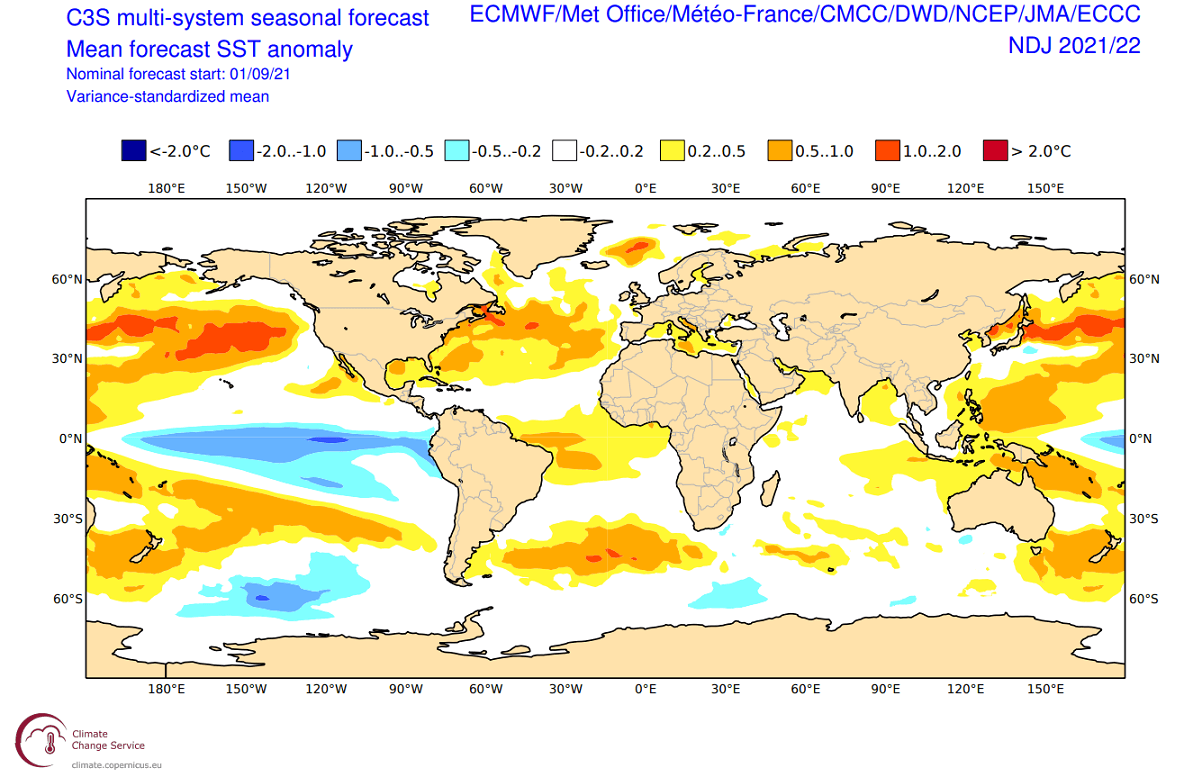
On the image below you can see the global ocean temperature anomaly in mid-October. It shows colder than normal surface waters in the tropical Pacific regions. This strong negative anomaly with beautiful waveforms is the La Nina. We can also see a cold horseshoe developing in the northeast Pacific ocean, also known as the PDO (Pacific Decadal Oscillation).
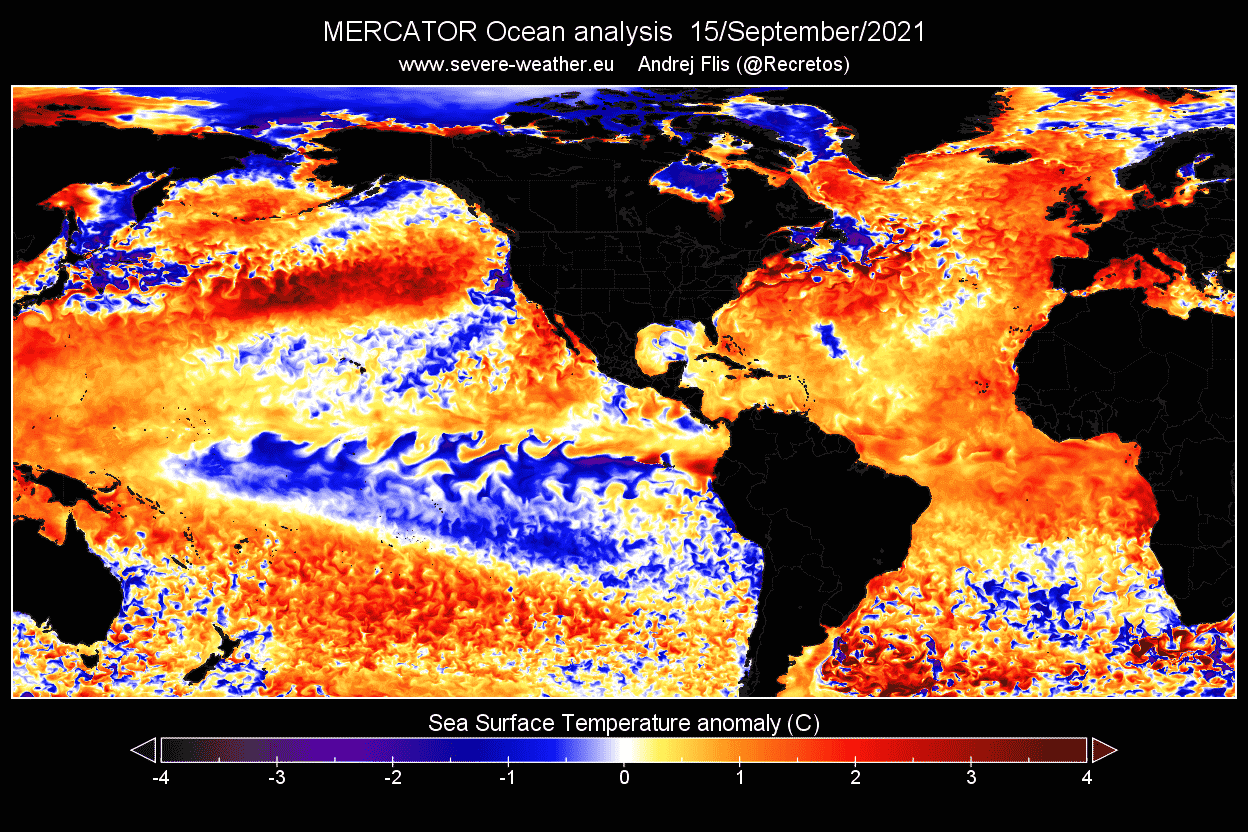
Looking back at September, the cold anomalies were much weaker over the tropical Pacific Ocean. We can also see the lack of cold temperatures in the northeast Pacific ocean. Also, the waveforms across the ENSO regions were not as well-shaped and defined. This shows just how much stronger the cooling process is at the moment.
The best way to depict an emergence of a new cold ocean phase is with a high-resolution animation over time. The video below shows the cold ocean anomalies of the La Nina from last year weakening over Spring. You can see new cooling starting in July. Notice the “waveforms” across the region, as the surface water is being pushed west by the trade winds, bringing cooler water to the surface.
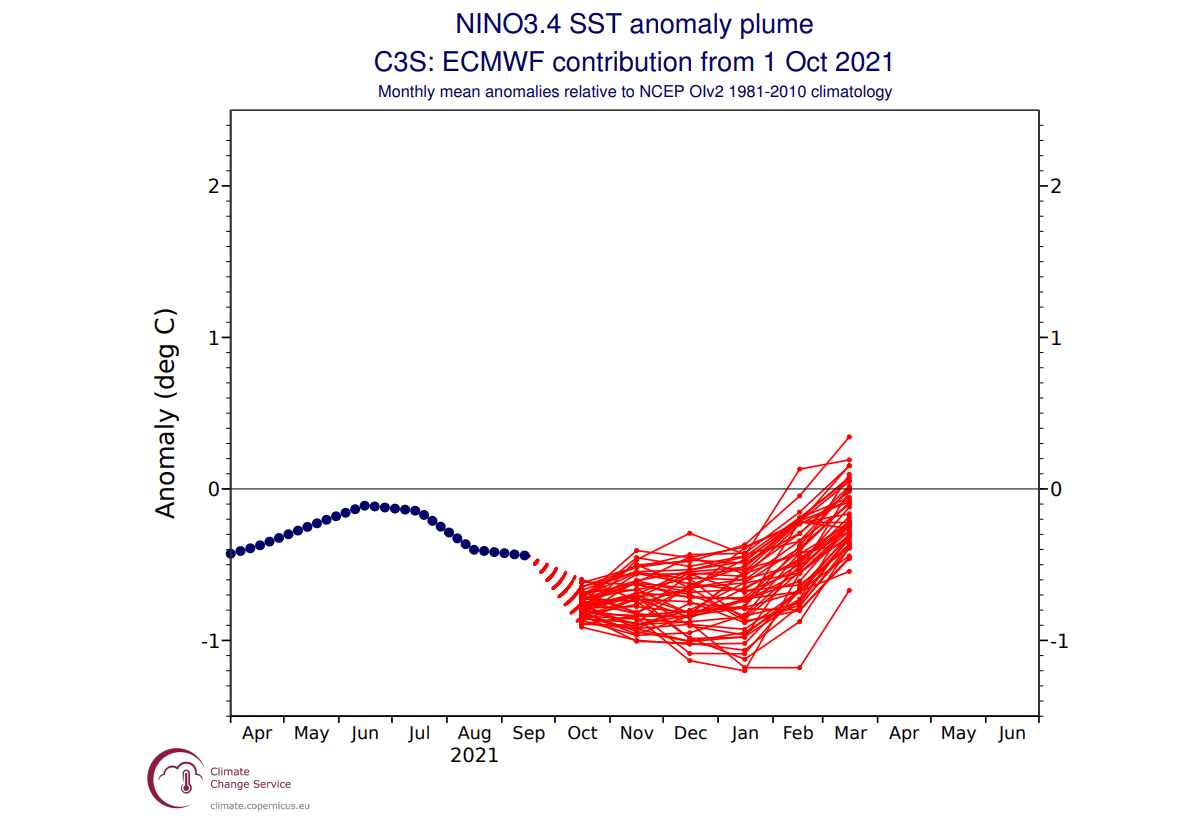
The image below is an analysis and forecast image from ECMWF. It shows the La Nina from last year and the forecast for this winter season. It is clear from the forecast that the new cold phase is expected to peak just before the winter season, with its influence reaching into early spring 2022. This forecast is actually colder than the forecast last month.
Below we have the ocean temperature forecast for late Fall and early Winter from multiple global seasonal models. It shows a developed La Nina across the equatorial Pacific Ocean. It is not as strong as last year, but has a strong presence in the ocean and also in the atmosphere, as we will see in the forecast part of the article below.
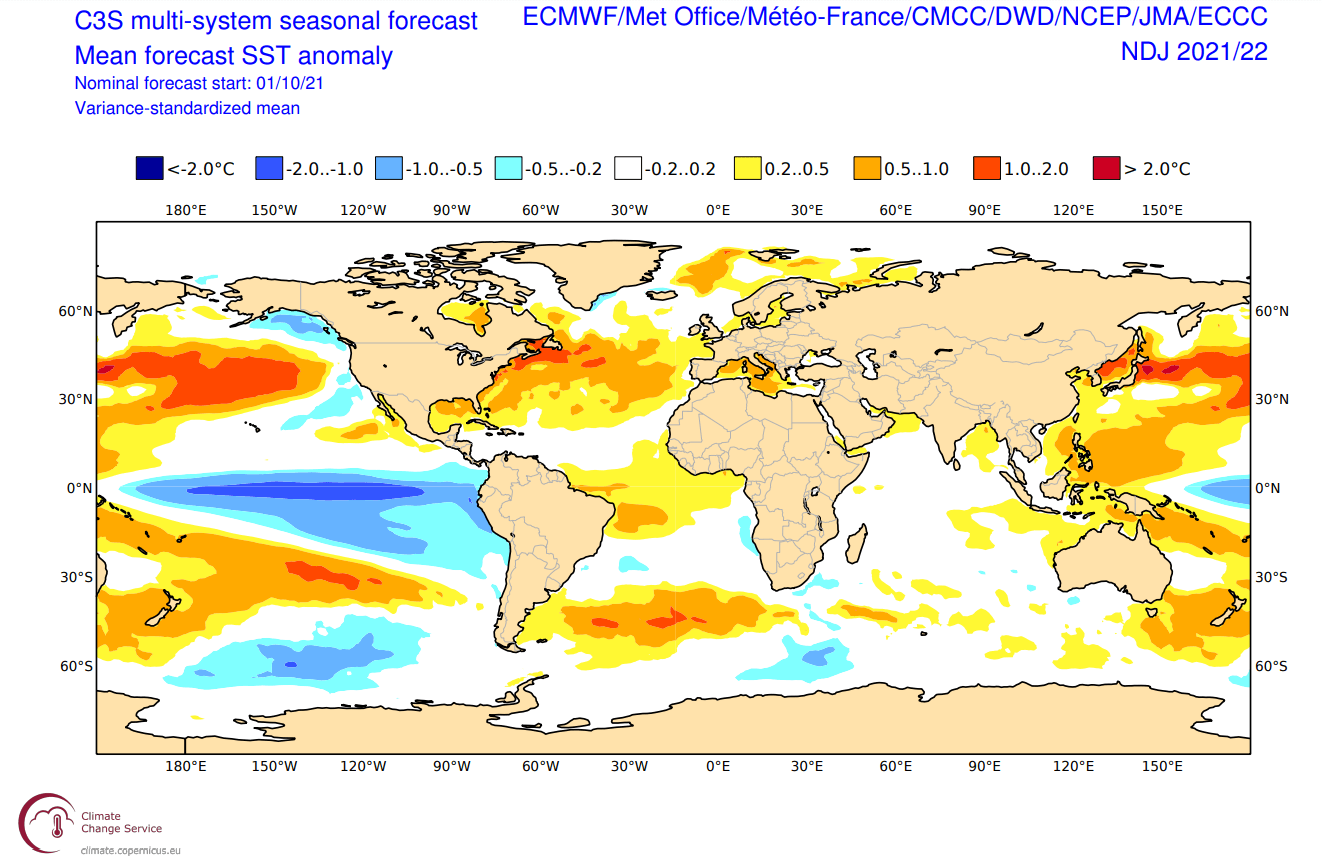
We can compare the latest forecast with the forecast from last month below. You can see the latest forecast above actually shows a stronger La Nina than first thought. This can have a big impact on the atmospheric pressure and temperature forecast, as the ocean anomalies and their strength have a different impact on the seasonal weather.
THE WINTER JET STREAM
Usually, we can first see the influence of these ocean anomalies on the jet stream. The jet stream is a large and powerful stream of air (wind) at around 8-11km (5-7mi) altitude. It flows in a west-to-east motion around the entire Northern Hemisphere, affecting pressure systems, and their strength, shaping our weather.
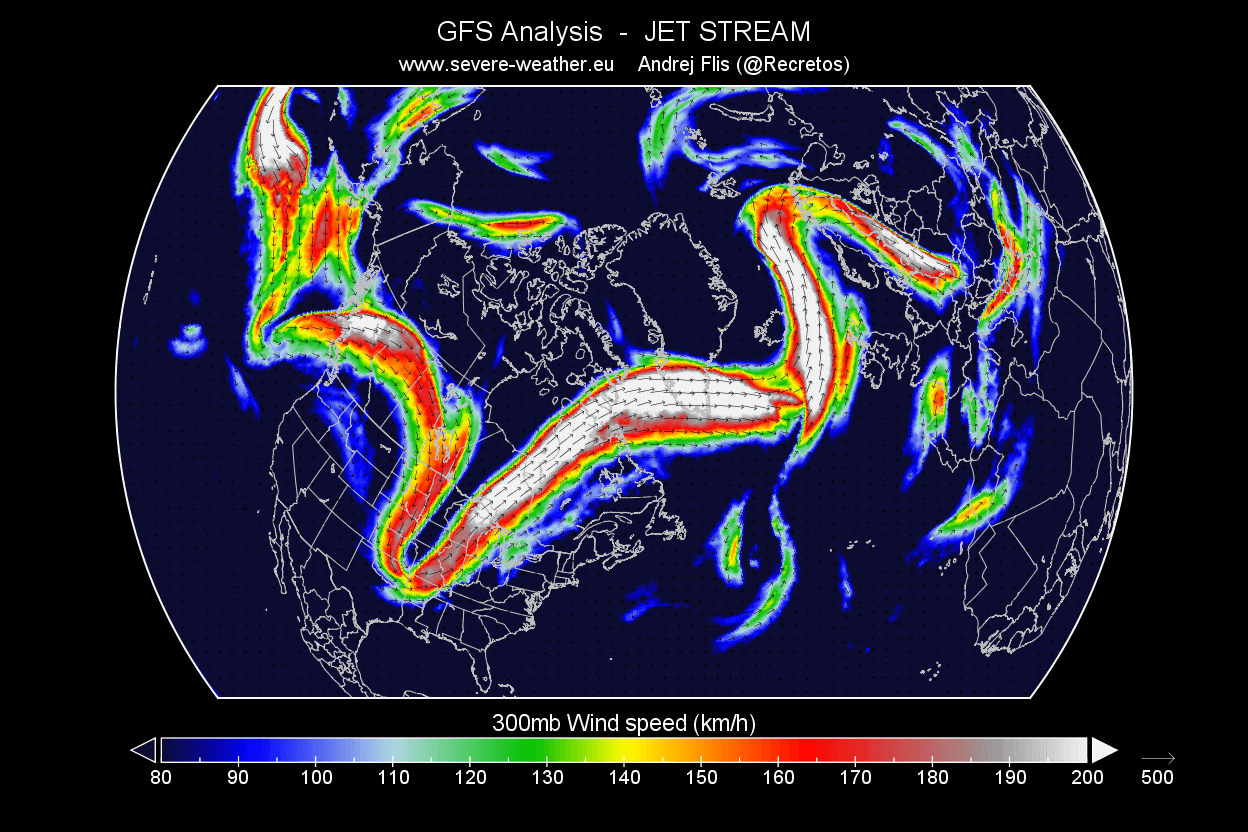
Below is an example of the jet stream at 300mb (9km/5.6mi altitude). In this example, the jet stream is quite curved down over the central United States, which brings colder air down from the north. It is curved upwards over northern Europe. Such formation brings warmer weather to Scandinavia and stormy conditions to Iceland and the British Isles.
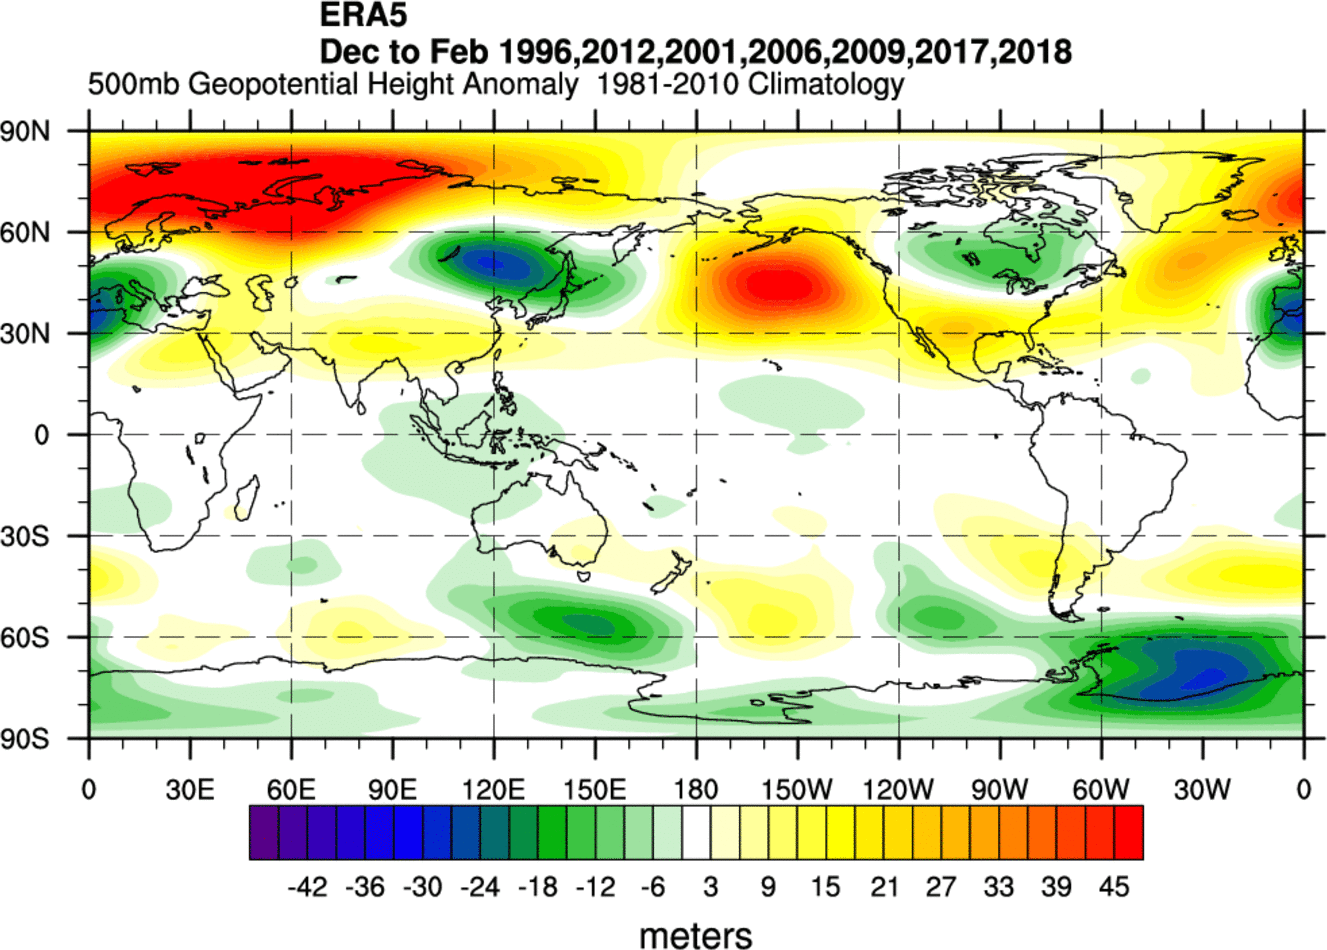
Historically, the most typical effect of a cold ENSO phase is a strong blocking high-pressure system in the North Pacific. The image below shows the average pattern during the last few cold ENSO winters. We can see the strong high-pressure system in the North Pacific and a low-pressure area over Canada and southwestern Europe. Especially Europe is quite tricky to say for sure what the influence is, as the Atlantic also plays a role here.
The circulation of the strong high-pressure system promotes the development of a low-pressure region over Alaska and western Canada. It curves the jet stream downwards in-between the two pressure systems.
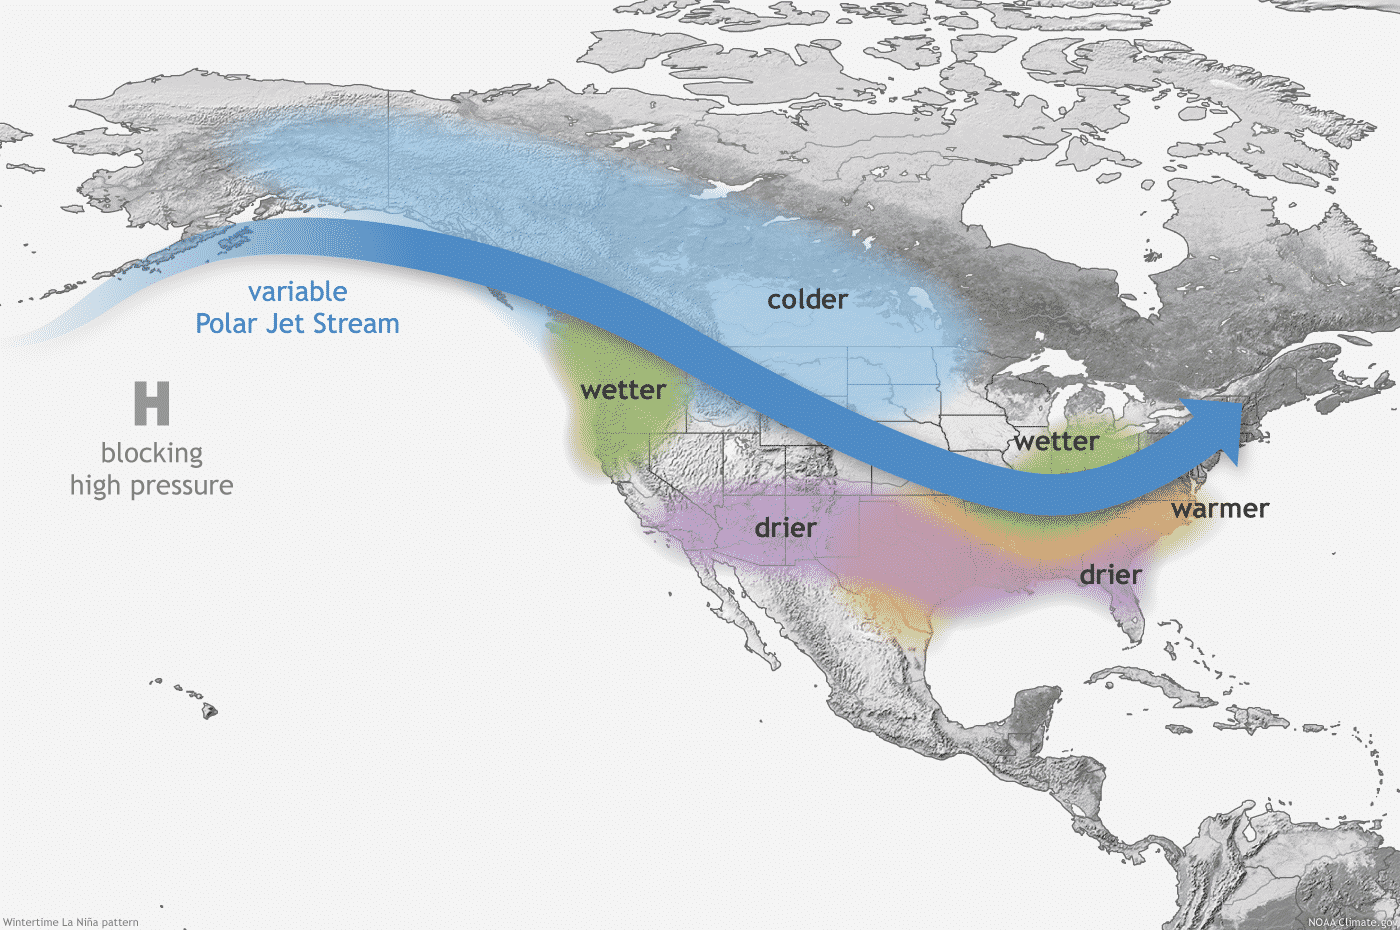
You can see that jet stream bending in the image below. The image shows the average position of the jet stream during La Nina winters and the corresponding weather patterns over North America. The curved jet stream brings colder air and storms down from the north into northern and the northwestern United States, and warmer and drier weather to the southern parts.
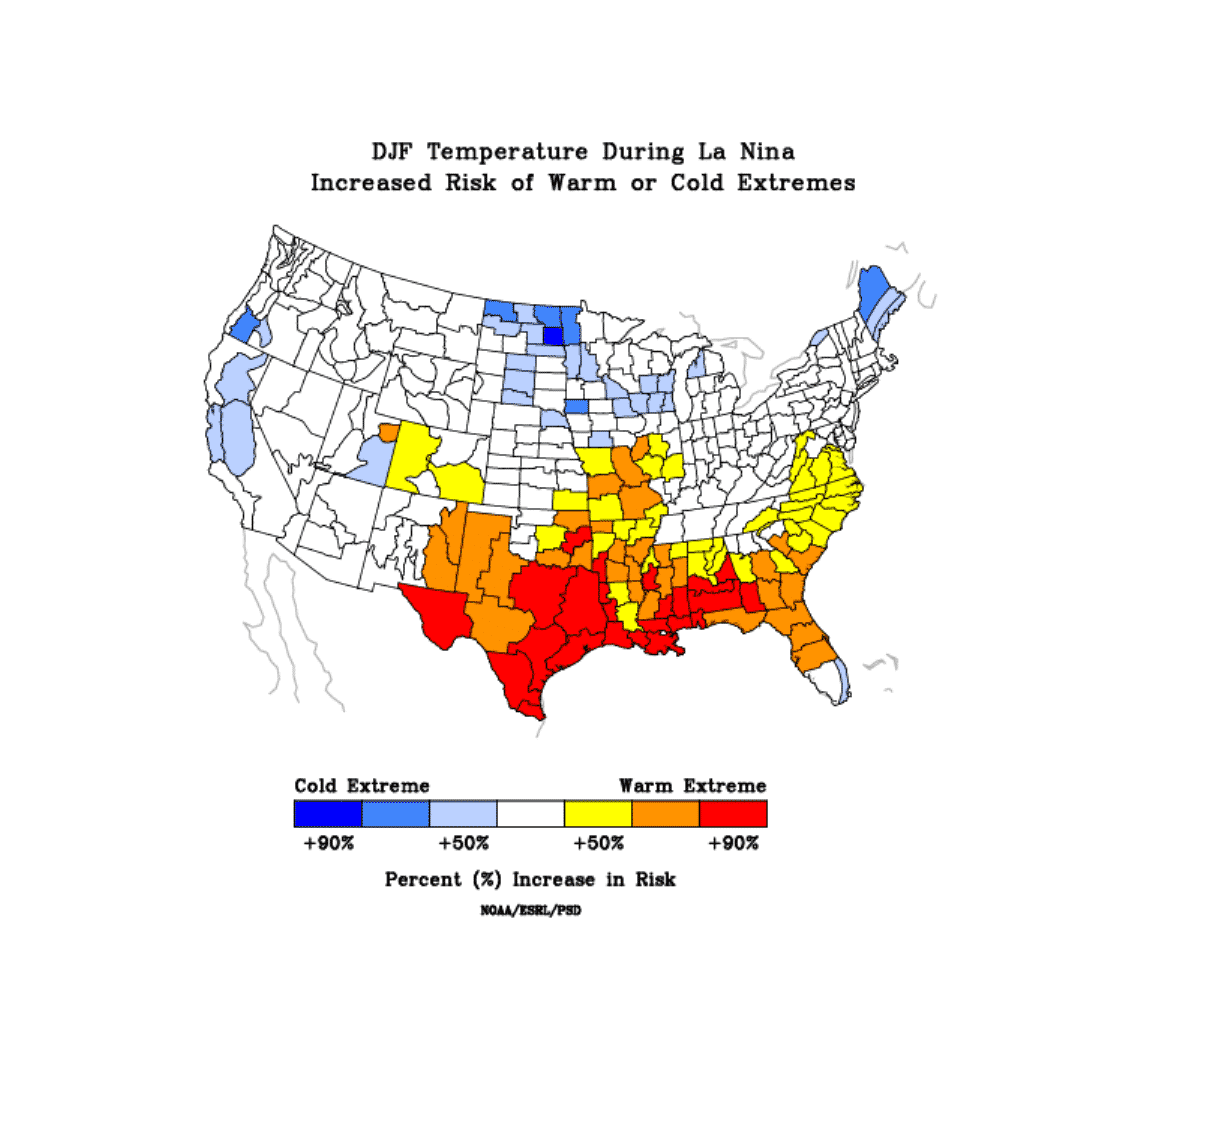
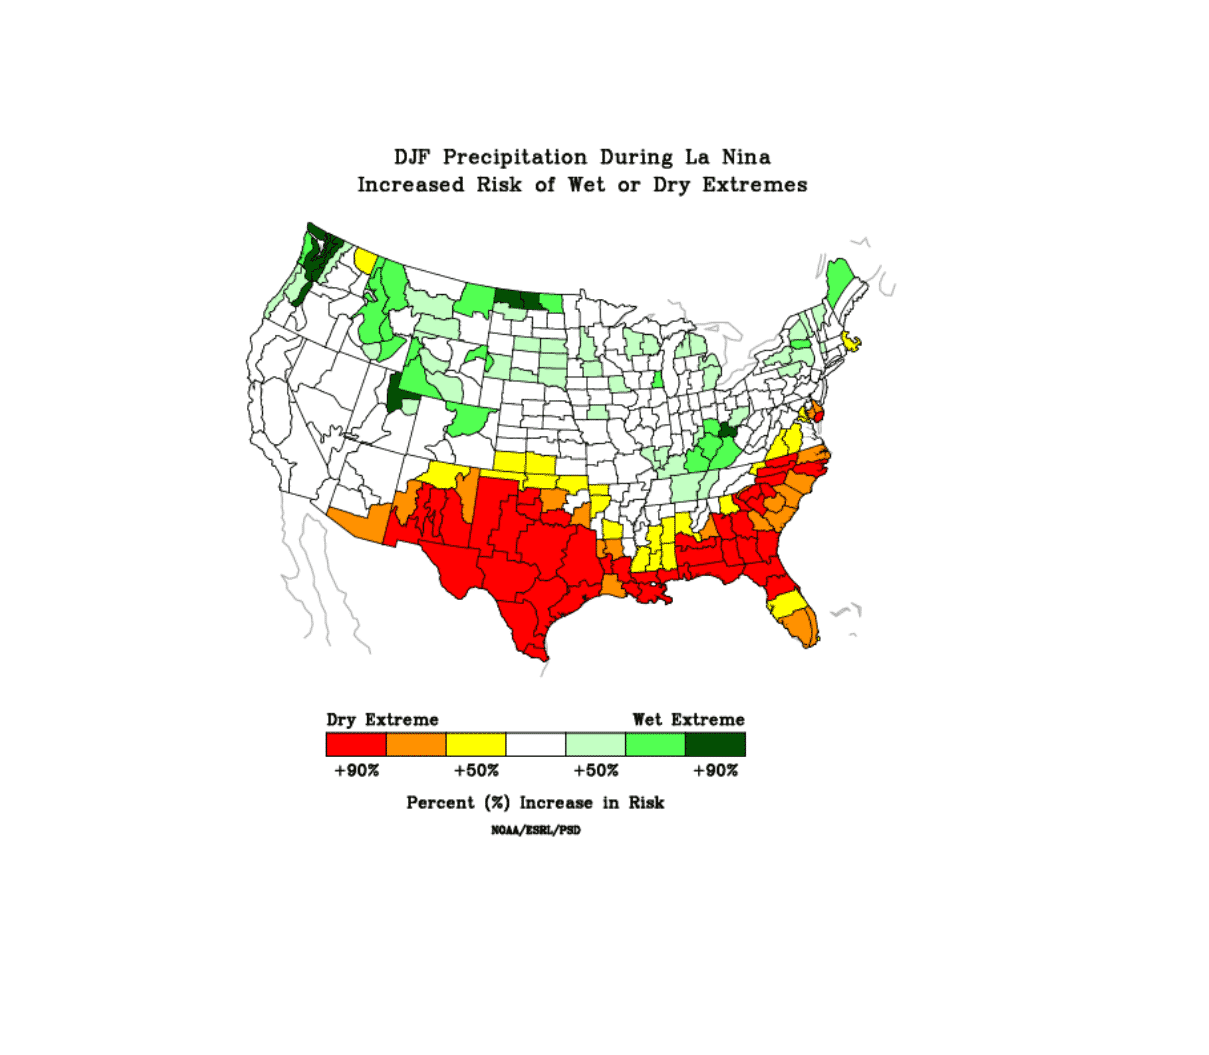
This way, the changing jet stream over the United States can actually divide the country into 2 weather poles. The images below show the average temperature and precipitation analysis during the many past La Nina winters over the United States.
In the northern part of the country, we see that the colder and wetter events are more frequent, as the jet stream directions the storm systems that way. But that can somewhat lockout the southern United States, creating warmer and quite drier conditions with less frequent storms and cold fronts.
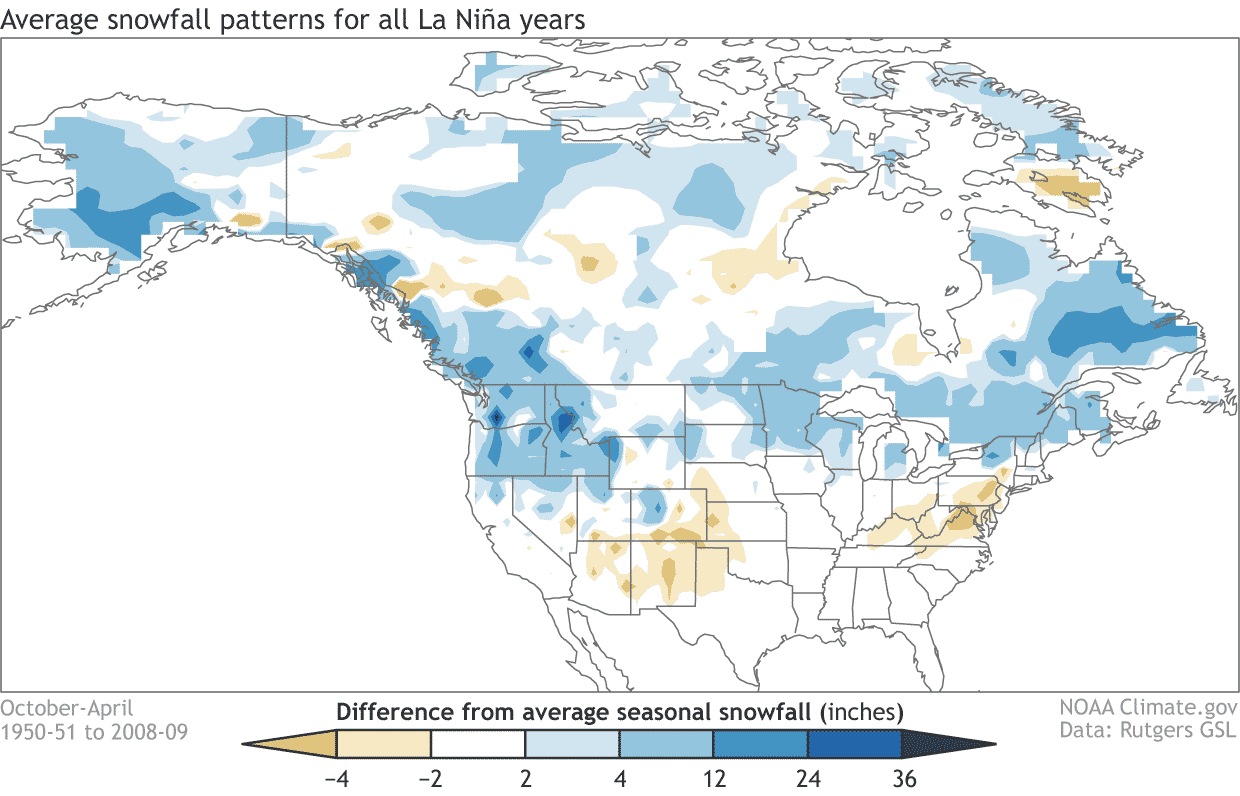
Changing the jet stream position also means changing the snowfall potential. The colder air is more easily accessible to the northern United States, which also shows to have an increased snowfall potential. Especially areas like Alaska, Canada, and the northwest and the northern United States benefit from the jet stream to produce more snowfall. The graphic is by NOAA-Climate.
After passing Canada and the United States, the jet stream moves out into the Atlantic. There are different paths it can take. A lot depends on the overall circulation pattern and the existing pressure systems in the Atlantic. This is where La Nina perhaps loses its direct influence for Europe, as regional systems in the Atlantic take over.
But it usually still has an important influence, as it changes the position of the entering jet stream from the west. The incoming jet stream can merge with the systems in the Atlantic, helping to create a whole new weather pattern for Europe. The problem is that the final outcome is far more unpredictable in this zone than over North America, which feels a more direct influence.
WINTER SEASON 2021/2022 MODEL FORECAST
We now know what La Nina is, and how it typically changes the jet stream and our seasonal weather. Now we will take a look at the global long-range models, and how they see the developing Winter 2021/2022.
We decided to focus on the 3 main (or most used) seasonal models. The ECMWF and UKMO from Europe, and the CFSv2 from the United States. Graphics are from the Copernicus Climate EU project and the CPC/NCEP.
All these forecasts are an average picture over the course of 3 meteorological winter months (December-January-February) and show the general prevailing seasonal weather patterns. Even if the models would be completely accurate, it does not mean that such weather conditions would last for 3 months straight. It only suggests how the weather patterns might look 40-60% of the time.
ECMWF WINTER FORECAST
The ECMWF model is most often referred to as the most reliable model, also in the long-range category. In reality, a lot depends on the individual situation and individual seasons. But generally, the ECMWF model is at the top of the chart as far as reliability goes. But no long-range/seasonal forecast can ever be deemed “reliable“. We are only looking at trends and how the weather patterns might evolve over the entire continents on a large time scale.
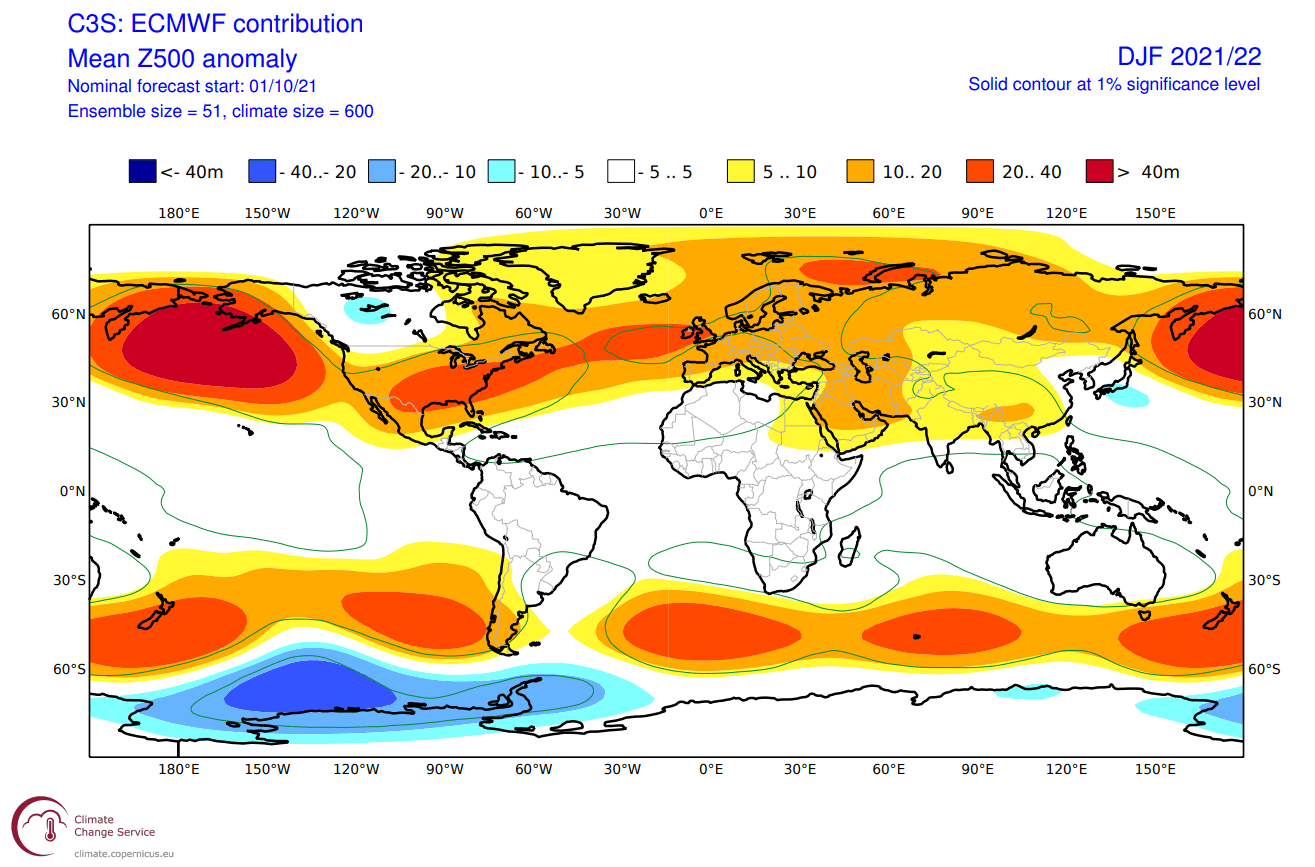
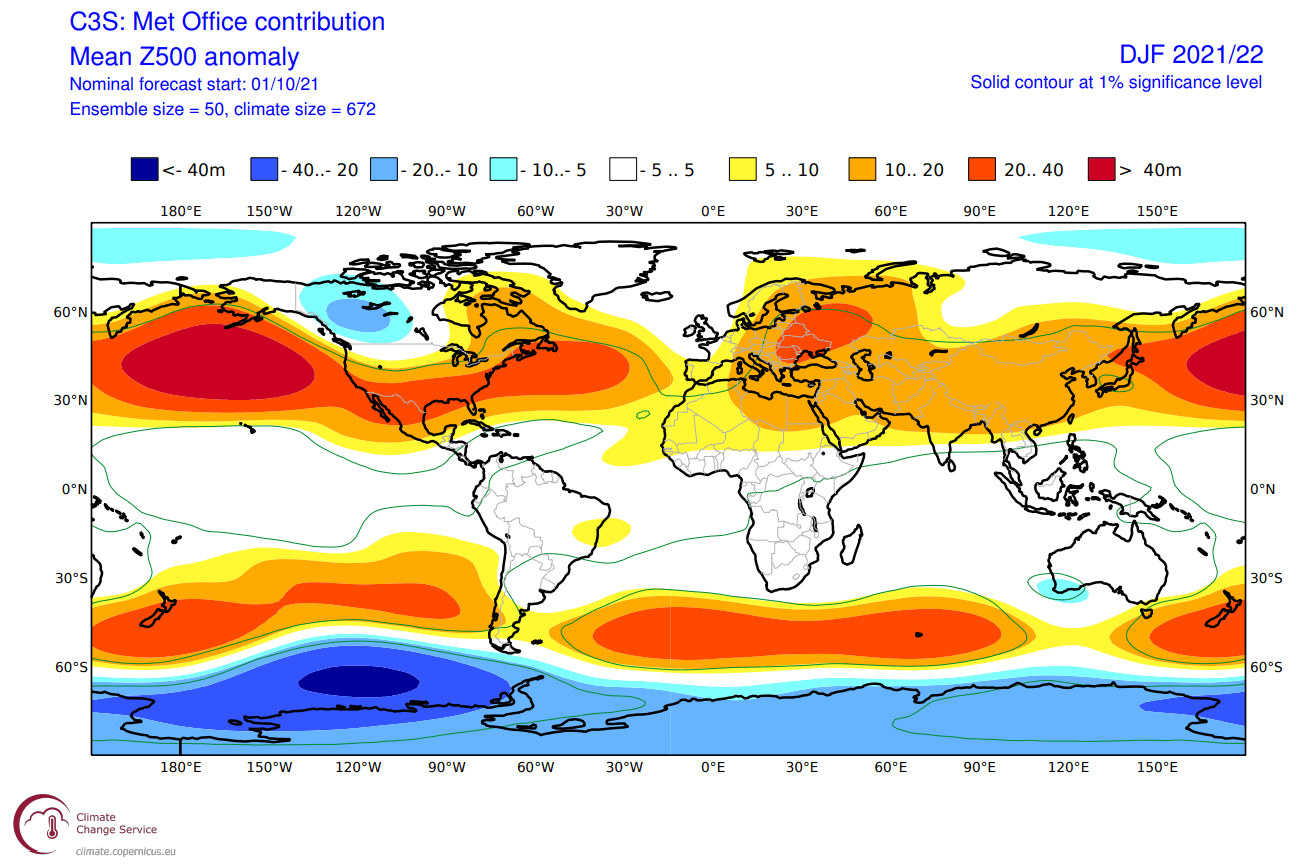
In the pressure pattern forecast from ECMWF below, we can see the strong high-pressure system in the North Pacific, typical for a La Nina. A low-pressure system is developed over western Canada and the jet stream is bending in between the two pressure systems, just like we have seen in the previous segment.
We also see the North Atlantic in a somewhat positive/neutral NAO mode, which means an amplified jet stream over the British Isles and northern Europe. But this is not a typical positive NAO setup and shows a lot of variability over the winter season. It allows for winter situations over Europe. Most likely if the high-pressure system in the central Atlantic can crawl further up north, blocking the jet stream and creating a more northerly flow into Europe.
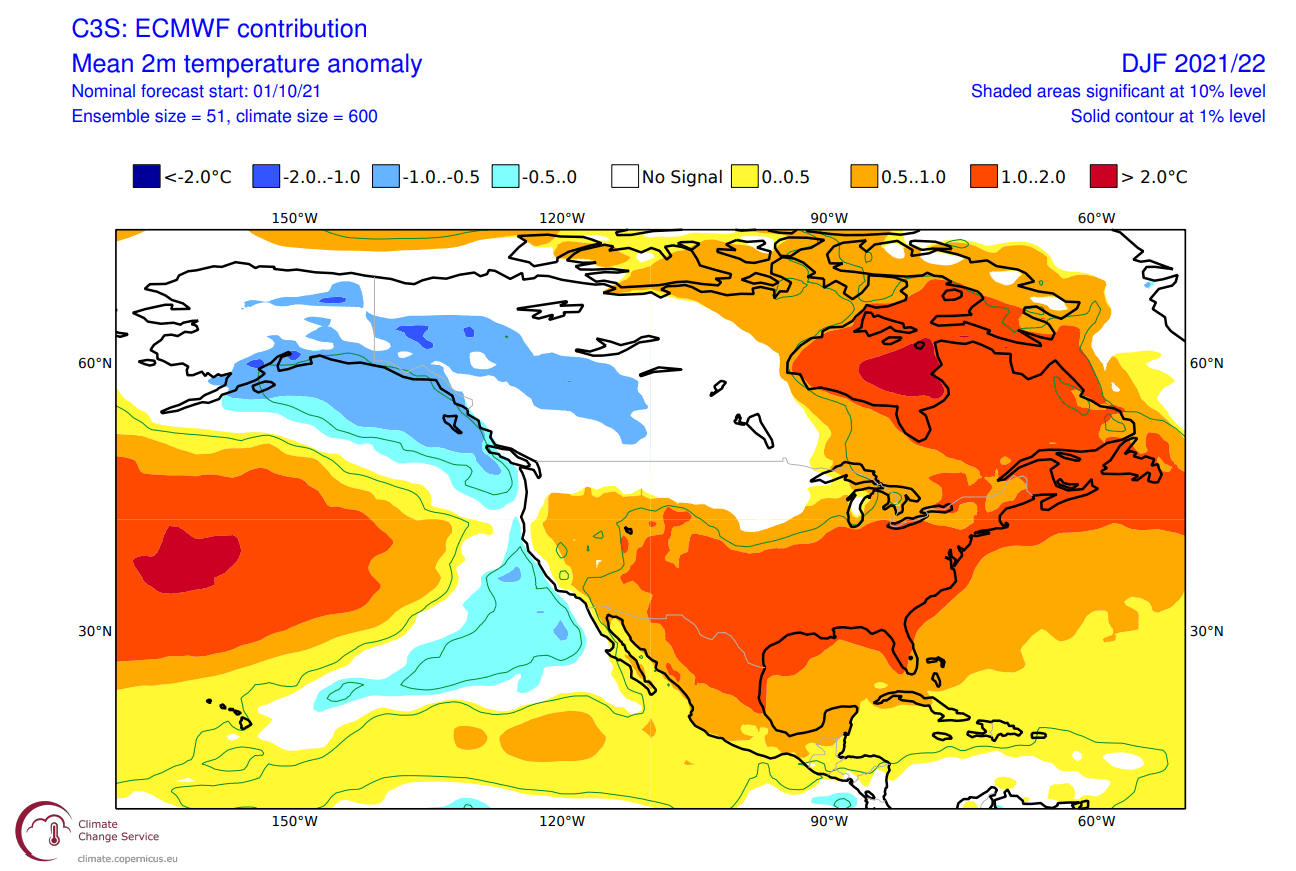
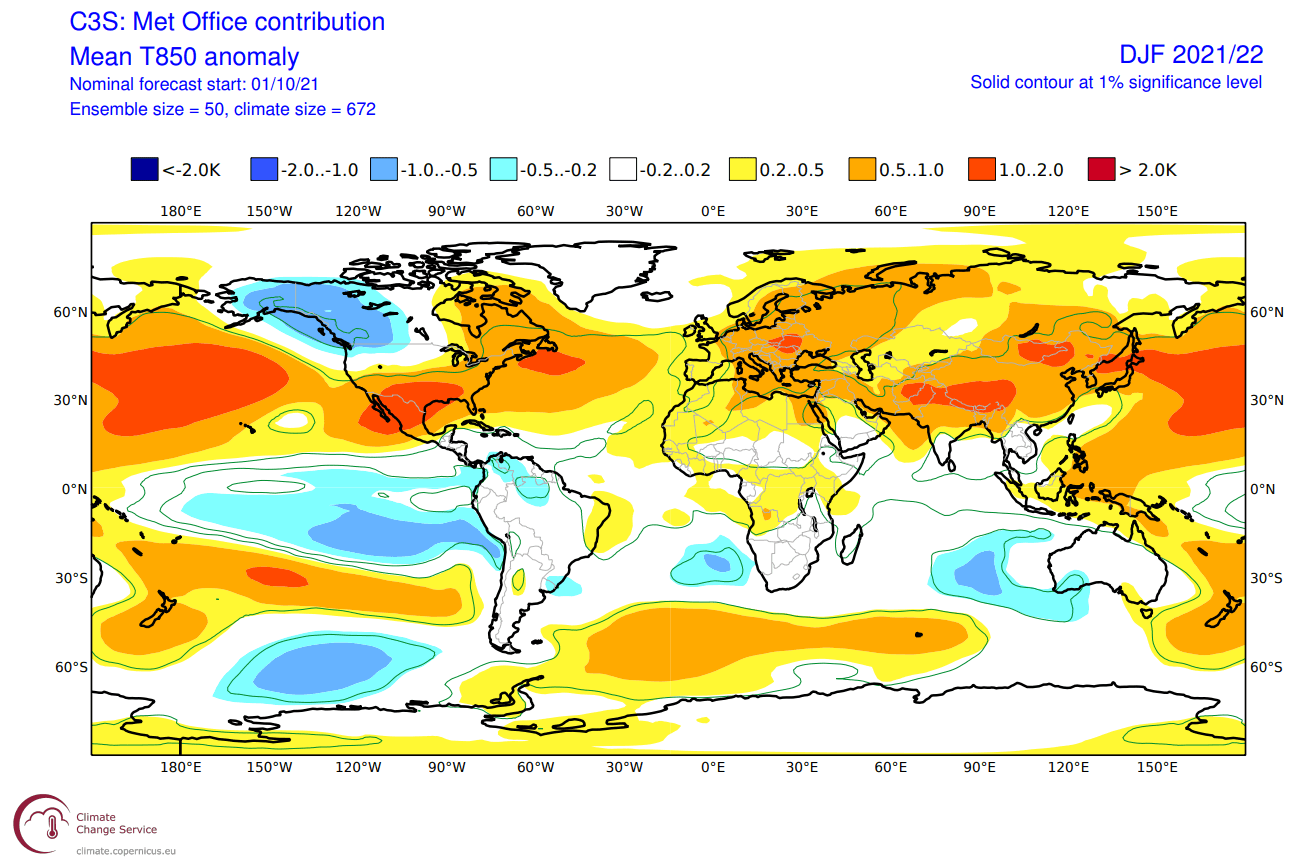
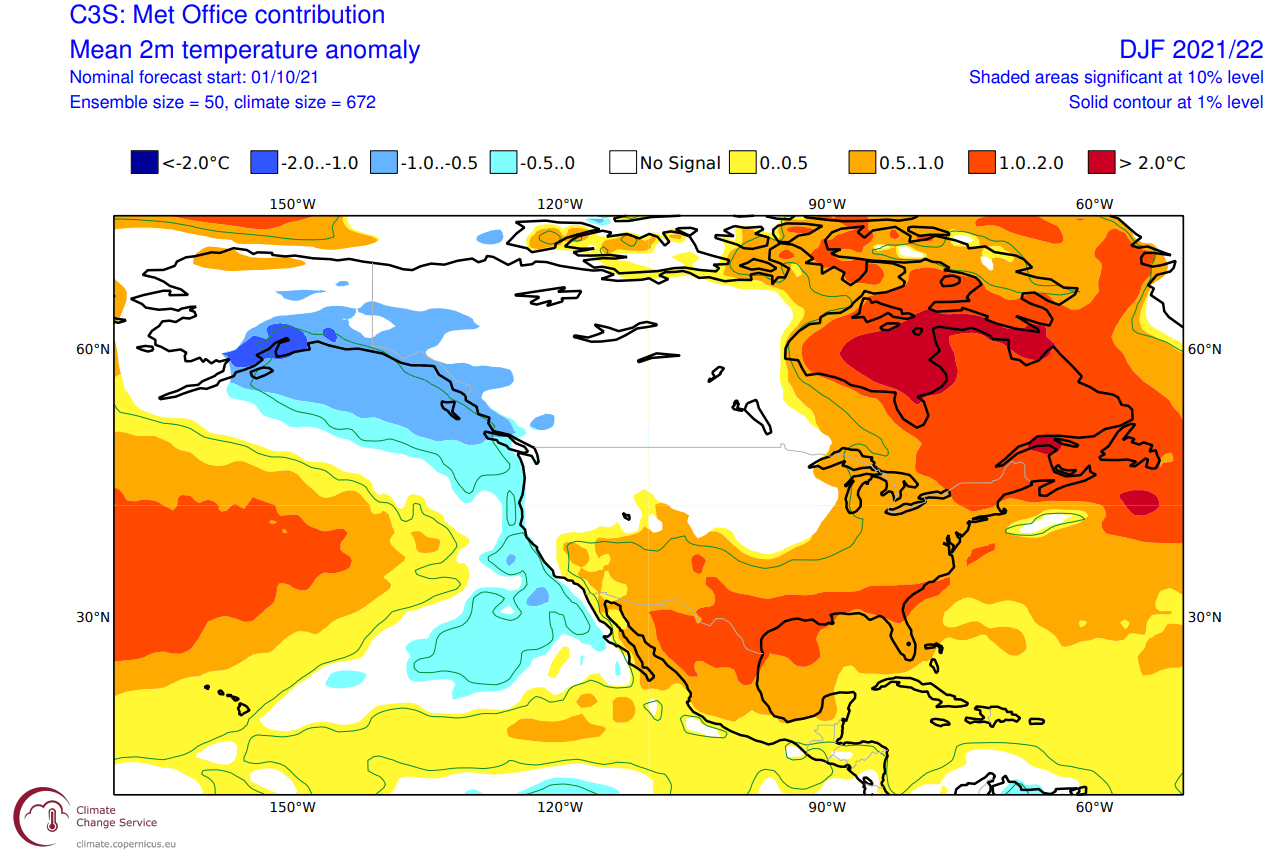
The airmass temperature forecast below shows North America divided into two parts. Western and central Canada is forecast to be colder than normal, with a high chance of the colder air extending towards the parts of the northern United States and over the Midwest. The Southern United States is forecast to be warmer than normal.
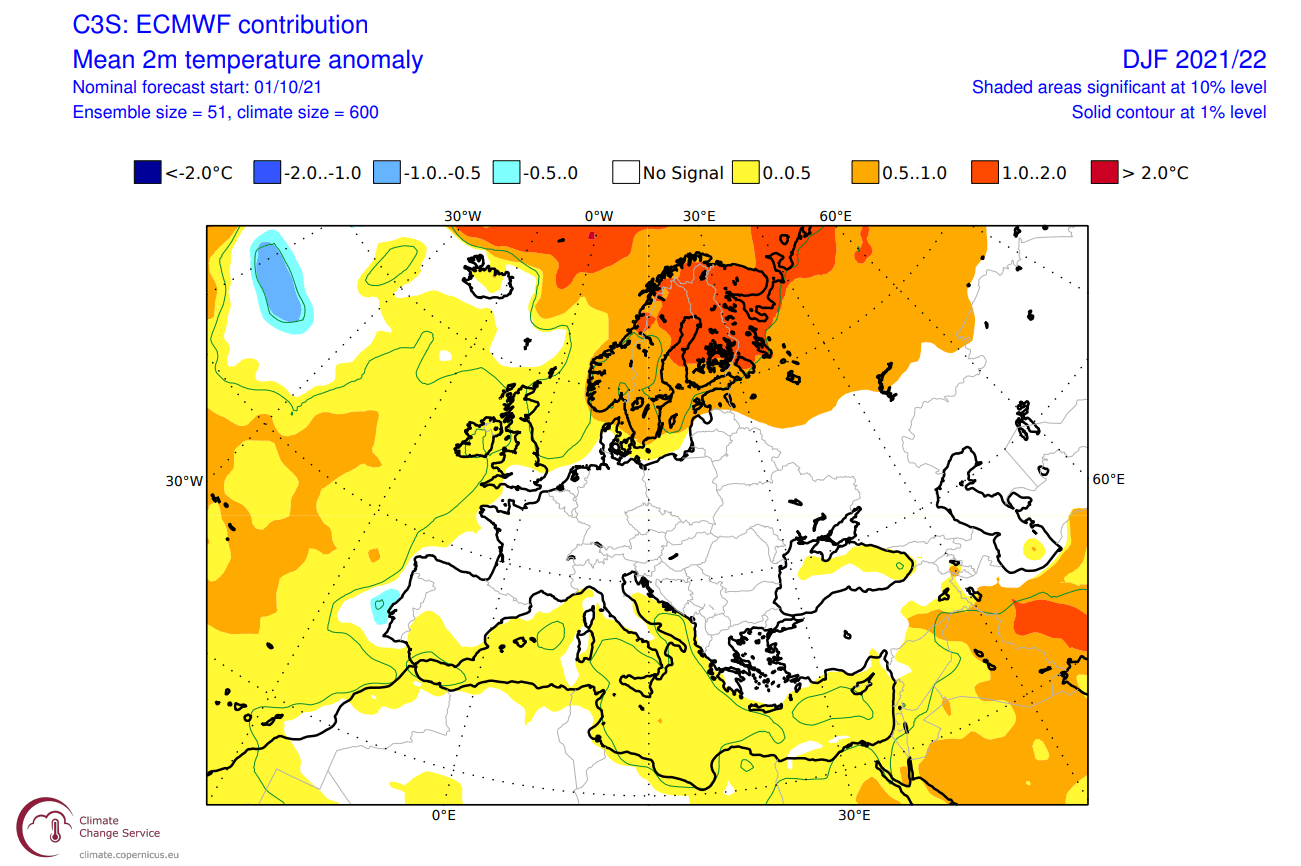
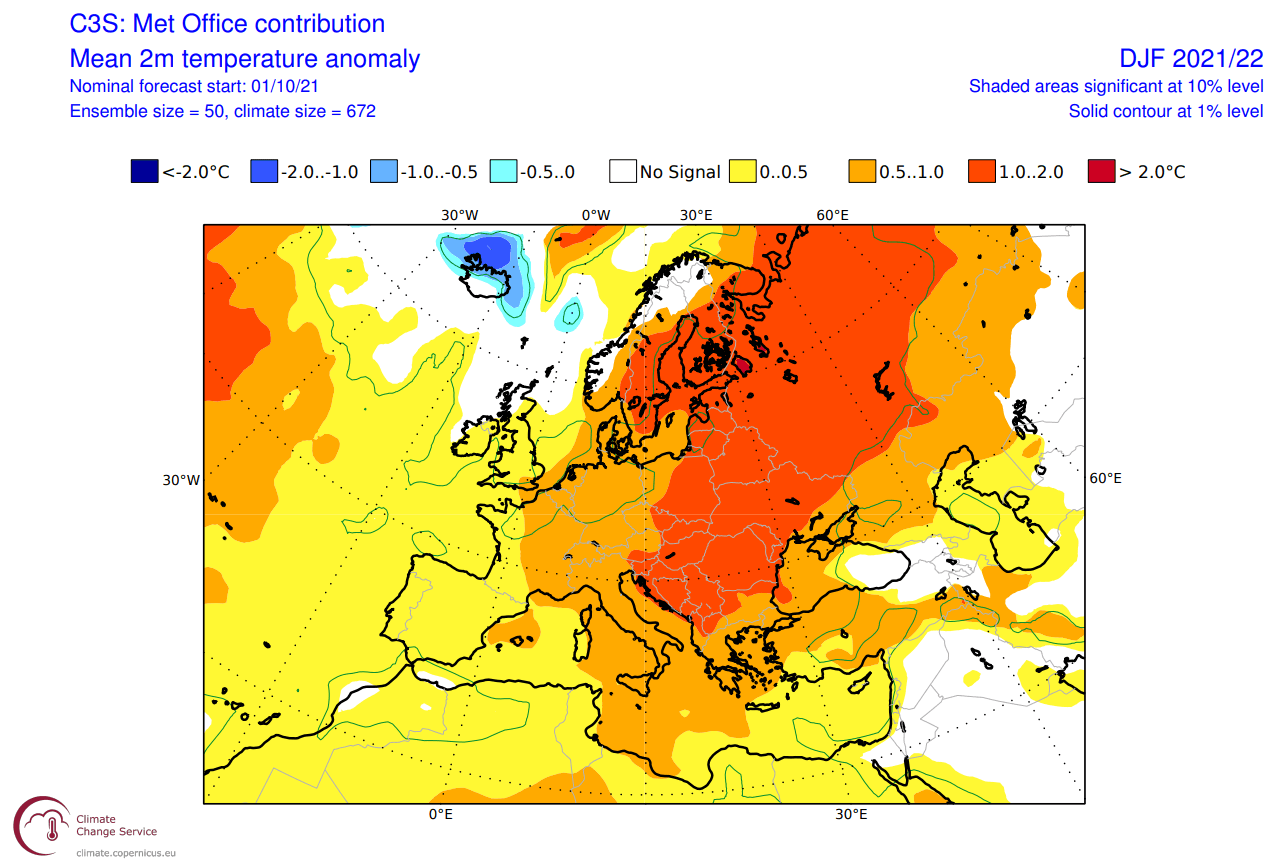
Europe also features higher than normal temperatures, but with more over the northern parts. Tho a more westerly flow dominant scenario is suggested, the pressure pattern does allow for a break in the flow. Occasional cold flow from the northwest is possible down into the mainland.
Looking closer at Europe, we see the surface temperatures are mostly above normal for northern Europe. But we see a large neutral zone from the eastern half into the central regions and towards the west. Central and western regions are likely to see occasional cold fronts from the north/northwest, hence producing the normal/average zone.
Over Noth America, the ECMWF forecast shows neutral/normal temperatures over much of Alaska, Canada, and the northwestern United States. Warmer than normal temperatures are forecast for the southern regions. This is not the final forecast, as it is just the October update. So the neutral temperatures will likely shift to colder, as the forecast consolidates. It is expected to see more neutral/colder temperatures covering a larger area of the northern United States.
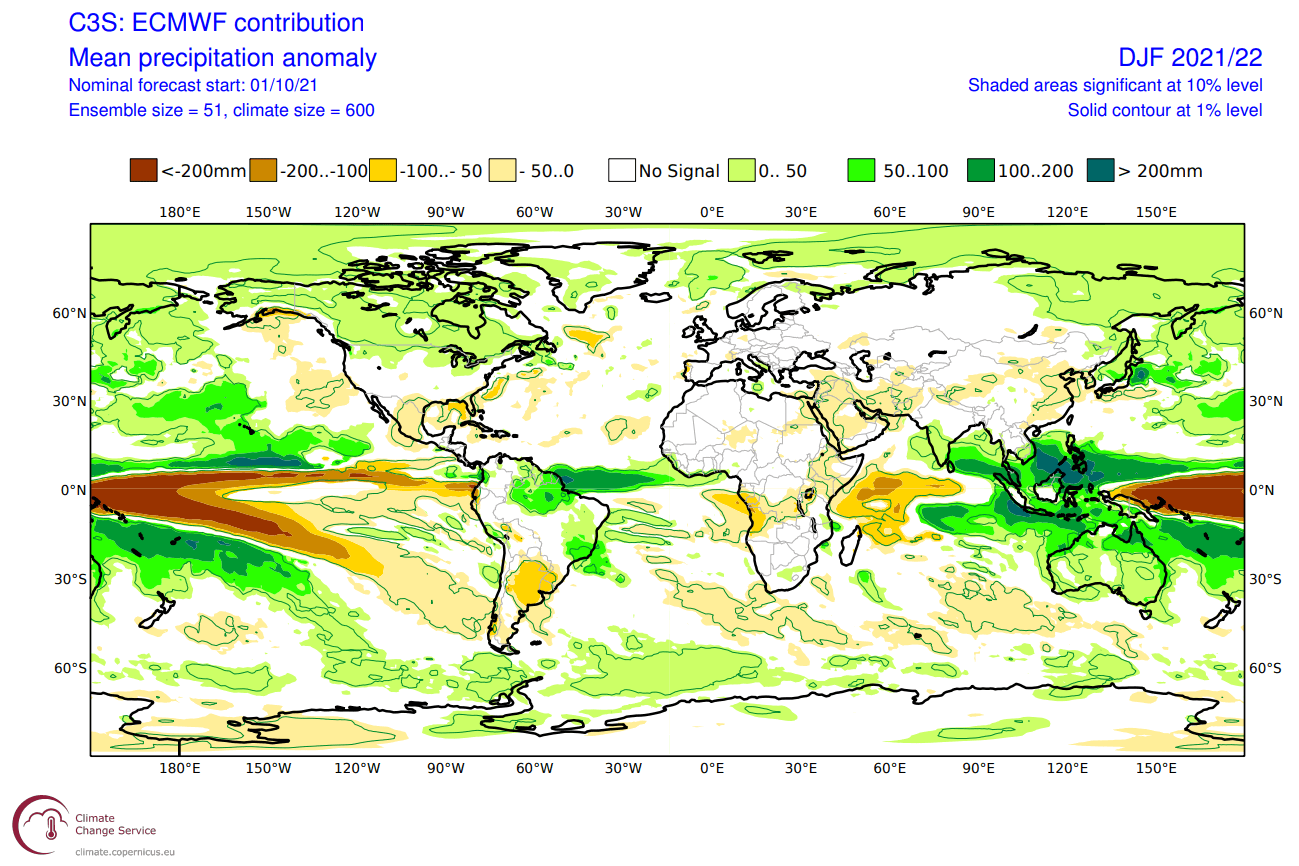
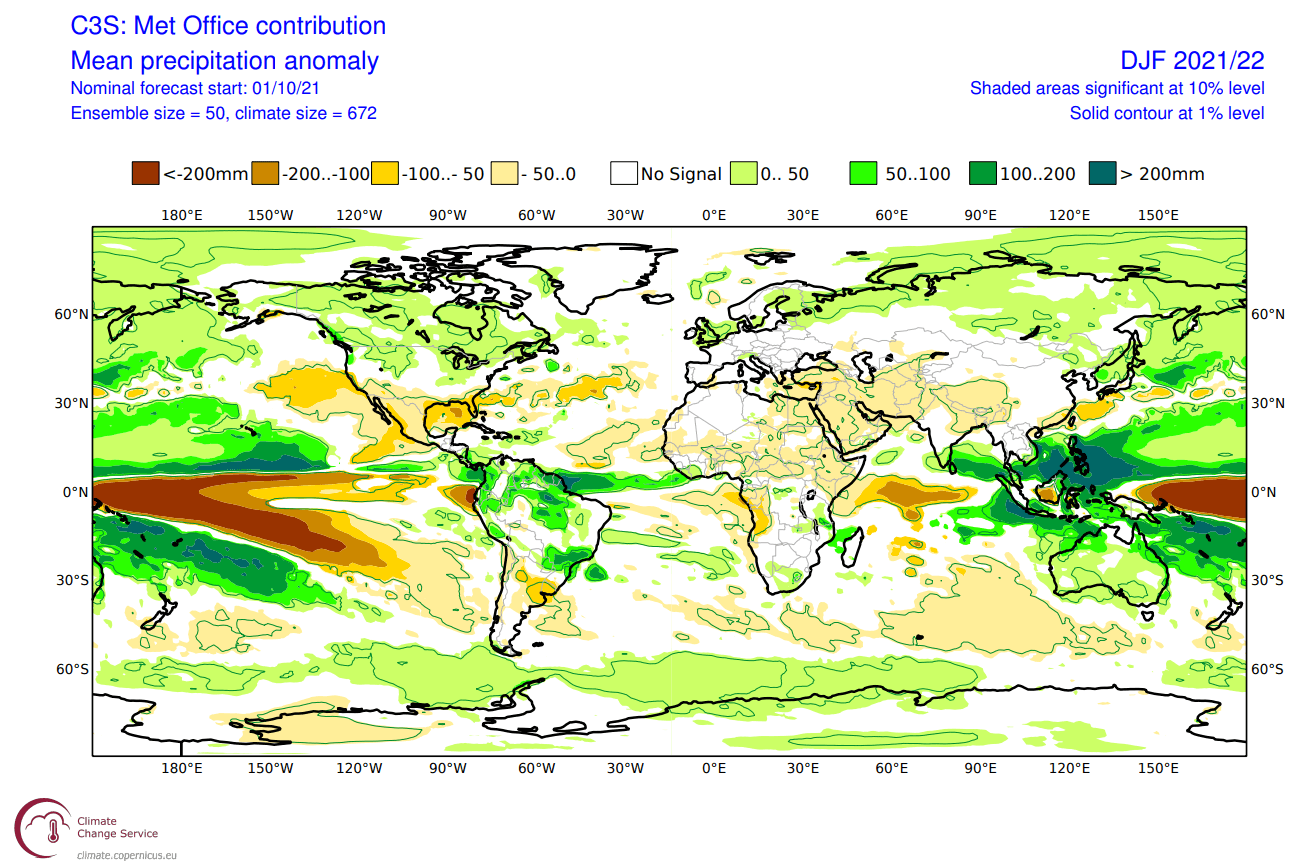
Precipitation anomaly forecast shows a more classic La Nina type pattern over Canada and the United States. We see the mainland United States having wetter conditions in the northern parts under the jet stream. Drier conditions prevail in the south-central regions.
Europe is shown to have more precipitation over the northern regions, where most of the storms would follow. We still see wetter conditions in the Mediterranean. That would mean occasional breaks in the westerly flow and a low-pressure system over southern regions as a result.
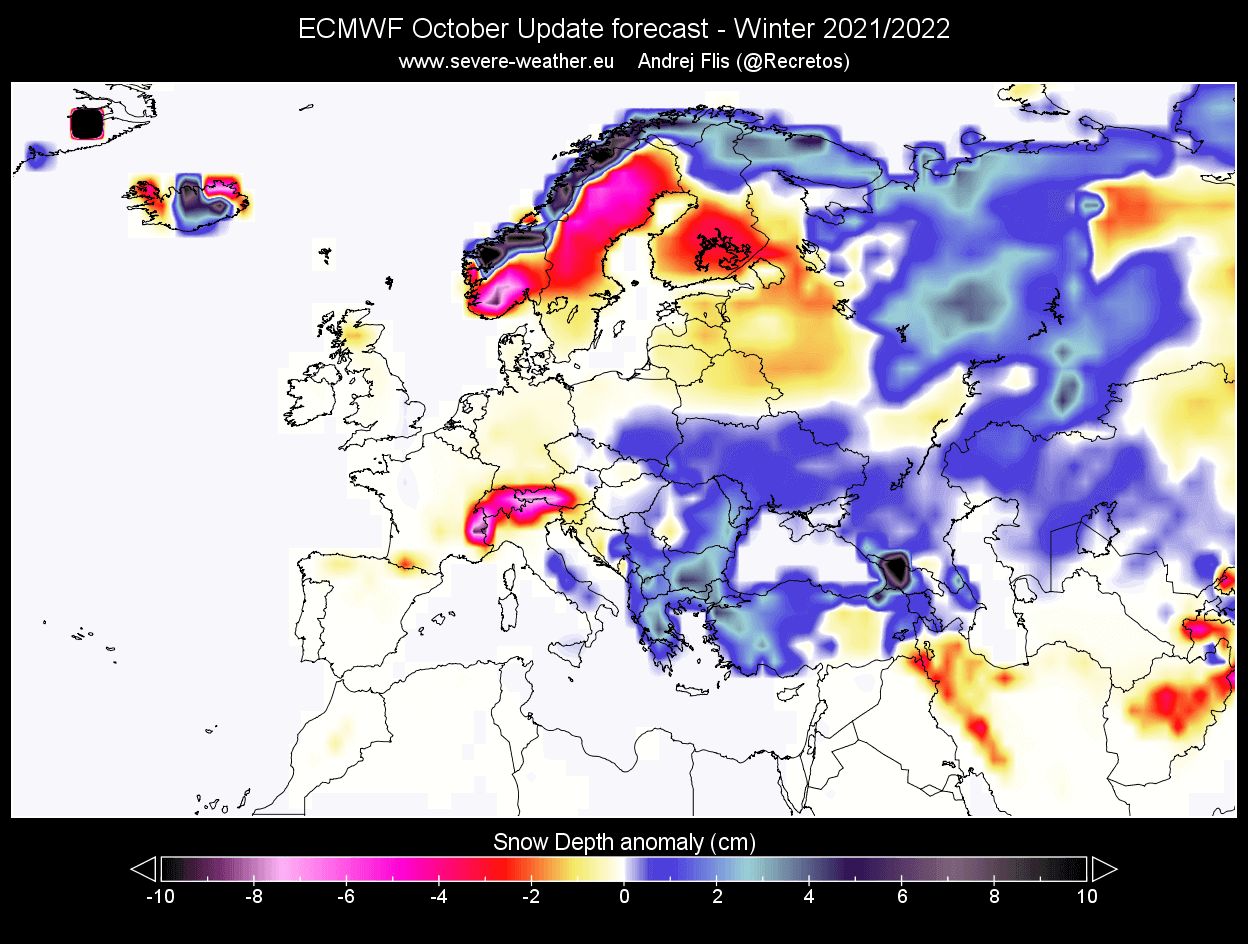
We produced a special snowfall forecast from the ECMWF data, provided by the Copernicus-EU project. Over Europe, we see mostly less than normal snowfall. But we see more snowfall being forecast for parts of central Europe and especially southeastern regions and northern Scandinavia.
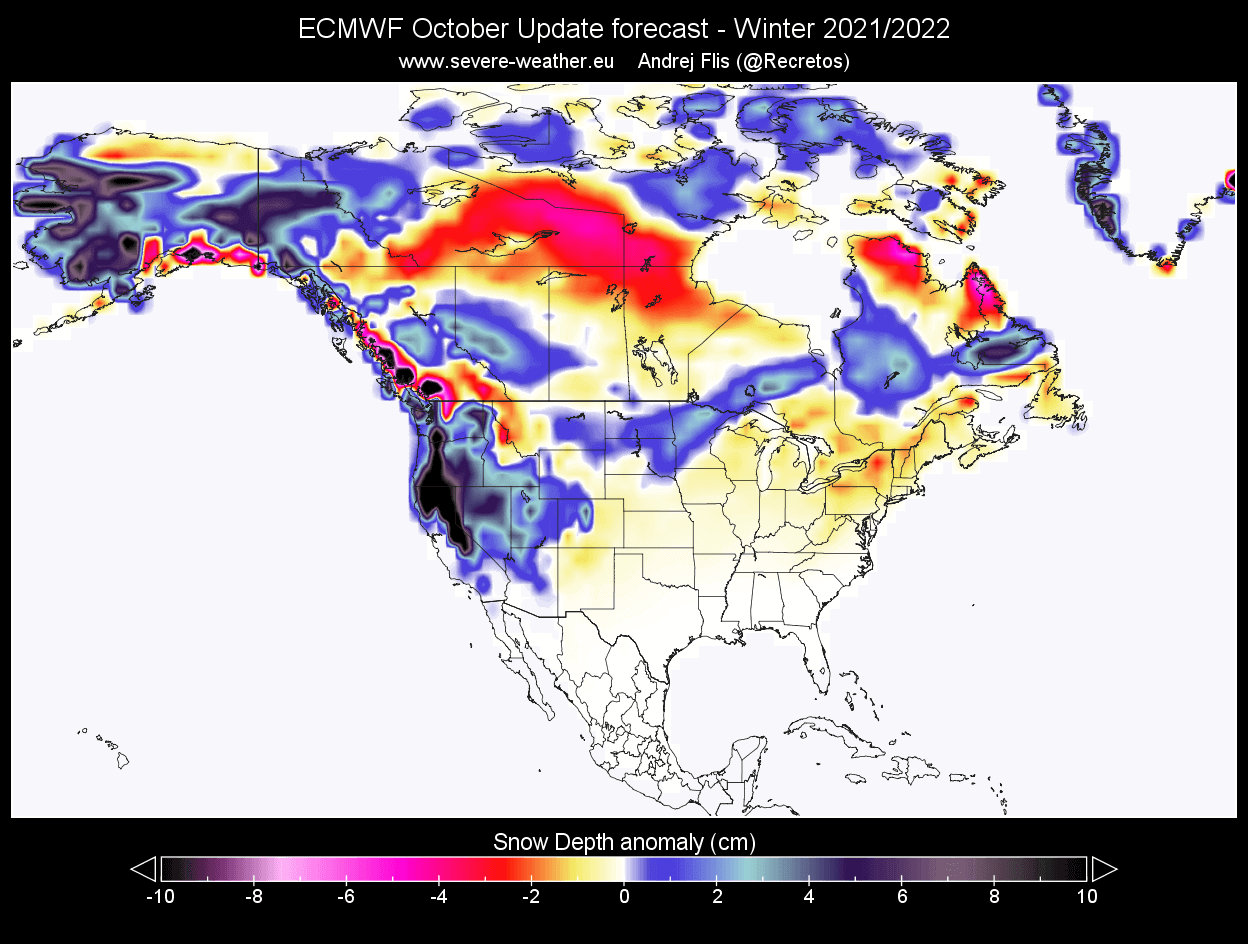
Over North America, we see a very interesting snowfall forecast. ECMWF suggests more snowfall than usual in most of the western United States. The increased snowfall potential continues over the Midwest and into southeastern Canada. Most of the central and eastern United States regions are forecast to have slightly less snowfall.
UKMO WINTER FORECAST
Our second model of choice is the UKMO model, from the official United Kingdom Met-Office. This has typically been a good performer in the past winters, so we tend to include it in our standard “suite” of model forecasts.
UKMO only has a slightly different pattern than the ECMWF, and quite honestly it seems just as likely at the current point in time. It shows the stronger La Nina blocking high-pressure in the Pacific, compared to the forecast from last month. But the main low-pressure area is centered further west over western Canada.
This causes a jet stream extension from North America upwards into Greenland. This means a more northwesterly flow is likely into the British Isles. But as a low-pressure area is hinted over northwest Europe, that means a warm southerly flow over central and eastern regions.
The temperature forecast also looks similar to the ECMWF. Over North America we have the cold pool over western Canada and Alaska, reaching down into the northern United States. The south-central and the eastern United States are forecast to be warmer than normal.
Europe now features a warmer winter, with the high pressure rising over the continent, as the low pressure and storm tracks stay further north.
Looking closer at Europe, we see the stronger warm anomalies focused over the entire continent. The western half has weaker warm anomalies, indicating increased potential for northerly flow and cold fronts into the region from the northwest. Otherwise, the strong high-pressure systems bring warmer southerly air into the continent over the Winter season.
Over North America, we see the double weather pole. Cold up north in western Canada, and warmer than normal in the east and down in the United States. The exception is the northwestern United States and the Midwest, which shows an extension of near-normal temperatures. That is likely the pathway for cold air spills down from Canada.
The precipitation forecast also nicely shows the “dipole” pattern over the United States, with drier in the south and wetter in the northern parts. Northern parts of the United States also have a higher chance of more snowfall, with the forecasted jet stream position. Europe is again precipitation neutral, with hints of higher precipitation over northern parts, due to the higher frequency of storms moving over this area.
CFSv2 WINTER FORECAST
As a counterbalance to European models, we usually use the main North American long-range model, the CFS version 2 from the NOAA/NCEP in the United States.
The CFS model also shows the strong high-pressure system in the Pacific and the Low-pressure system over central Canada and Greenland. This is the more typical La Nina situation we have mentioned before. The jet stream in the North Atlantic bends northeastward, over the British Isles and into Scandinavia.
Airmass temperatures are most interesting over North America, with a strong cold air anomaly in Canada and warmer air in the southern United States. The cold air is reaching further down into the northern United States compared to the forecast from last month. Europe is seen warm, as would be expected with storms moving far out to the north.

Looking closer at Europe, the surface temperatures are really warmer than normal over much of the continent. This happens because, as the main storm track stays further north, that means westerly to southwesterly flow/winds over the continent. That usually transports warmer air from the Atlantic or the southern regions.
The North American forecast is really a strong dipole pattern. Much colder than normal temperatures over Alaska and much of Canada, and warmth over the southern parts of the United States. The cold extends down into the northern United States, mainly into the northwest United States and the Midwest region.
As far as precipitation goes, Europe is forecast to have more precipitation over the northern half and central parts. The southern end of the continent is expected to have less precipitation than normal, and a drier winter season.
The precipitation anomaly forecast below for North America shows the main weather dynamics (with increased precipitation) over the northern and parts of the central United States. Drier than normal conditions are forecast for the southern end. Especially worrying is the dry area in California, which is already under severe drought conditions.

We have to keep in mind that most of the strong weather dynamics happen between the cold and warm anomalies, including snowfall. CFS has no snow depth forecast graphic, but this temperature and precipitation pattern would likely look similar to the ECMWF snowfall forecast seen earlier above.
WINTER FORECAST – OCTOBER UPDATE SUMMARY
Reading images and descriptions can be somewhat confusing. So to summarize, here is what the Winter season 2021/2022 forecast has to offer from the October update:
Europe is expected to have warmer than average temperatures over most of the continent, getting stronger towards the east. This, however, does not mean that there will be no cold fronts and colder days. It just implies that cold fronts and colder air mass intrusions will be less frequent over the region. Western parts are likely to see more frequent colder air intrusions than the eastern regions.
But the models are not 100% in agreement with the pattern over the North Atlantic. It can be tricky at this stage before we have a clearly defined pattern over North America. The main change is the positioning of the low-pressure over Canada. Changing the low-pressure system position from east Canda to central or west can have a big impact on the Europe Winter weather
Normal to wetter conditions are expected over northern Europe. The British Isles and Scandinavia could have a more unsettled winter, as the jet stream positions over these regions, bringing stormier conditions to this region. The mainland is expected to have average precipitation, with drier conditions likely in southwestern Europe and the Mediterranean.
North America winter forecast looks fairly solid to be a classical La Nina type winter. Most of western and Central Canada is to expect colder and snowier conditions, along with Alaska.
The United States can expect to see a “two-faced” seasonal pattern or a “two-faced” winter. The Northern United States is expected to be normal-to-colder than normal, with more precipitation This increases the chance of more snowfall, but more likely towards the western half and in the Midwest, and less likely in the eastern parts.
The Southern United States has a high chance for warmer and mostly drier than normal winter weather. This however does not imply that no cold front can reach the southern states. It just implies that in a La Nina pattern, it is much less likely to get frequent cold fronts down to the very south.
The official precipitation forecast is quite similar to the models above. We see an equal-to-higher probability for more precipitation (and snowfall) in the northwestern and the northeastern United States. The Southern United States is mostly drier than normal, especially in the southwest.
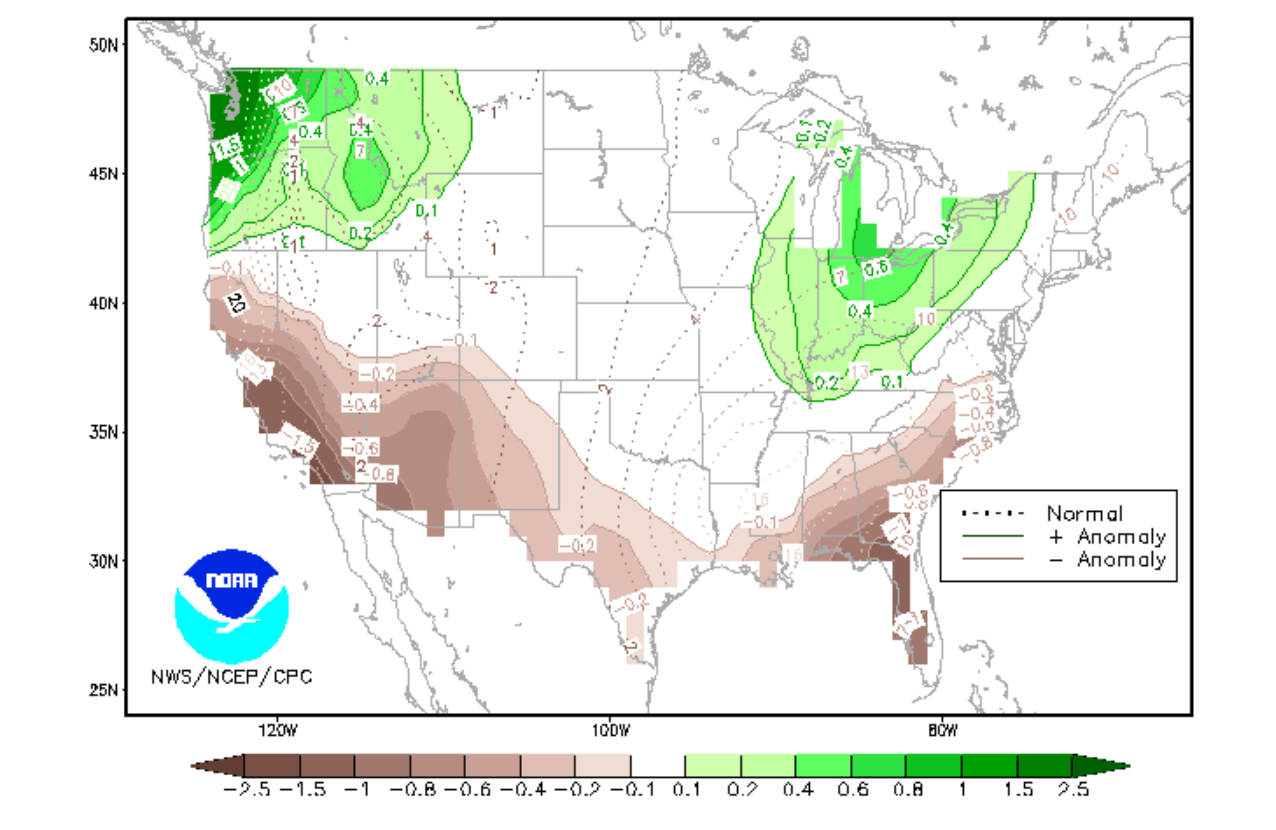
Below we have the official temperature forecast for the United States by NOAA. It shows the temperature probability, with colder to equal chances in the northern United States. Most of the southern half of the country has a higher probability of warmer than normal weather this winter season.

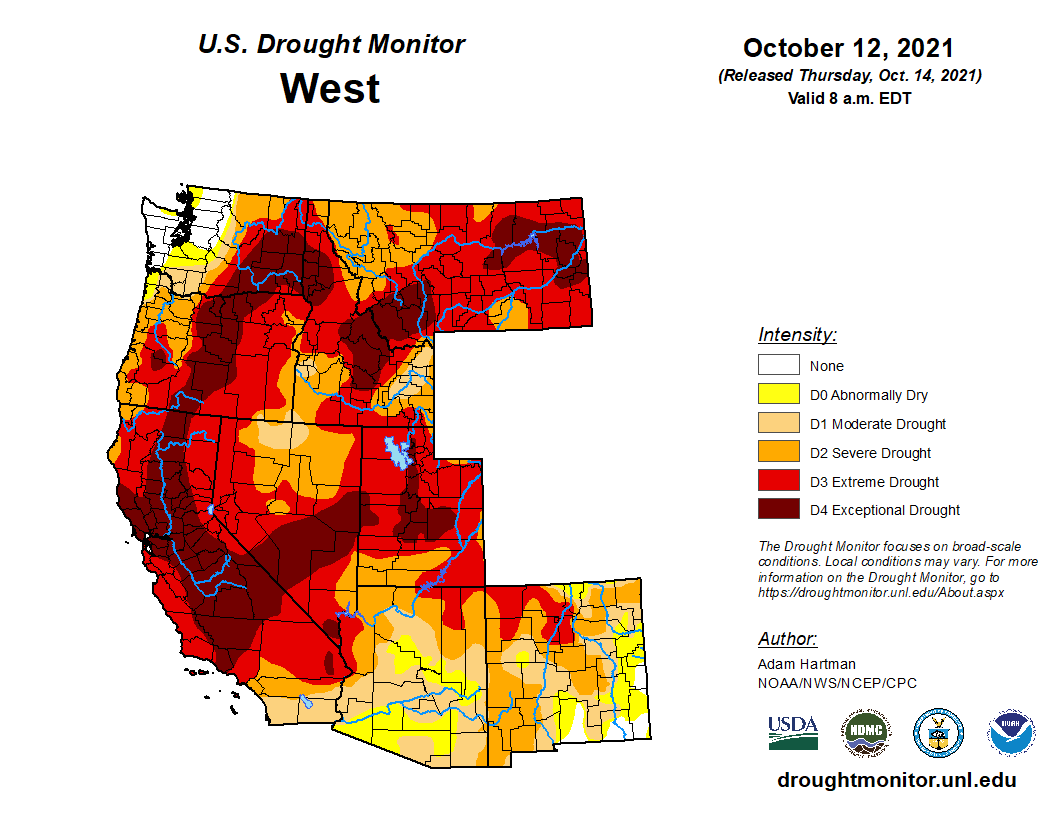
The problem with a La Nina winter is usually the persistence of drought conditions in the south and southwest. Below we have the latest drought graphic from NOAA, which shows the current drought conditions in the United States. We see exceptional drought conditions over the western United States.
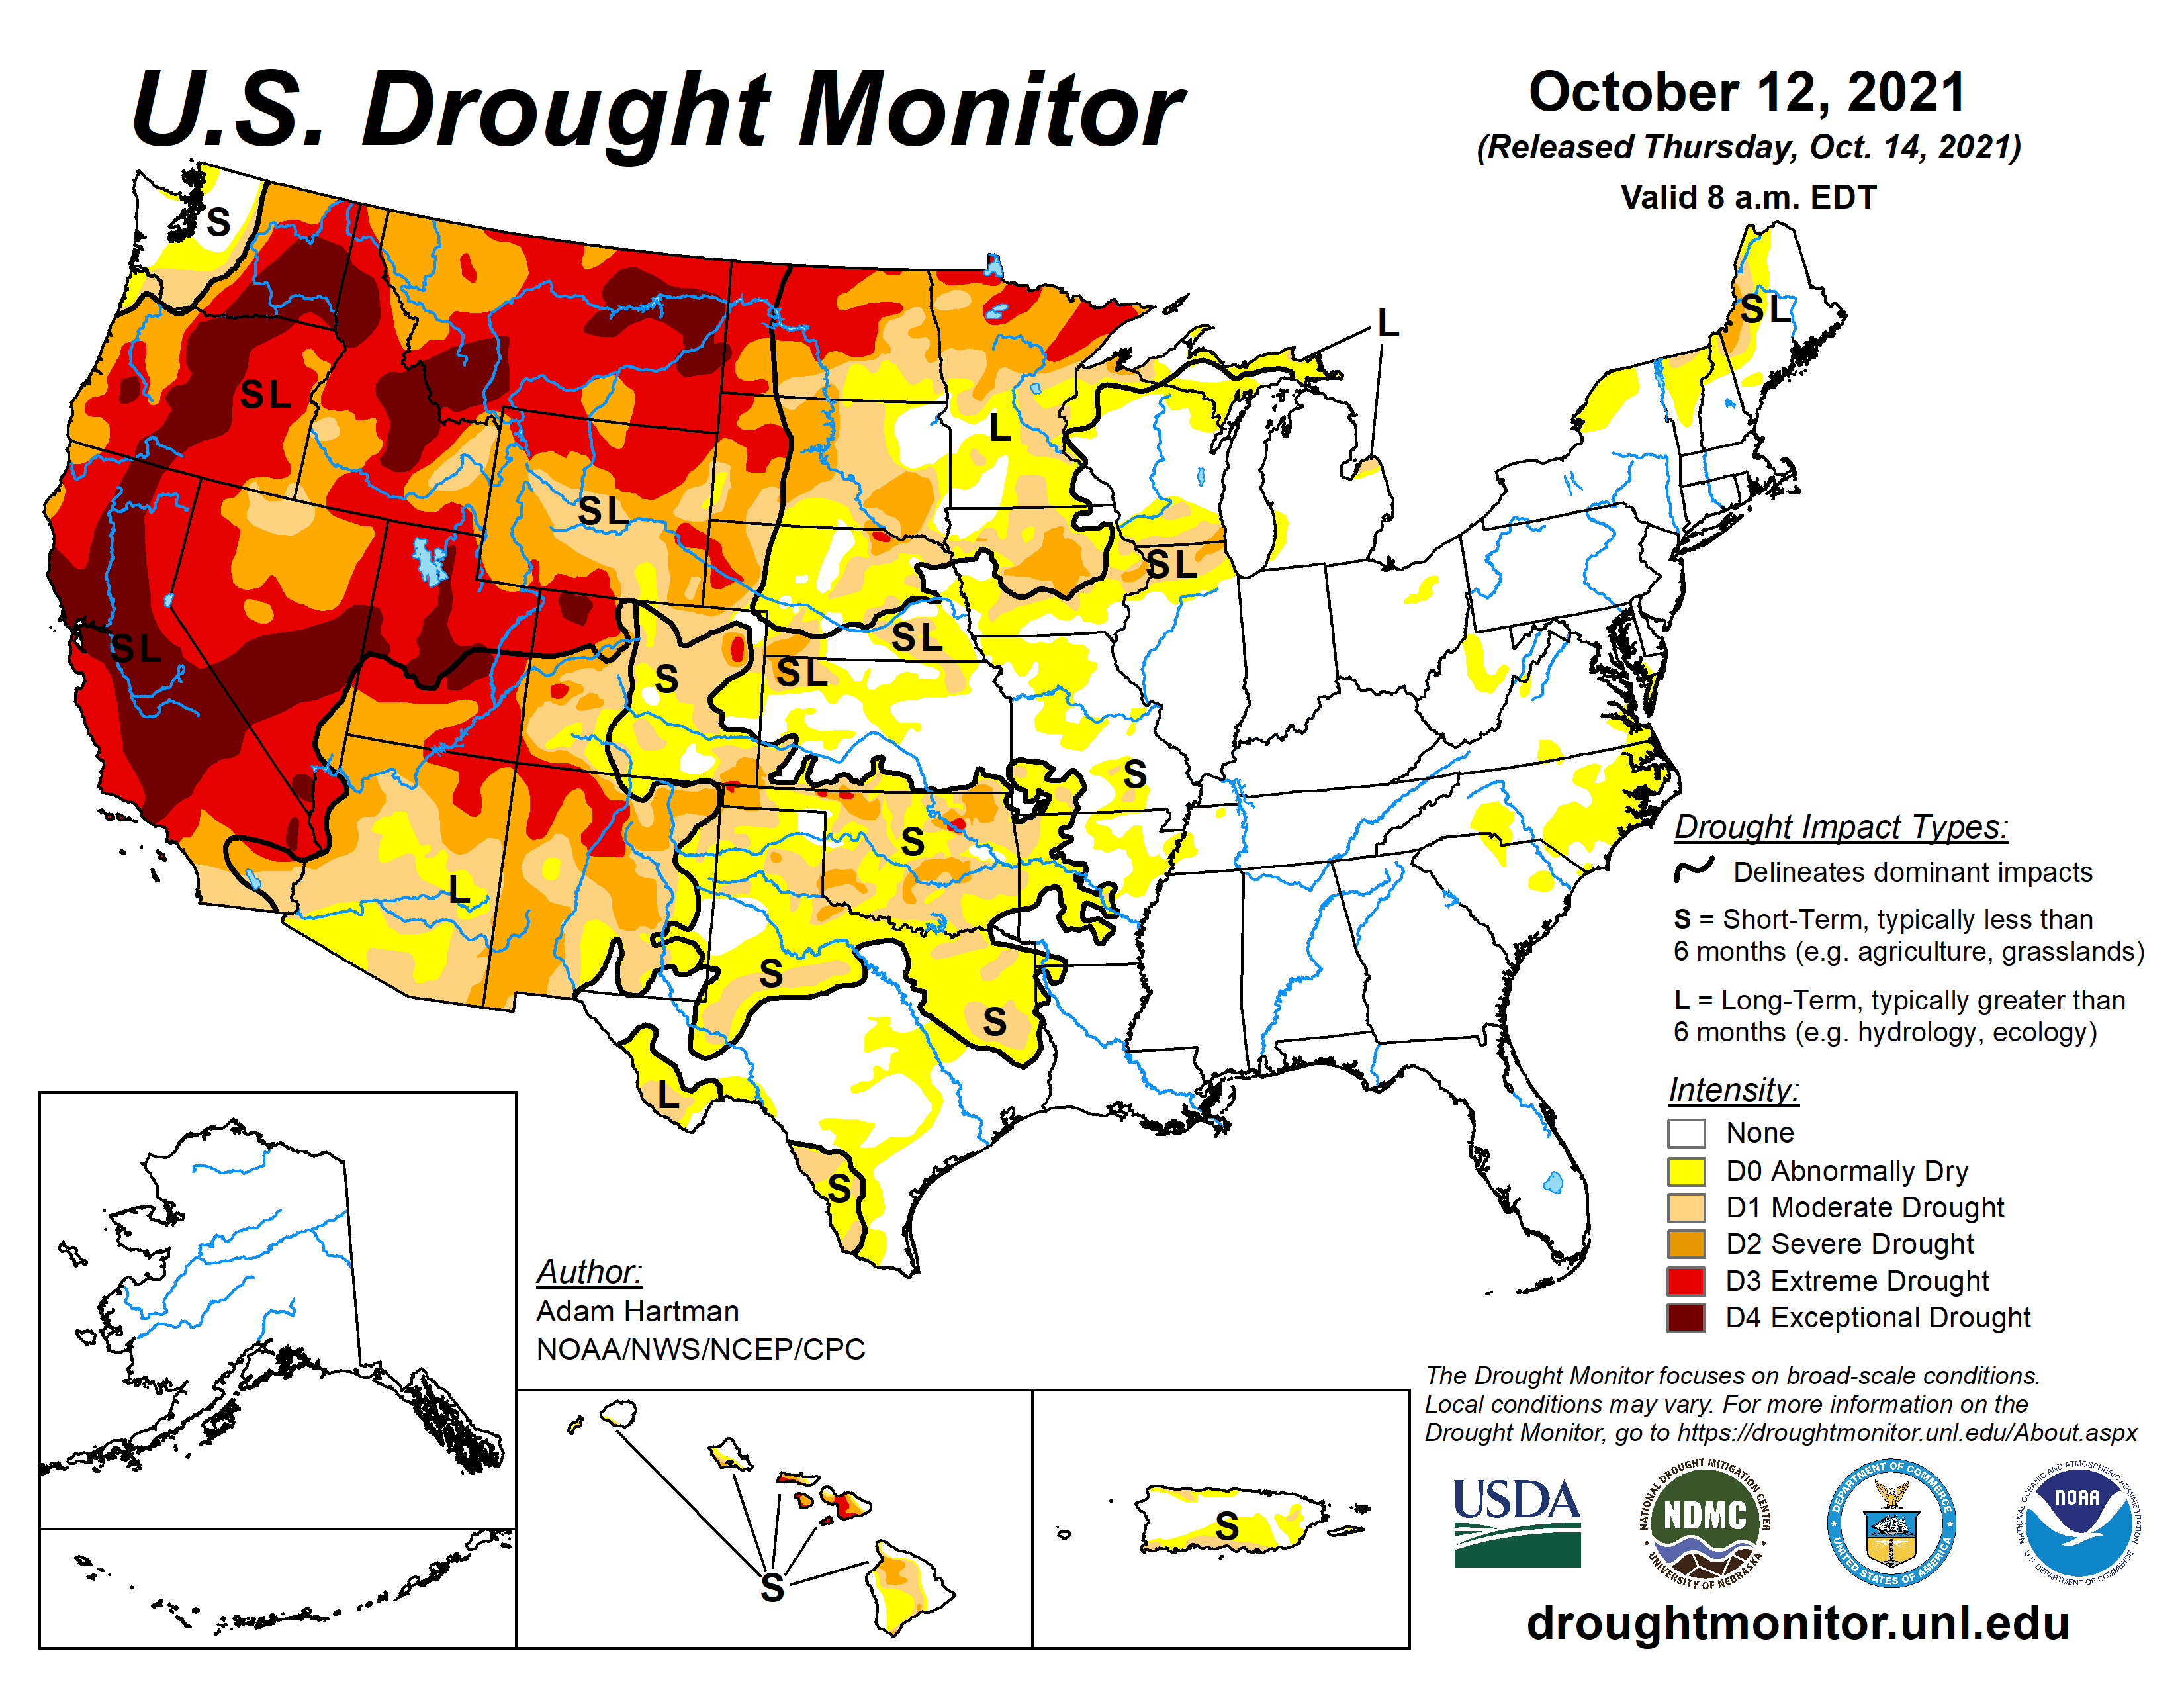
The northwestern United States is likely to recover to some degree during the winter season, as we have seen on the precipitation forecasts. But the drought conditions in the southwest are expected to continue, and likely even getting worse in a La Nina Winter.
The entire southwest and especially southern California is expected to have continued severe drought conditions through winter. Drought conditions are likely to be declared in the southern states as well over the winter, as La Nina is known to produce less precipitation in the southern states during the winter season.
STRATOSPHERIC WARMING
One of the more important sources of winter weather dynamics is the well-known polar stratosphere and the Polar Vortex. At the bottom of the page, you can find a link to our latest Polar Vortex and Stratosphere development article. It contains info on what the stratospheric Polar Vortex is and how it is currently influencing our weather already.
Long-range forecasts are generally not as good at forecasting stratospheric dynamics in detail. This means they tend to underestimate any potential Sudden Stratospheric Warming events (SSW). That is because the final forecast is made out of many individual calculations, which have different ideas about stratospheric development.
A stratospheric warming event can have a major impact on the circulation and can cause major pressure changes in the Northern Hemisphere. So a potential SSW event is an important factor that can change the course of winter in either direction across the Northern Hemisphere.
We actually had a stratospheric warming event last winter, which changed the weather circulation patterns and helped to produce the strong cold outbreak in the southern United States in February 2021.
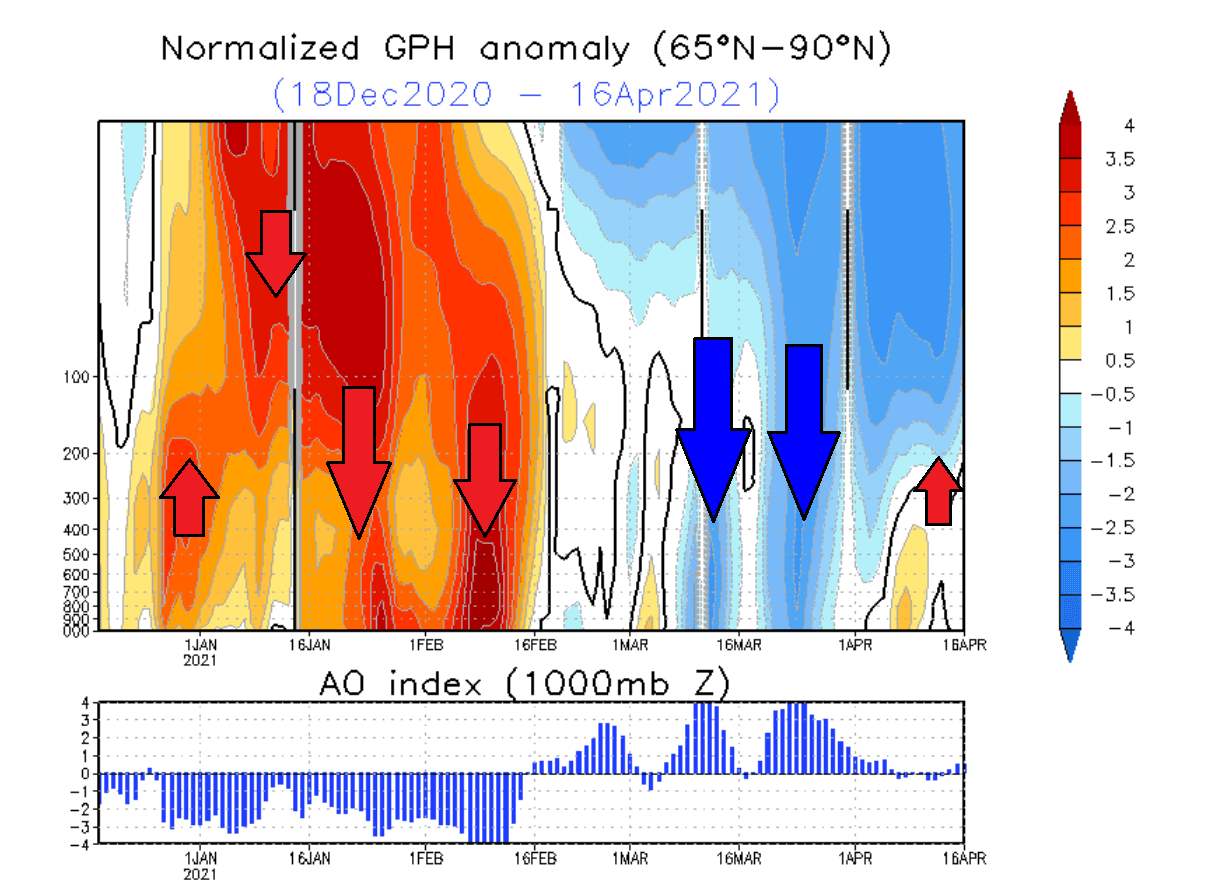
Below you can see strong positive values in the stratosphere in early January, associated with the higher pressure buildup during a stratospheric warming event. The influence from the event was slowly descending over time, reaching the surface levels by mid and late January. This persisted well into February, influencing the weather circulation and releasing colder air out of the Arctic (negative AO index on the bottom).
We produced an analysis of the January-February 2021 winter period, showing pressure anomalies on the next image. You can see a strong high-pressure system present over the North Pole. This dominant high-pressure system originated from the stratospheric warming event and the polar vortex collapse, as you can see in the image above.

A strong high-pressure system over the Arctic can heavily disrupt the weather circulation and can unlock the cold air from the Arctic regions towards the mid-latitudes.
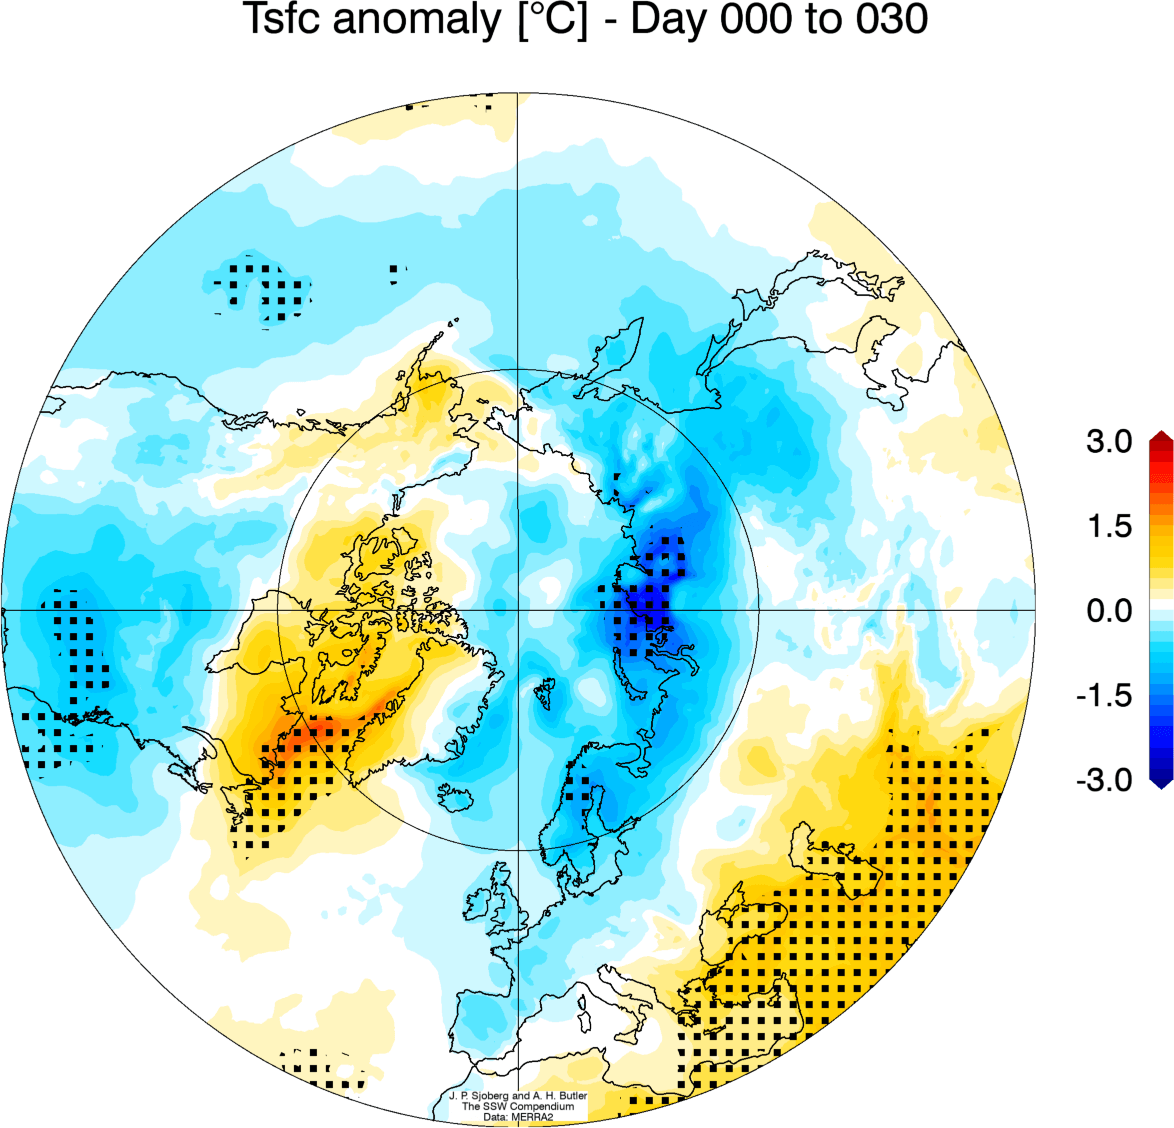
Below is an image that shows an average temperature pattern 0-30 days after a stratospheric warming event. High pressure over the Arctic helps to unlock the cold air out of the Arctic regions, sending it down into the mid-latitudes of the United States and Europe. Not every stratospheric warming event produces this pattern, but this is an average image of many events in the past 40 years.
You can read more about the developing polar vortex and the stratosphere for the upcoming winter, in our specialized article linked below:
Polar Vortex developing for Winter 2021/2022
We will release monthly updates, as fresh winter forecasts are produced by the models, so make sure to bookmark our page. Also, if you have seen this article in the Google App (Discover) feed, click the like button (♥) there to see more of our forecasts and our latest articles on weather and nature in general.
SEE ALSO:
The Orionid Meteor Shower 2021 Peaks This Week. Here is How to See and Photograph it