Winter 2025/2026 snowfall predictions show a global weather signal from the La Niña, now fully formed and still cooling, getting ready for Winter. From Canada to the United States and across the Atlantic to Europe, we will look at the new Full snowfall forecasts and trends, with February and March data now also available.
First, we will look at the one main global weather driver in the upcoming weather seasons, La Niña. What does the latest ocean analysis data show, and what snowfall development can we expect based on its past influence?
Then, looking at the global long-range weather forecasting systems and historical data analysis, you will see the snowfall predictions for the upcoming Winter and how they are altered by these strong global influences.
GLOBAL SEASONAL WEATHER INFLUENCE
La Niña is an ocean anomaly in the Pacific ENSO regions. ENSO is a region of the equatorial Pacific Ocean that changes between warm and cold phases. Typically, there is a phase change around every 1-3 years.
The cold phase is called La Niña, and the warm phase is called El Niño. We are currently in a La Niña phase, entering its 3rd year, which is a rare occurrence.
ENSO phases have a significant influence on tropical rainfall, pressure patterns, and the complex exchange between the ocean and the atmosphere. The image below shows the circulation pattern of a cold phase, which has just formed and is still cooling further.
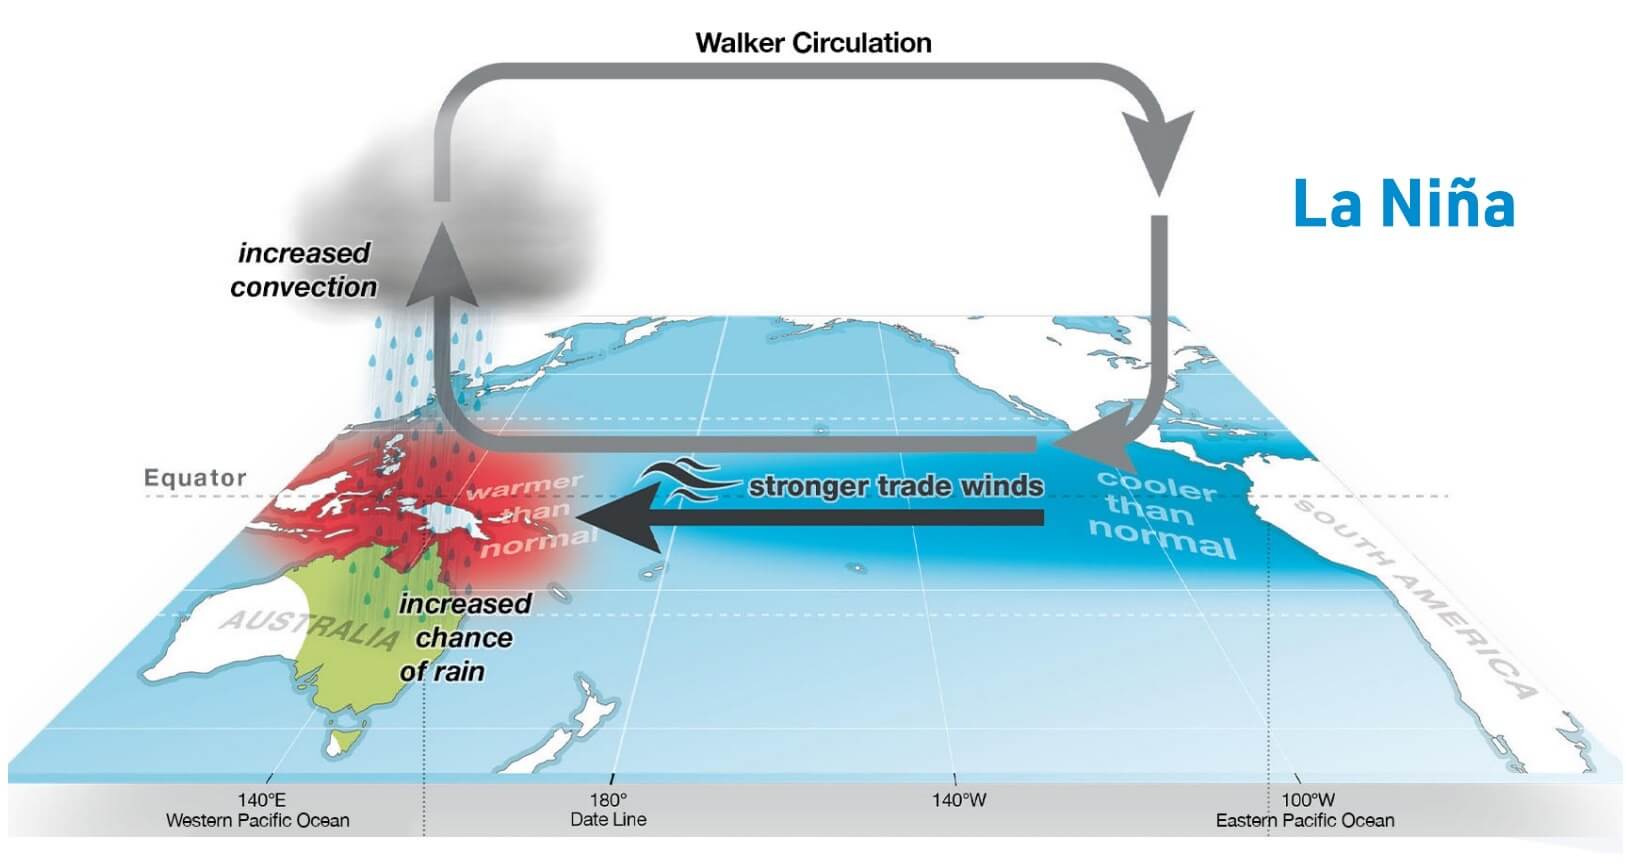
By doing this, the ENSO has a strong impact on tropical rainfall and pressure patterns, altering the atmosphere-ocean feedback system. This feedback system spreads the ENSO influence globally, especially the Winter temperature and snowfall patterns.
Below you can see the latest surface analysis of the tropical Pacific Ocean. Cold ocean anomalies extend across the tropical Pacific, “wave-shaped” due to the easterly trade winds. This is the now-active La Niña, which is still strengthening at the moment, but is expected not to surpass weak to moderate levels.
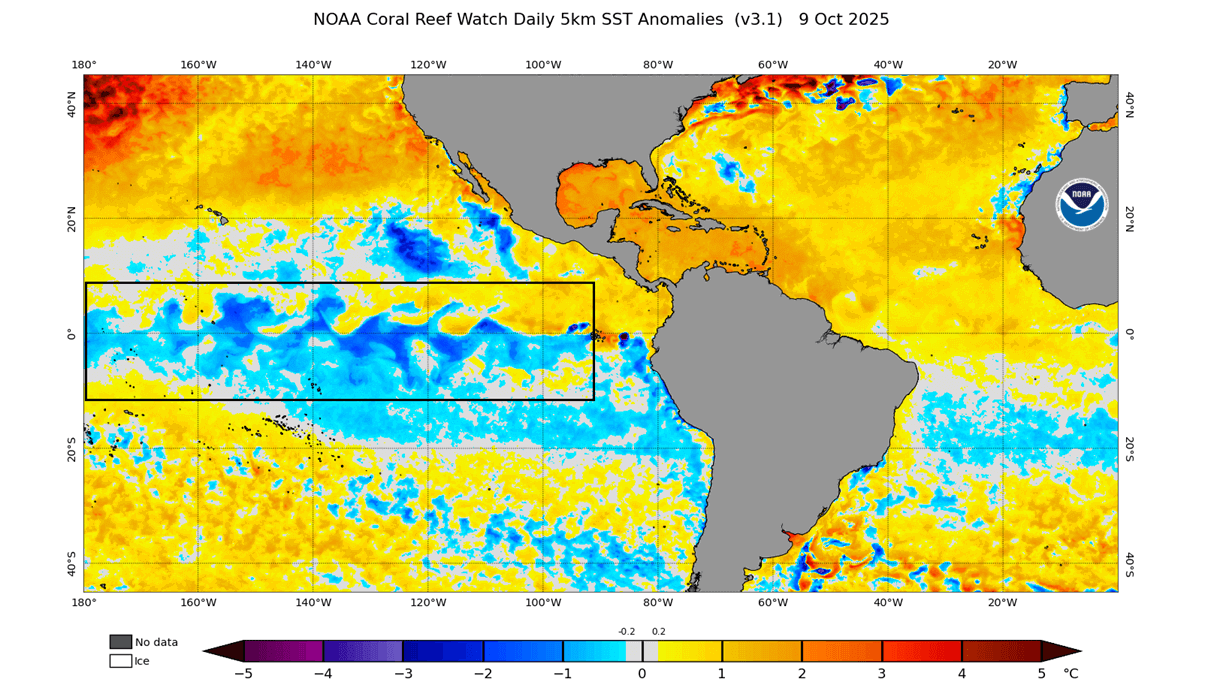
La Niña usually forms during strong trade winds, which can tell us a lot about the state of global circulation. This way, we can use these anomalies as an “indicator” to better understand the current state of the global climate system and what to expect in the seasons ahead.
Below, you can see the ocean anomaly progress since early July. What stands out is the growing and expanding area of cold anomalies across the tropical Pacific, which nicely shows the emergence of the new La Niña event.
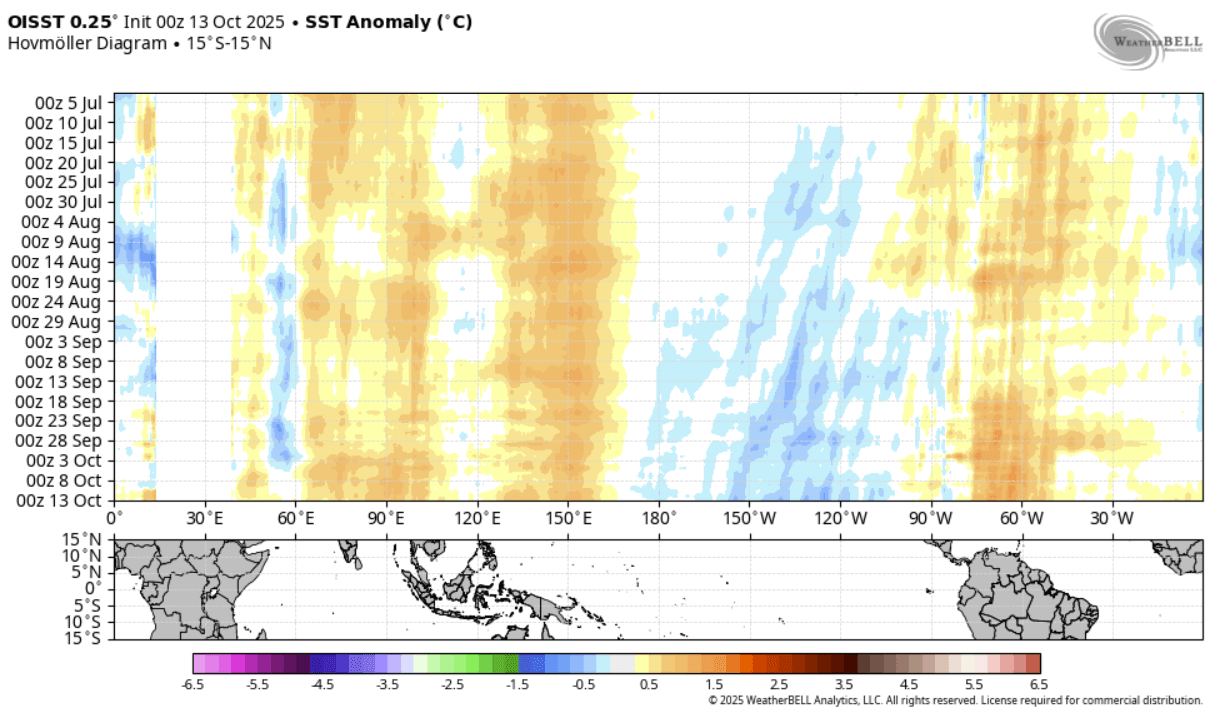
This image is from WeatherBell, using a commercial license.
ENSO WINTER FORECAST
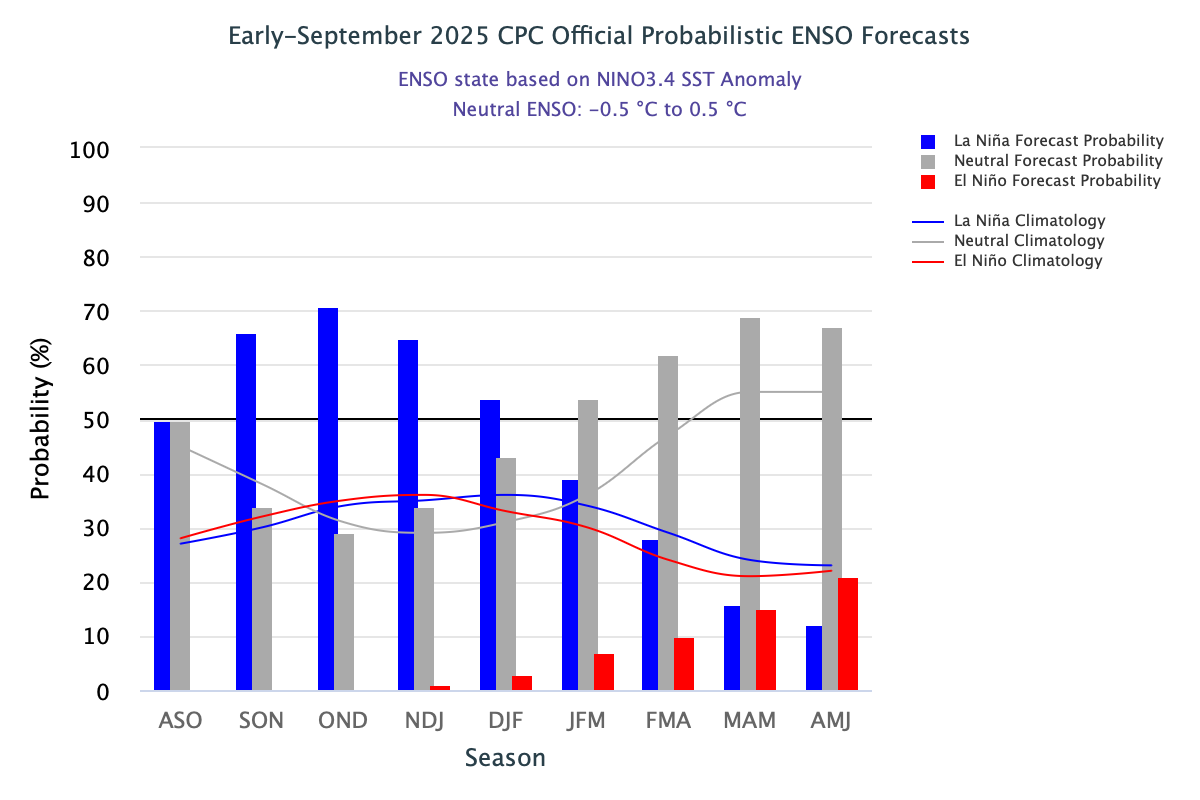
The Official NOAA CPC probability forecast graphic below shows the long-range forecast of the central ENSO region. As forecasted, the La Niña conditions are expected to persist over the Fall and into Winter. A weakening of the cold event is expected for early next year, with a shift to a neutral phase during spring.
To better understand the ENSO changes, we produced a video showing the La Niña anomalies forming and emerging in the ocean.
The video below shows the developing cold ocean anomalies in the equatorial Pacific over the past 90 days, as we head deeper into Fall and trade winds strengthen.
So what exactly does this mean for the winter weather patterns and snowfall potential? We will take a closer look at the weather influence that La Niña usually shows over North America, where it has a more direct impact.
Europe is not known to have any specific/direct influences, as it is too far from the source. But that does not mean it has no impact.
La Niña does change the weather globally, but apart from the direct influence over North America, places like Europe have many other factors at play before any influence can spread this far directly.
NORTH AMERICA WINTER WEATHER PATTERNS
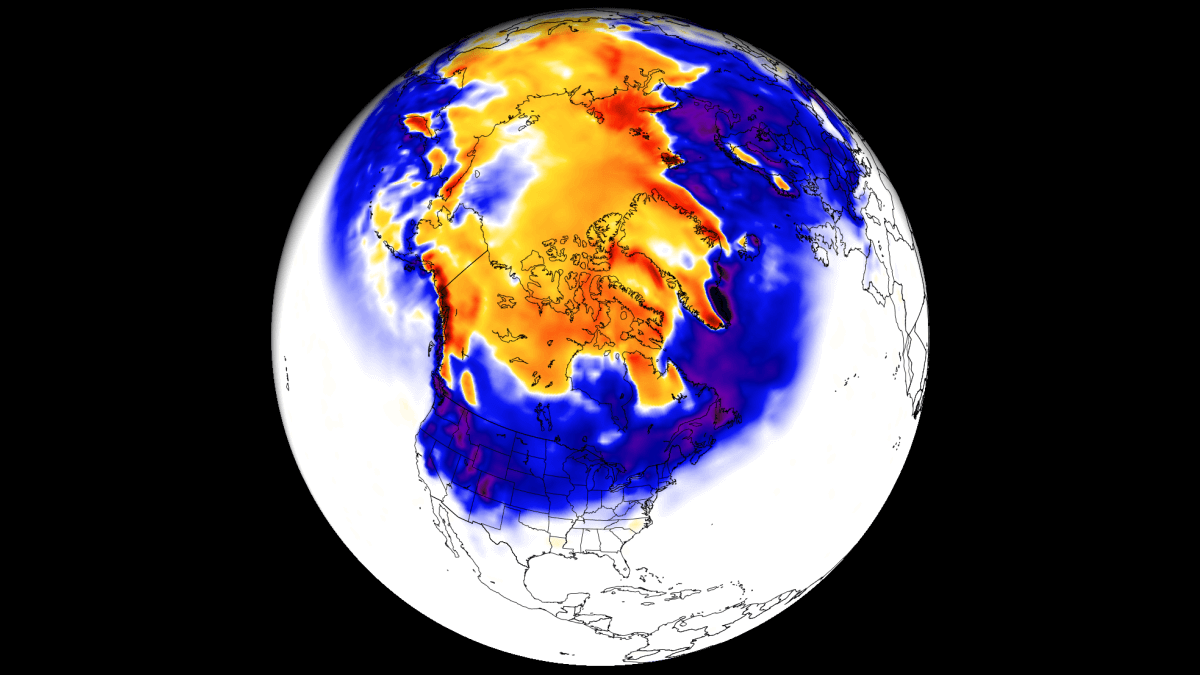
Typically, the first influence of these ocean anomalies can be seen in the jet stream patterns changing. The jet stream is a large and powerful stream of air (wind) at around 8-11km (5-7mi) altitude.
Historically, a strong blocking high-pressure system in the North Pacific is the most typical effect of a cold ENSO phase. That tends to redirect the polar jet stream down over the northern United States, bringing along a colder airmass.
You can see the jet stream redirection in the image below, which shows the average jet stream position in La Niña winters and the resulting weather patterns developing over the United States and Canada. Notice the high pressure in the North Pacific, pushing the jet stream upwards.
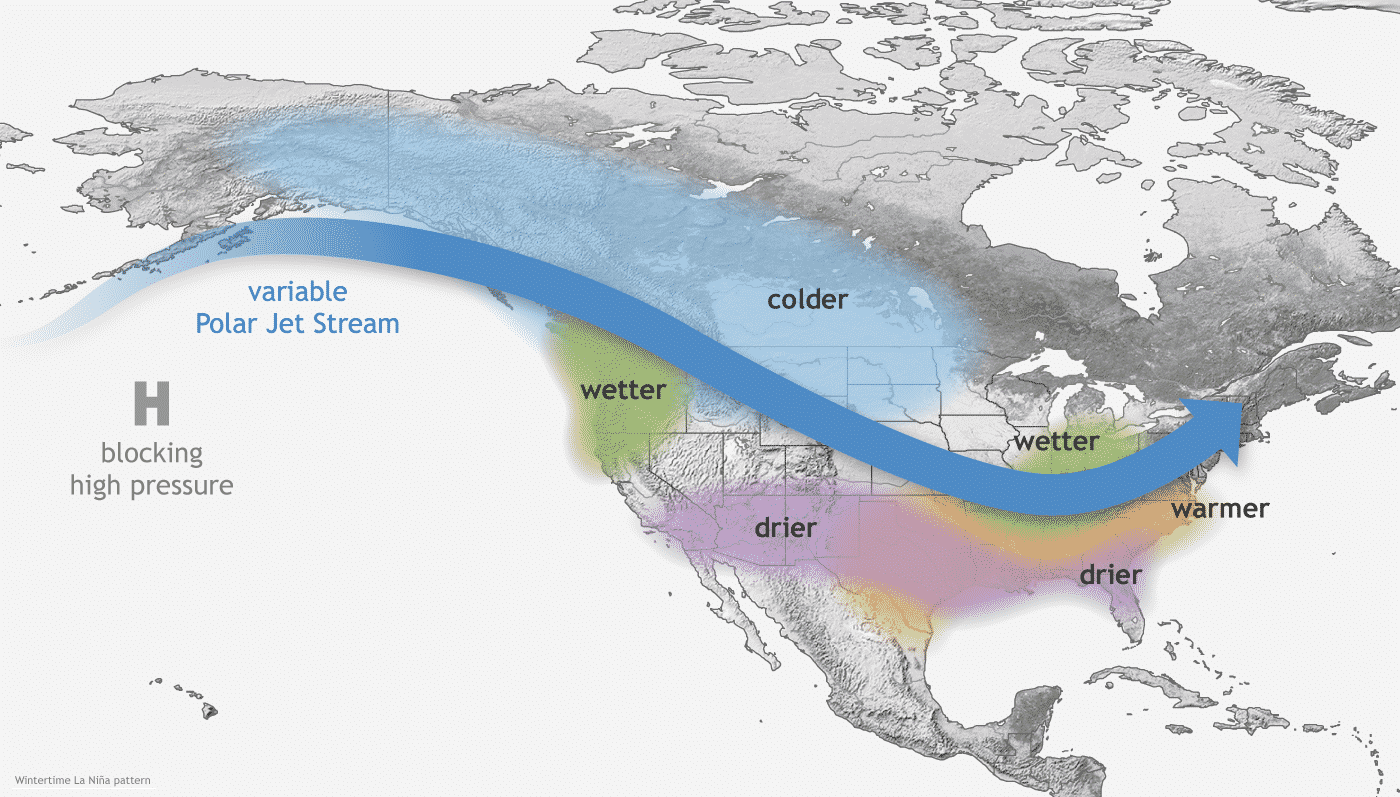
The displaced jet stream brings colder temperatures and winter storms from the polar regions down into the northern and northwestern United States. Warmer and drier winter weather prevails over the southern states.
Looking at the temperature analysis for the weak La Niña winters, we can see the cold anomaly area under the jet stream in western Canada and the northwestern United States. A cooler area extends over the Midwest and down into the south-central plains and partially to the east.
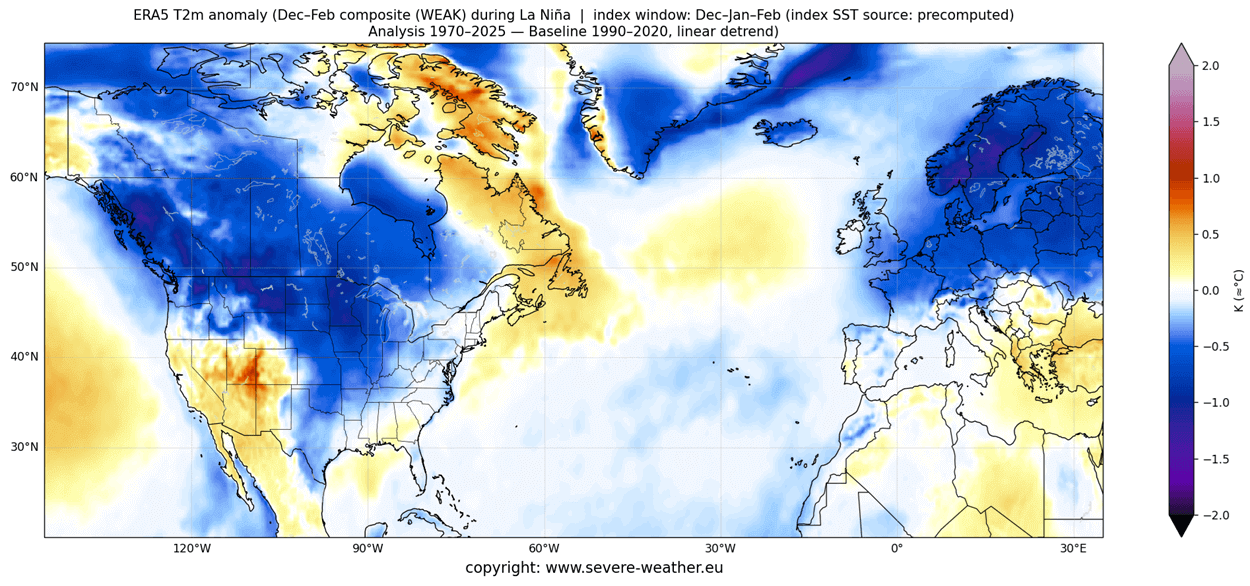
Warmer-than-normal weather and mild winter conditions typically develop over the southwestern United States, parts of the eastern United States, and eastern Canada. This image shows data from some older winters too, so it tends to look colder than some of the more recent winters. But it does highlight the impacts and trends.
So, as the colder air is more easily accessible to the northern United States, this increases the snowfall potential when moisture is available. In the graphic below by NOAA-Climate, you can see the average snowfall pattern for La Nina years, as expected for this Winter season.
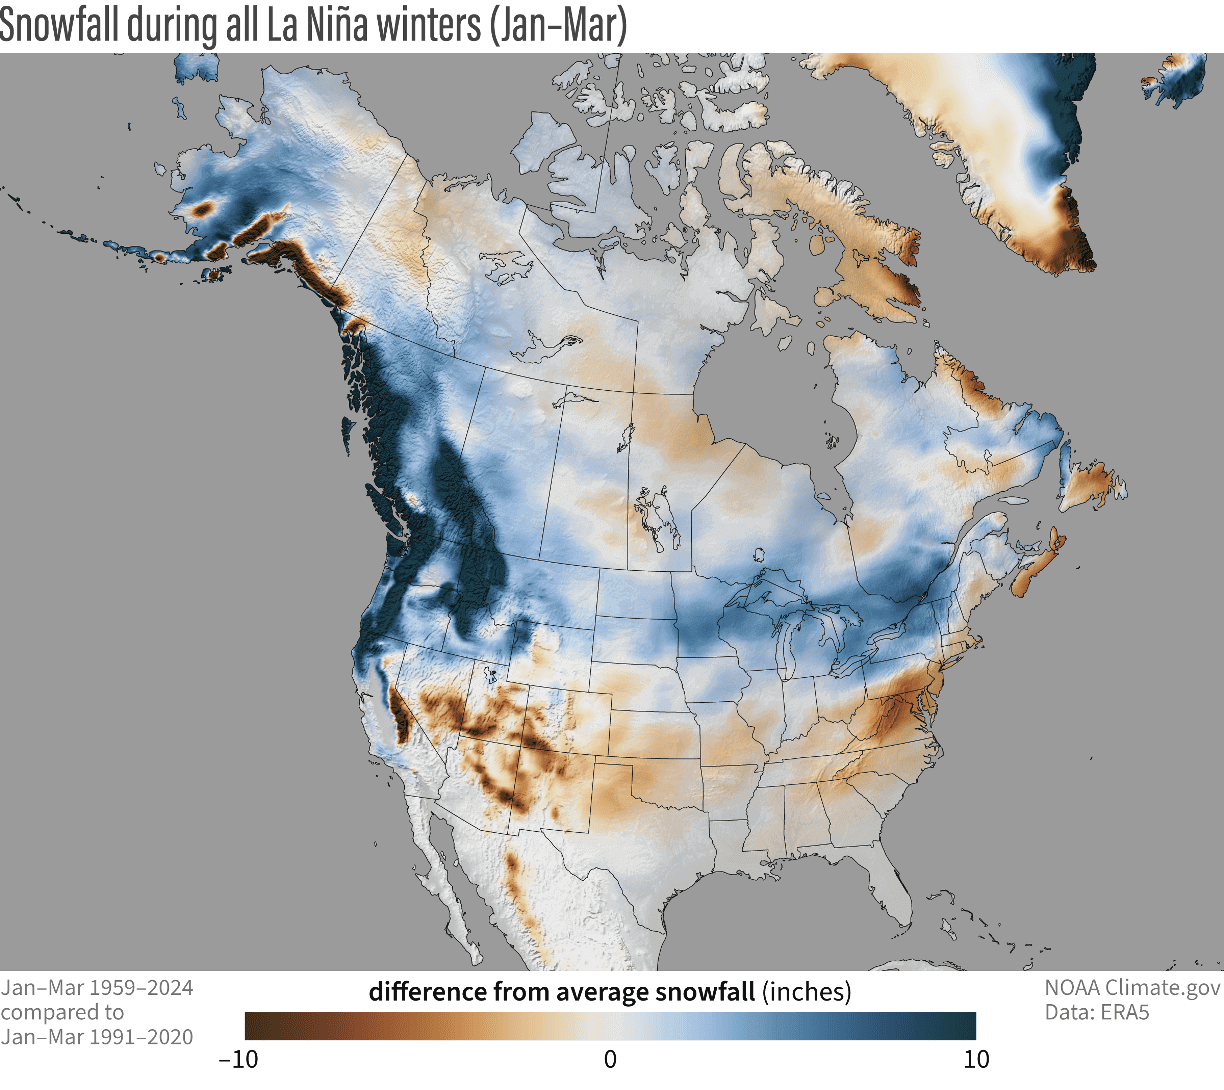
Besides the northwestern United States and the Midwest, you can also see more snowfall potential over parts of the northeastern United States and southeastern Canada.
Now, it’s time we look at some actual Winter snowfall predictions from the latest forecast models. Since the latest forecast data was released in early October, we now have the March data also included. So you are in for a full Winter and early Spring snowfall forecast.
WINTER 2025/2026 FRESH SNOWFALL PREDICTIONS
The format of this forecast is simple. We will look at two well-established seasonal weather forecasting systems. First is the ECMWF, and then it is the UKMO. The data used to produce these graphics is the latest available at the present time, from early October.
You will see the average snowfall forecast for the meteorological Winter season, covering the December-January-February period. We will then do a monthly breakdown, as there are a lot of details in the monthly forecast that the whole seasonal average cannot show.
We will start with the ECMWF, the most often used and highly regarded seasonal forecasting system.
First, looking at the seasonal average, we see below-normal snowfall over much of the continent, with the main snowfall areas towards the north. But you can see some central and western areas show less of a snow deficit.
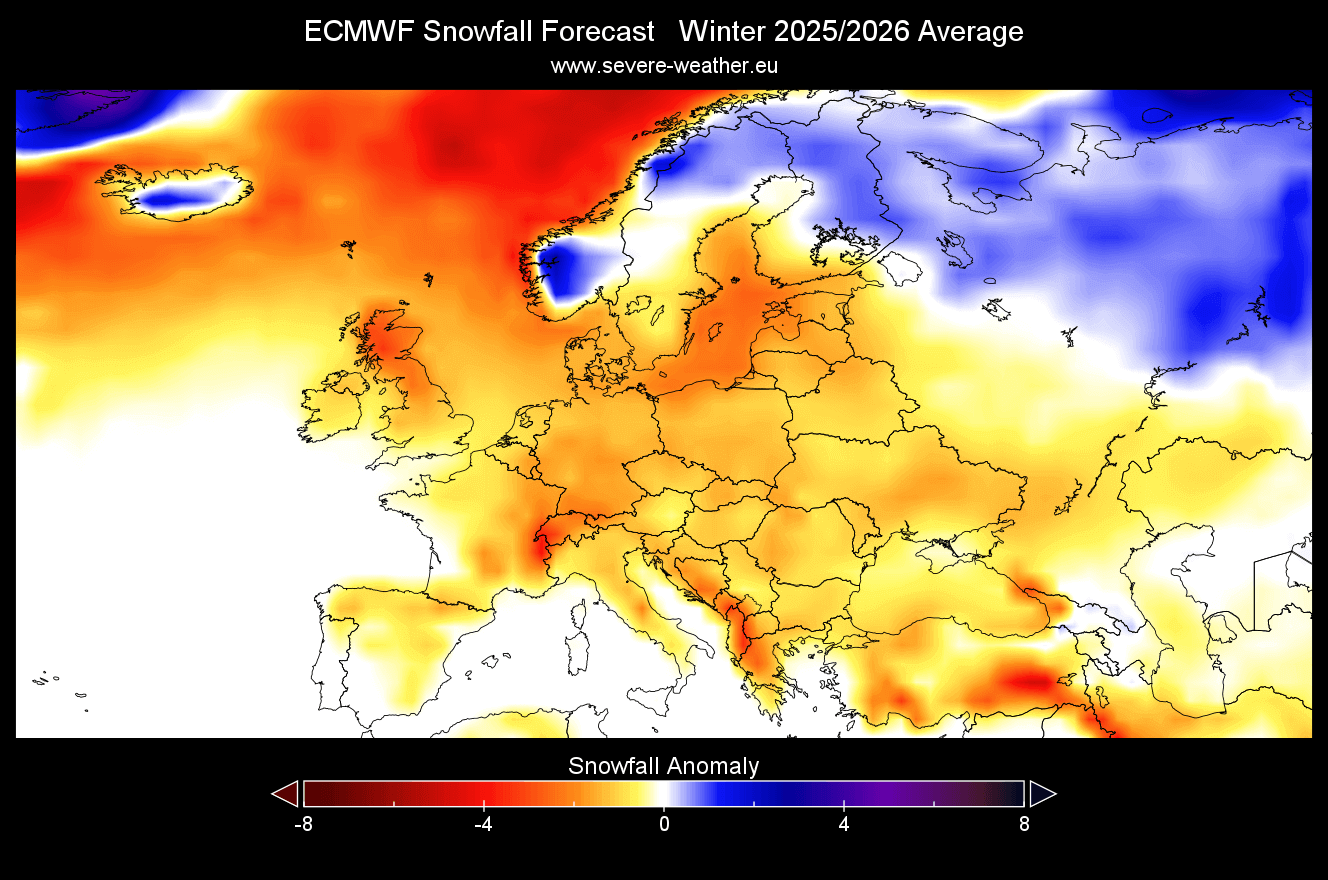
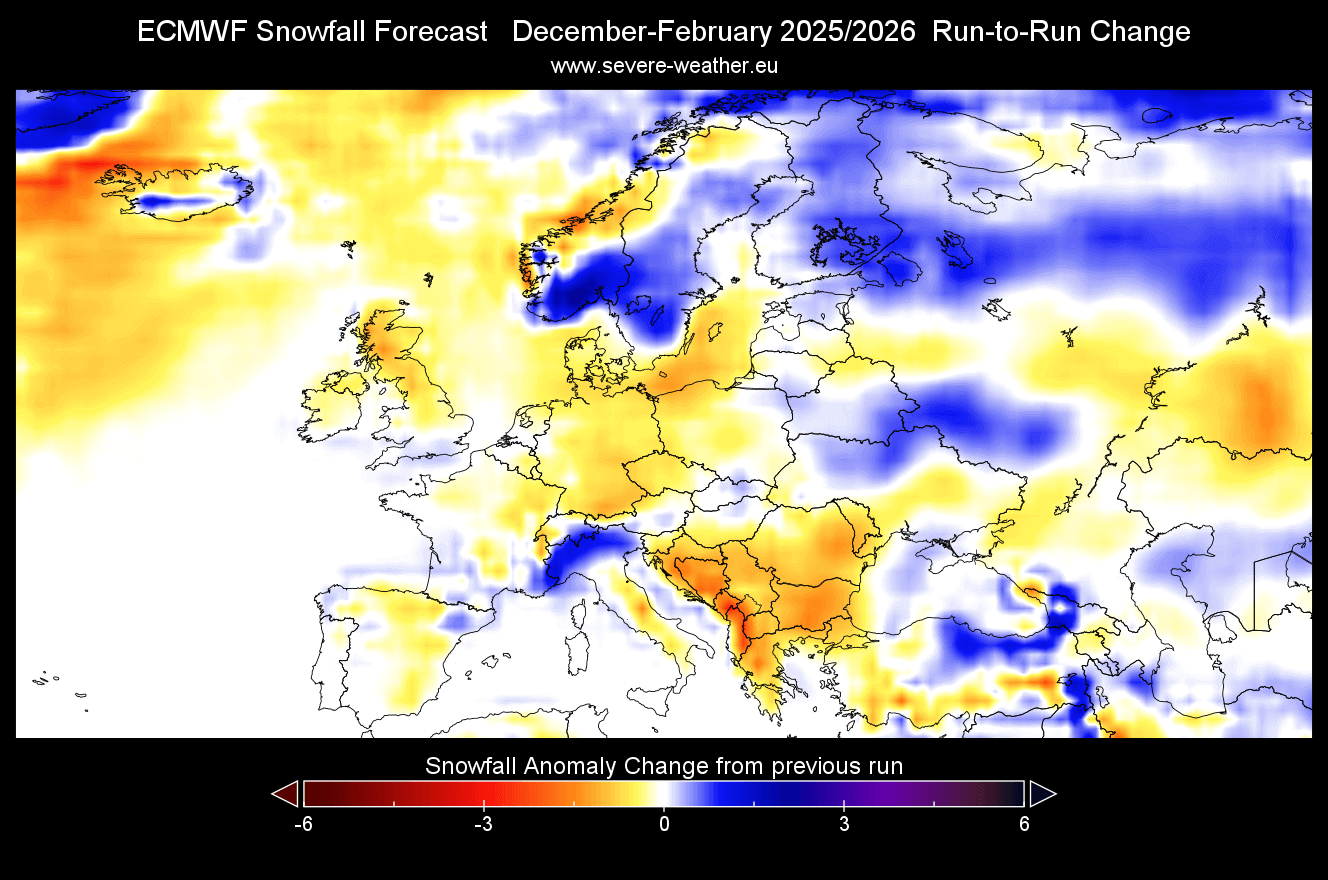
Compared to the forecast data from the previous month, there is little improvement, with most of the continent showing a little bit more snowfall deficit. There is more snowfall now forecast in the latest data over central and west-central parts, and over the southern UK.
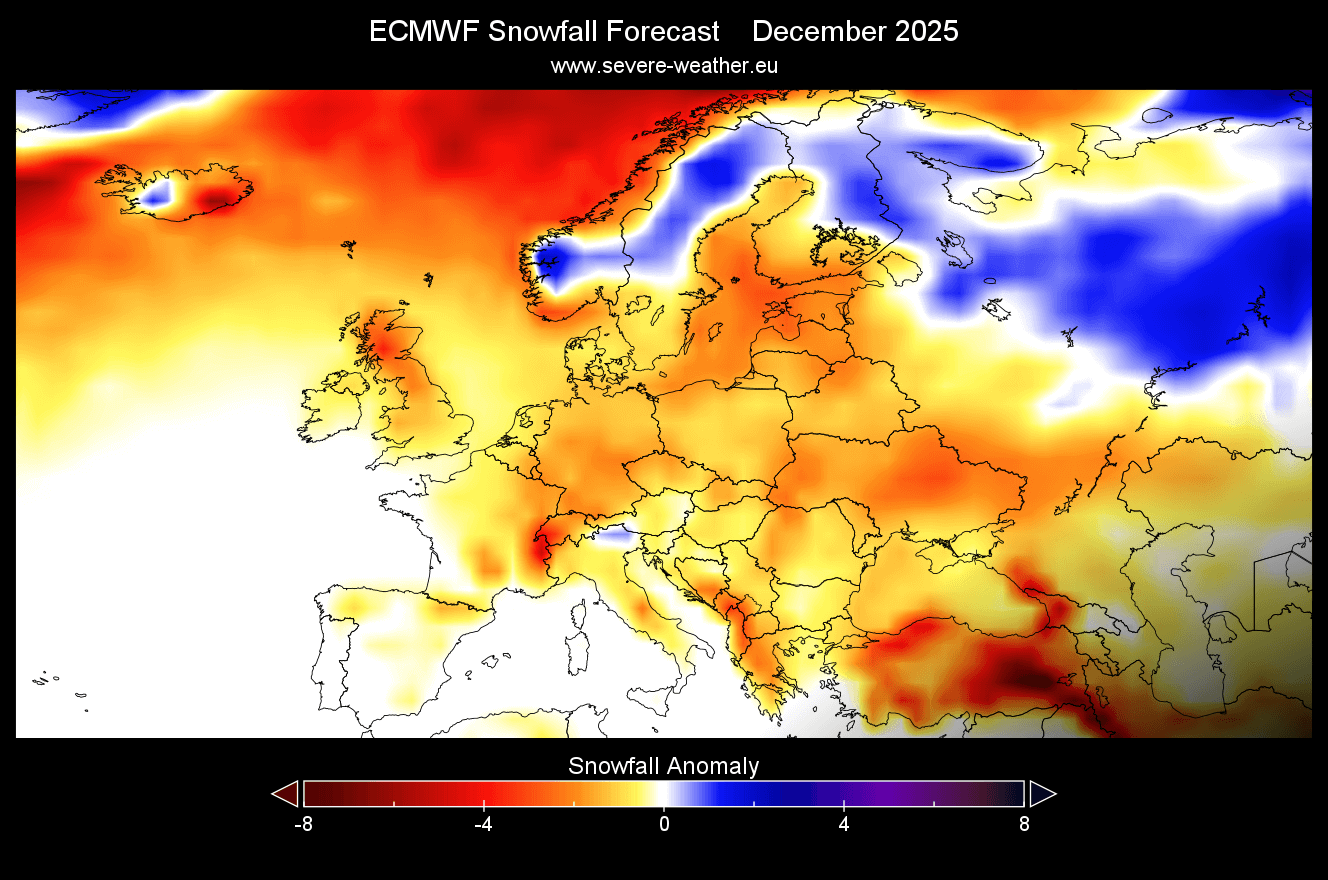
The December snowfall forecast shows mostly negative anomalies, apart from the far north. It also shows the influence of a high-pressure system, as the forecast does not permit a lot of widespread snowfall scenarios, apart from some near-normal snowfall areas in the central and western parts.
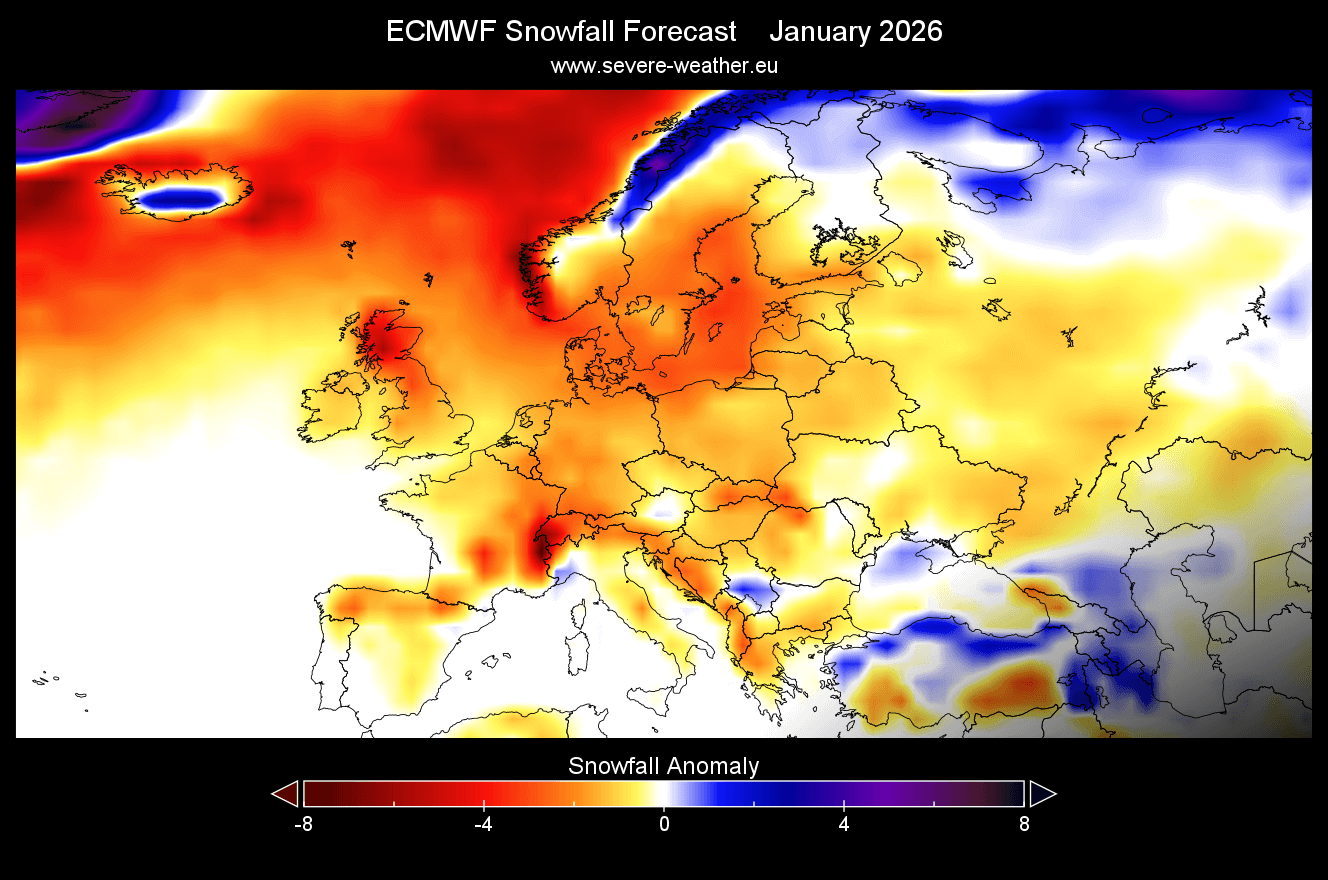
In the January forecast, there is little to no improvement. Most of Europe is forecast to have less snowfall in mid-winter, but we do see some areas towards the southeast getting more snow in this period.
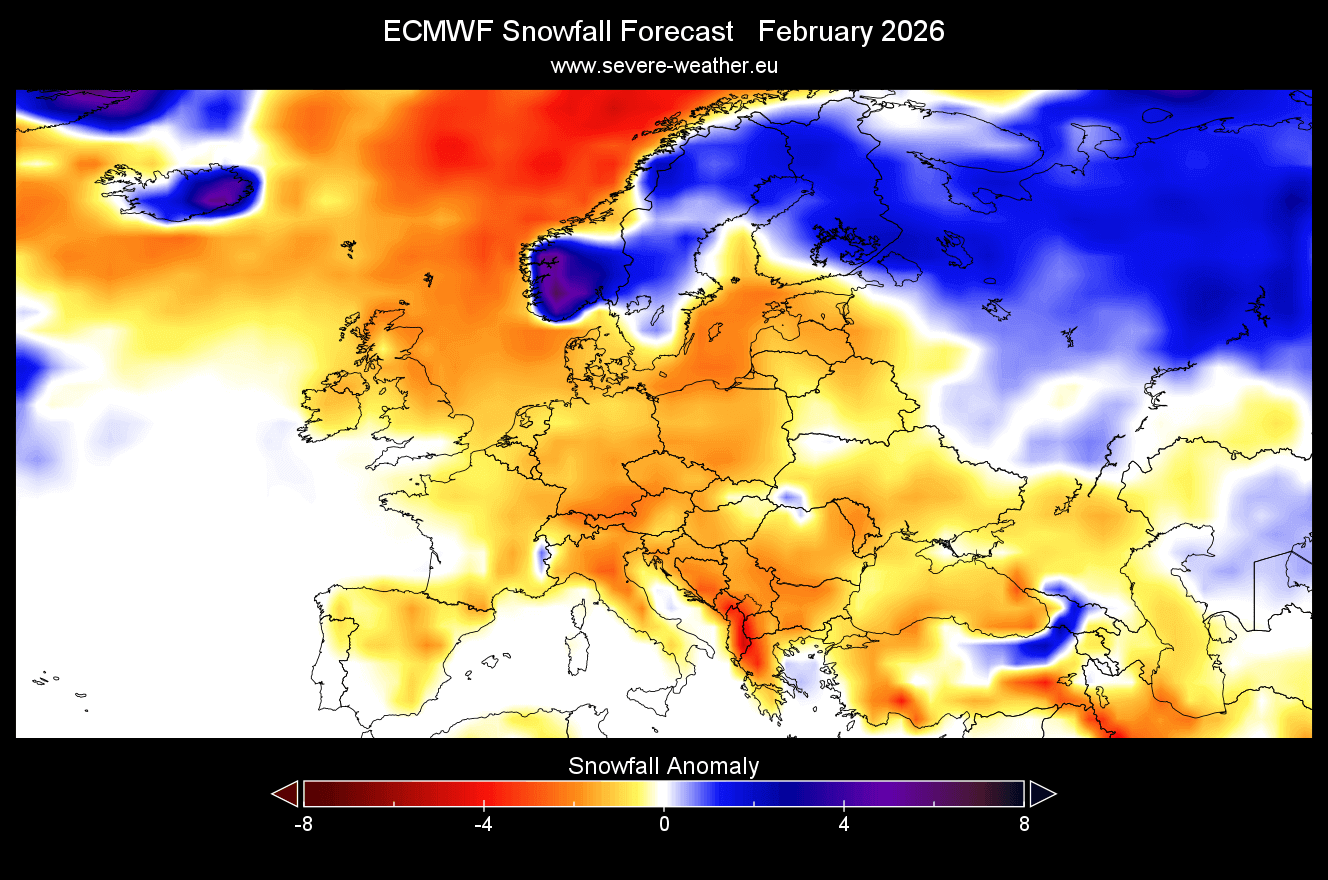
The February forecast is again pushing the main snowfall area to the north, along with the jet stream. This means a westerly wind and milder conditions with less snowfall than normal over the rest of the continent.
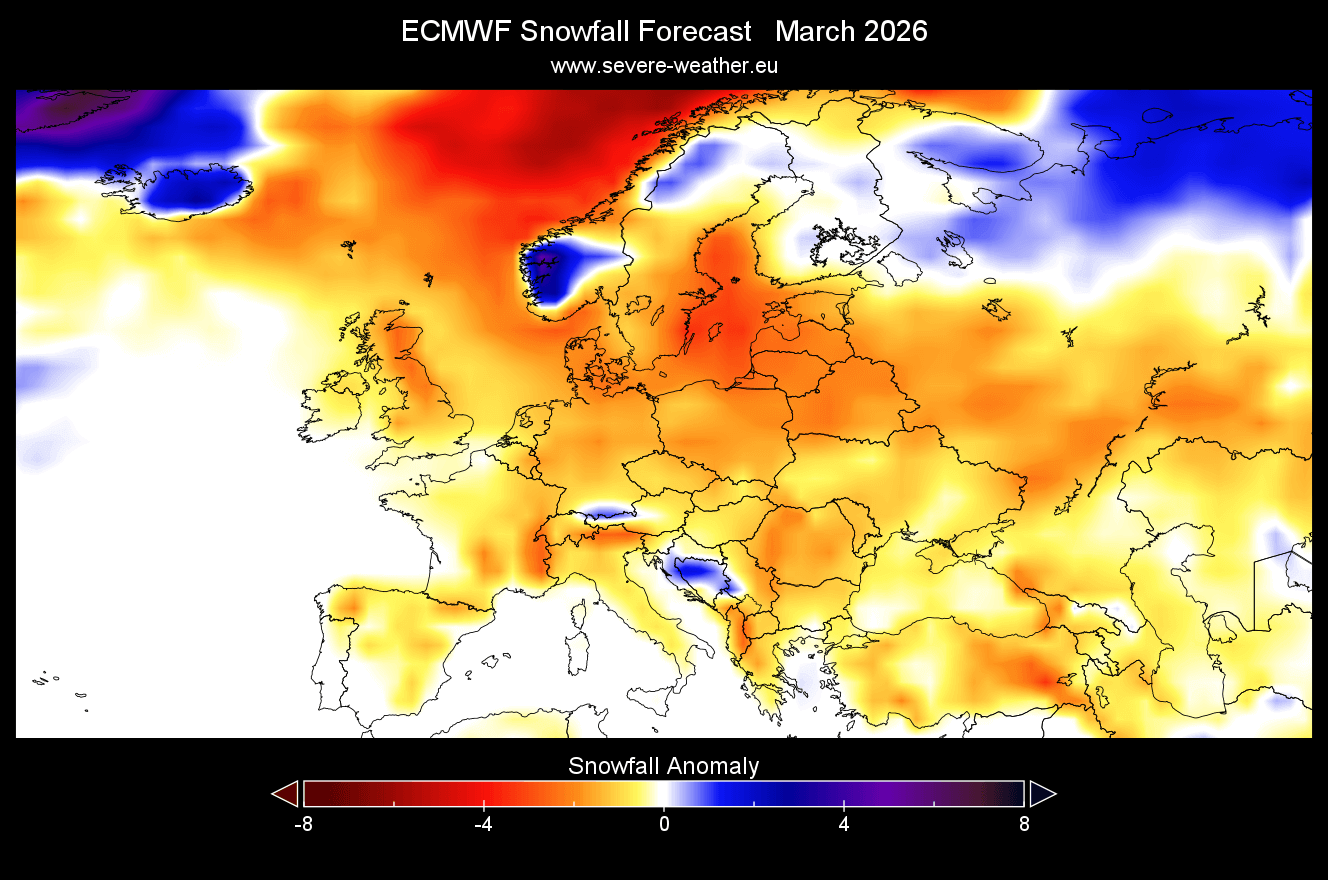
The March snowfall forecast covers early Spring and shows some potential for increased snowfall in parts of central Europe. But most of the other parts are forecast with less snowfall in the final Winter month.
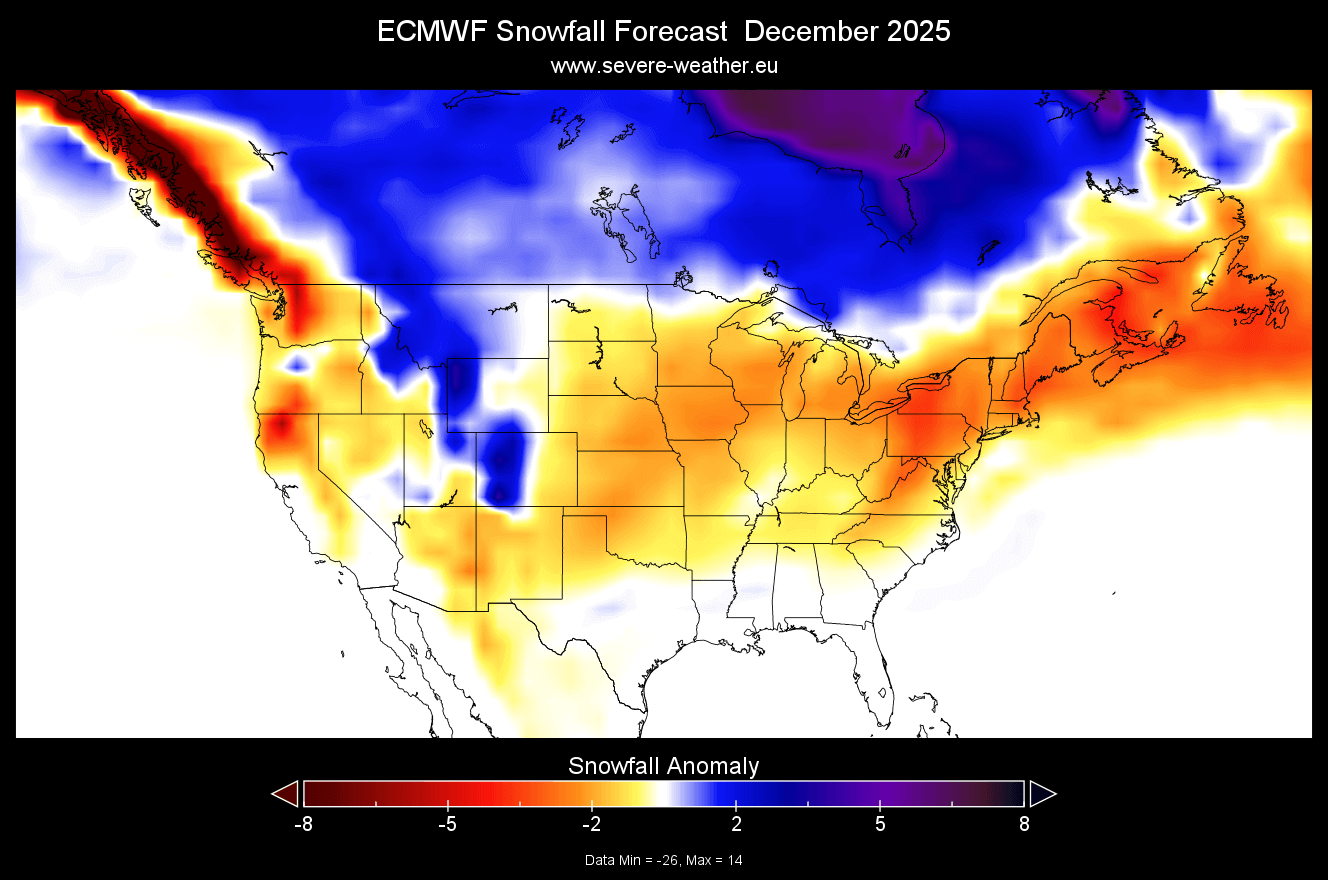
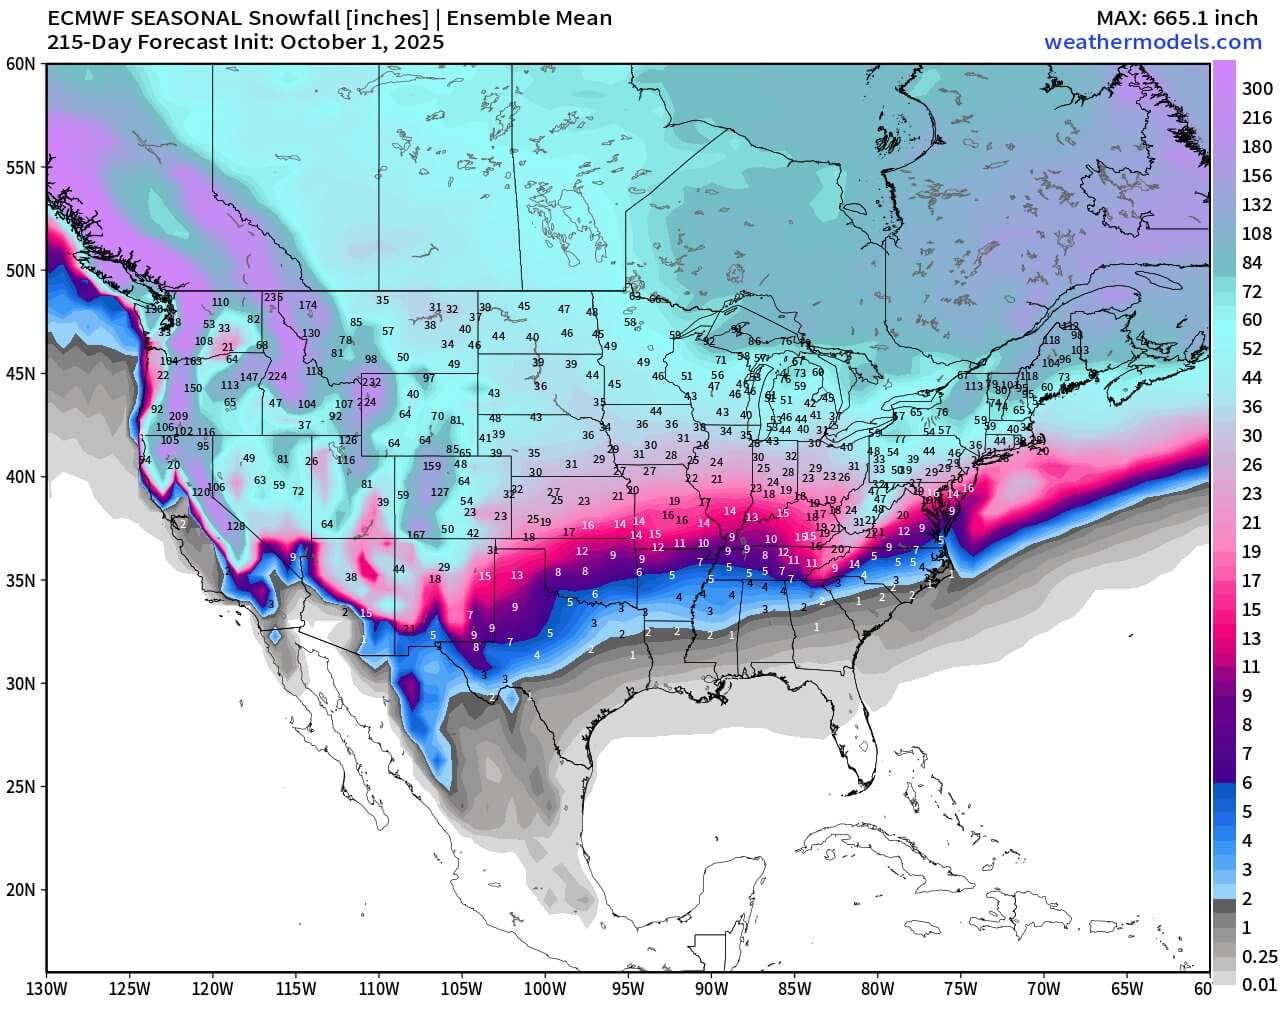
NORTH AMERICA ECMWF SNOWFALL PREDICTION
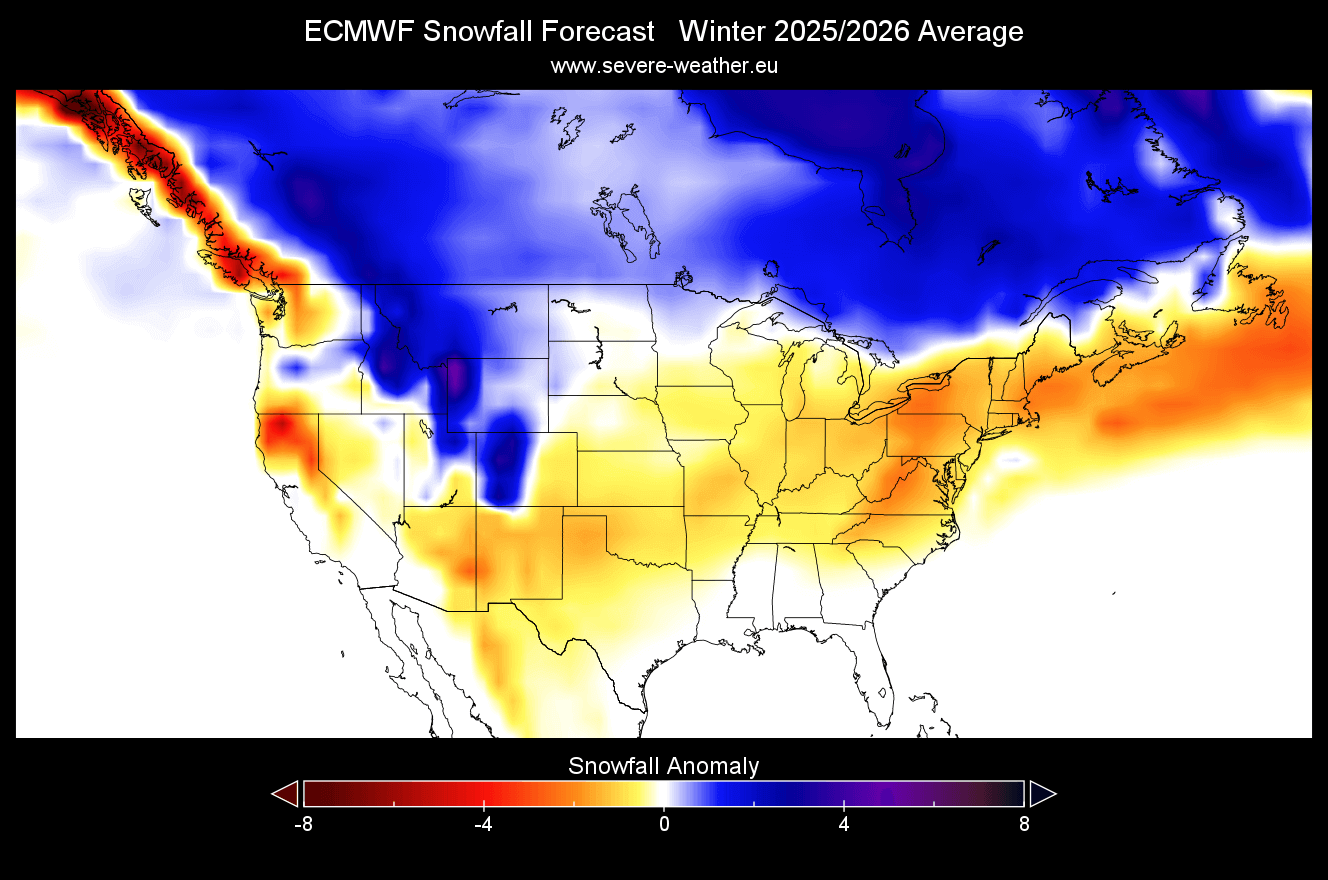
Over North America, we see most of the country having below-average snow depth over the entire Winter average. But the forecast does show more snowfall over the northwestern and northern United States and the entire southern half of Canada. But the negative snowfall anomaly is not that strong over the rest of the United States, showing less of a deficit than in recent years, which is a good sign.
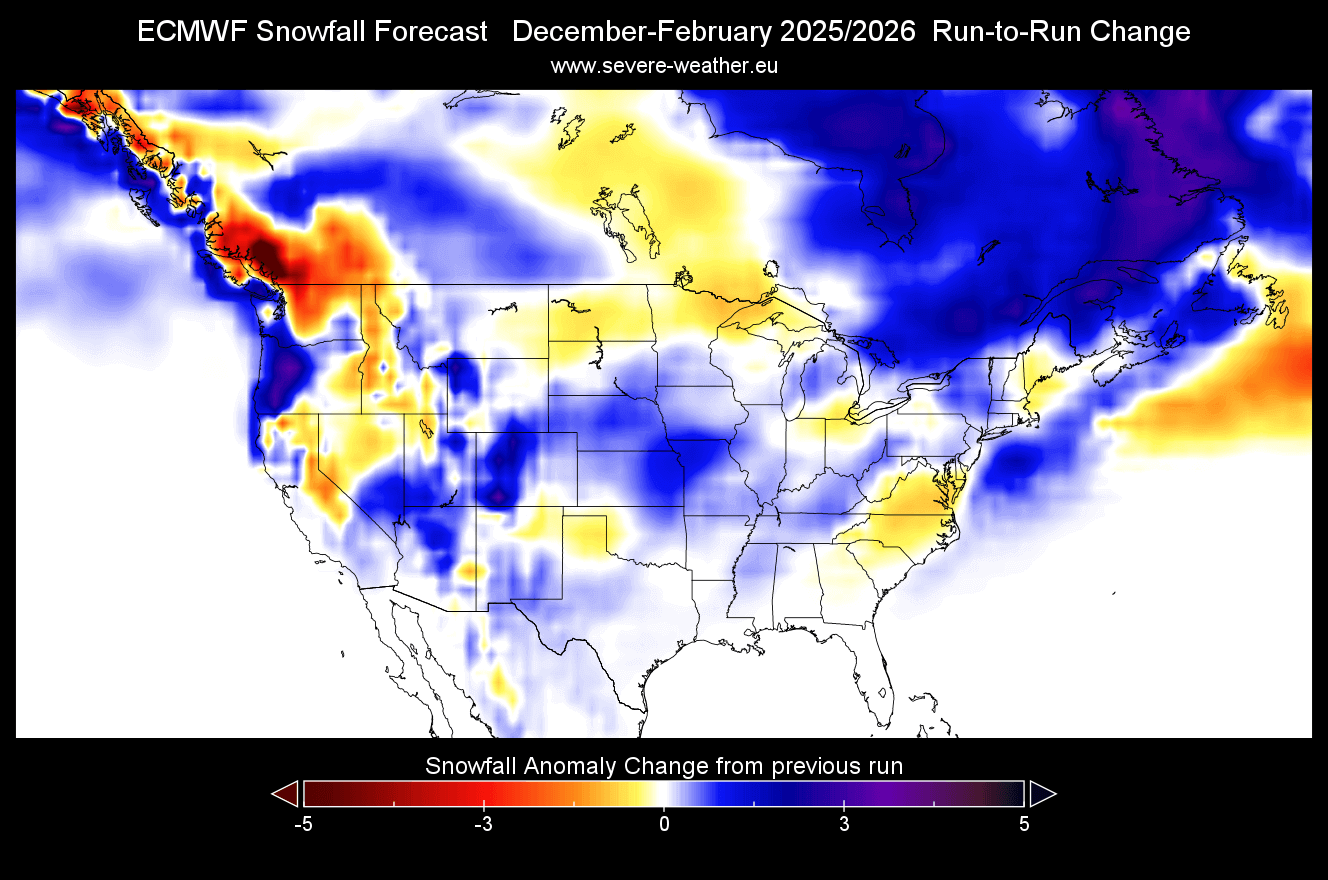
Looking at the snowfall change from the previous forecast data (September run), you can see a noticeable improvement. More snowfall is now forecast over much of the United States and eastern Canada, compared to the previous data. The exception is perhaps the upper Midwest, but you can see above that the total snowfall is still above-normal.
The December snowfall forecast shows less snow cover over most of the United States and southeastern Canada. We do see more snowfall over the higher elevations across the United States, and there is also a strong snowfall increase over the entire southern Canada.
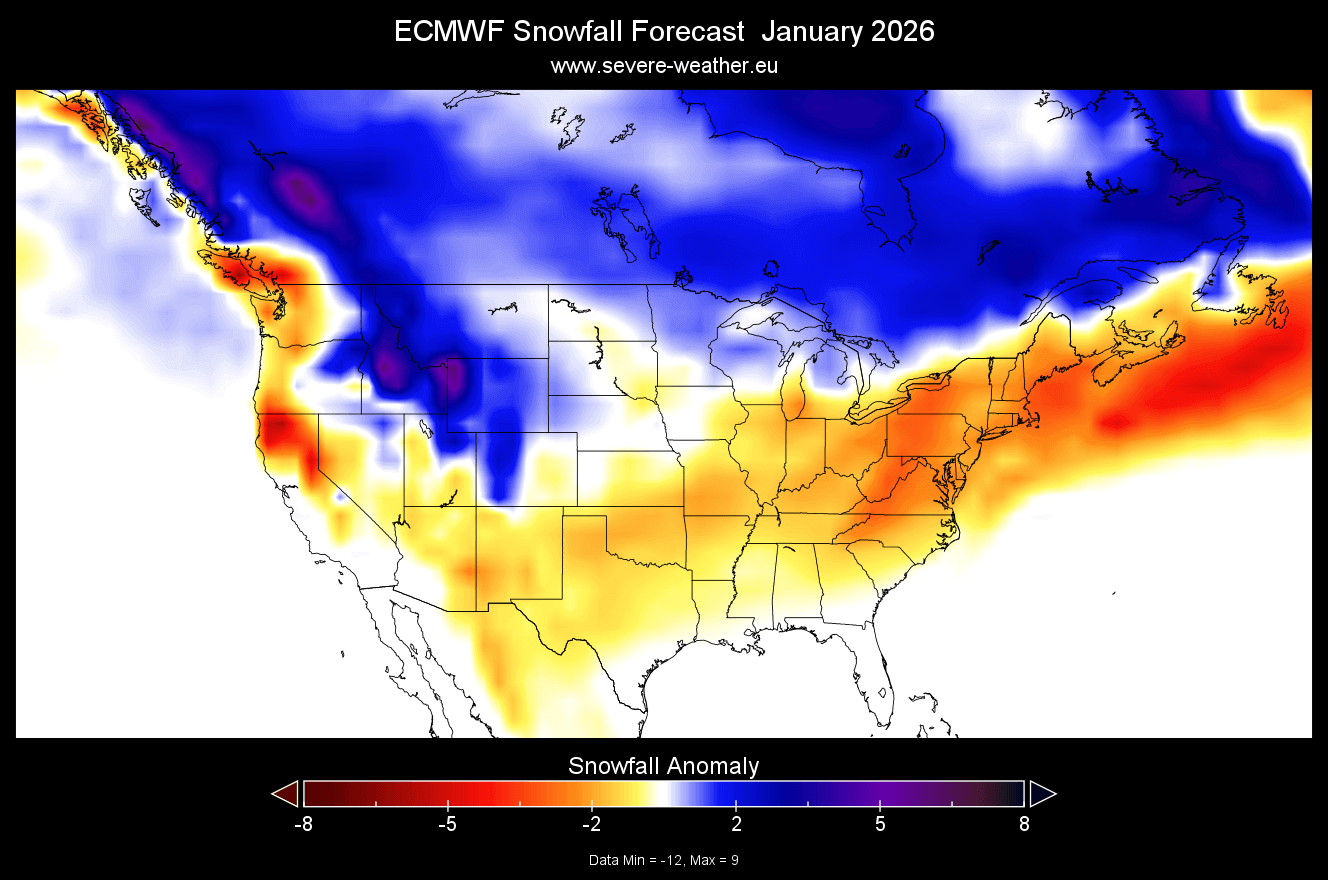
January snow forecast shows more snowfall expanding over from far western Canada into the northwestern United States, the upper Midwest, and southeastern Canada. There is still less snowfall over the lower Midwest and parts of the northeastern United States, which is surprising in a La Niña winter forecast. That is why we use more models to analyze the snowfall potential.
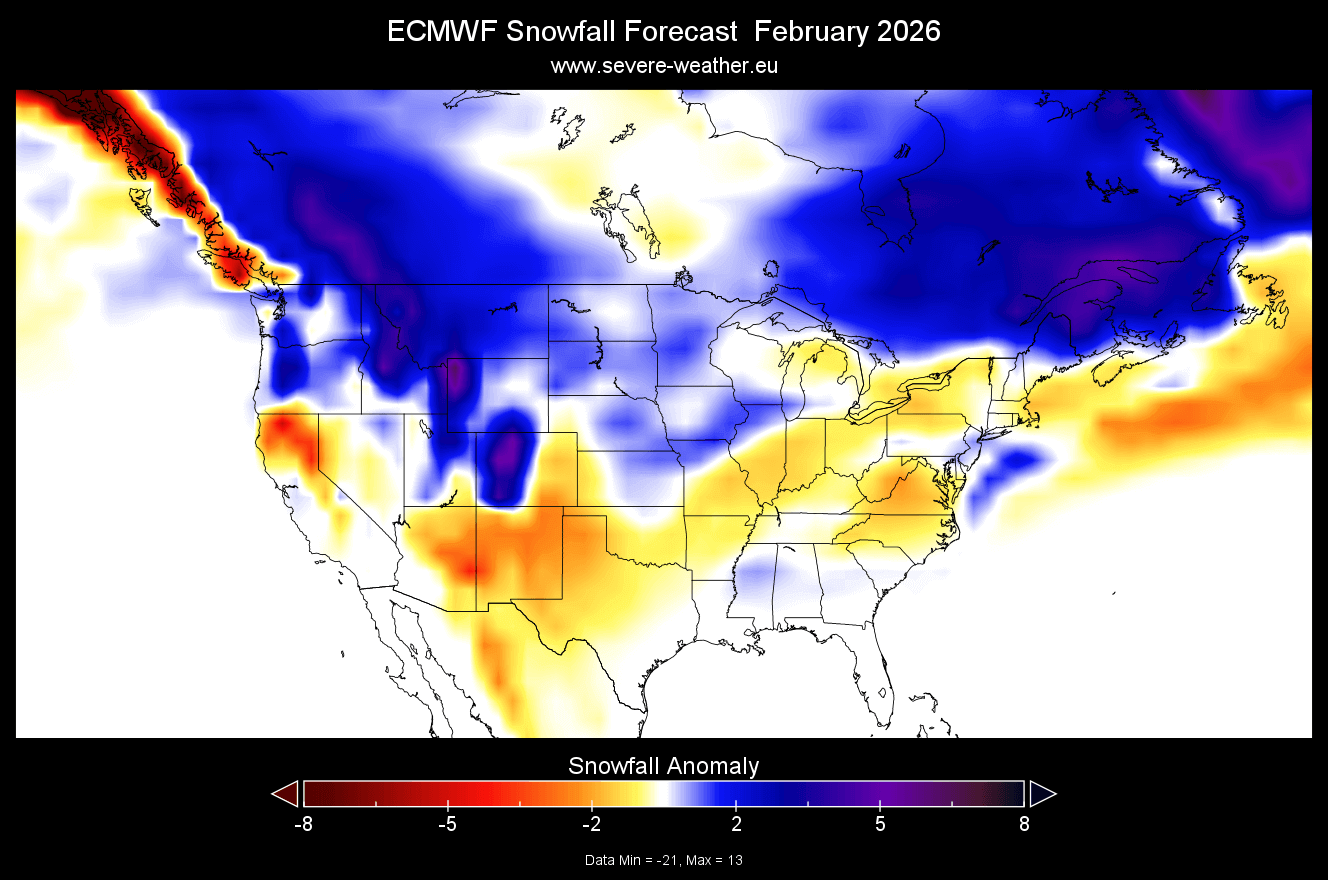
The February snowfall forecast shows greatly increased snowfall potential over the northwestern United States, the northern and central Plains, parts of the Midwest, and southeastern Canada. While there are some areas with less snowfall over the eastern and southwestern United States, the anomalies are not strong over the east with near-normal snowfall.
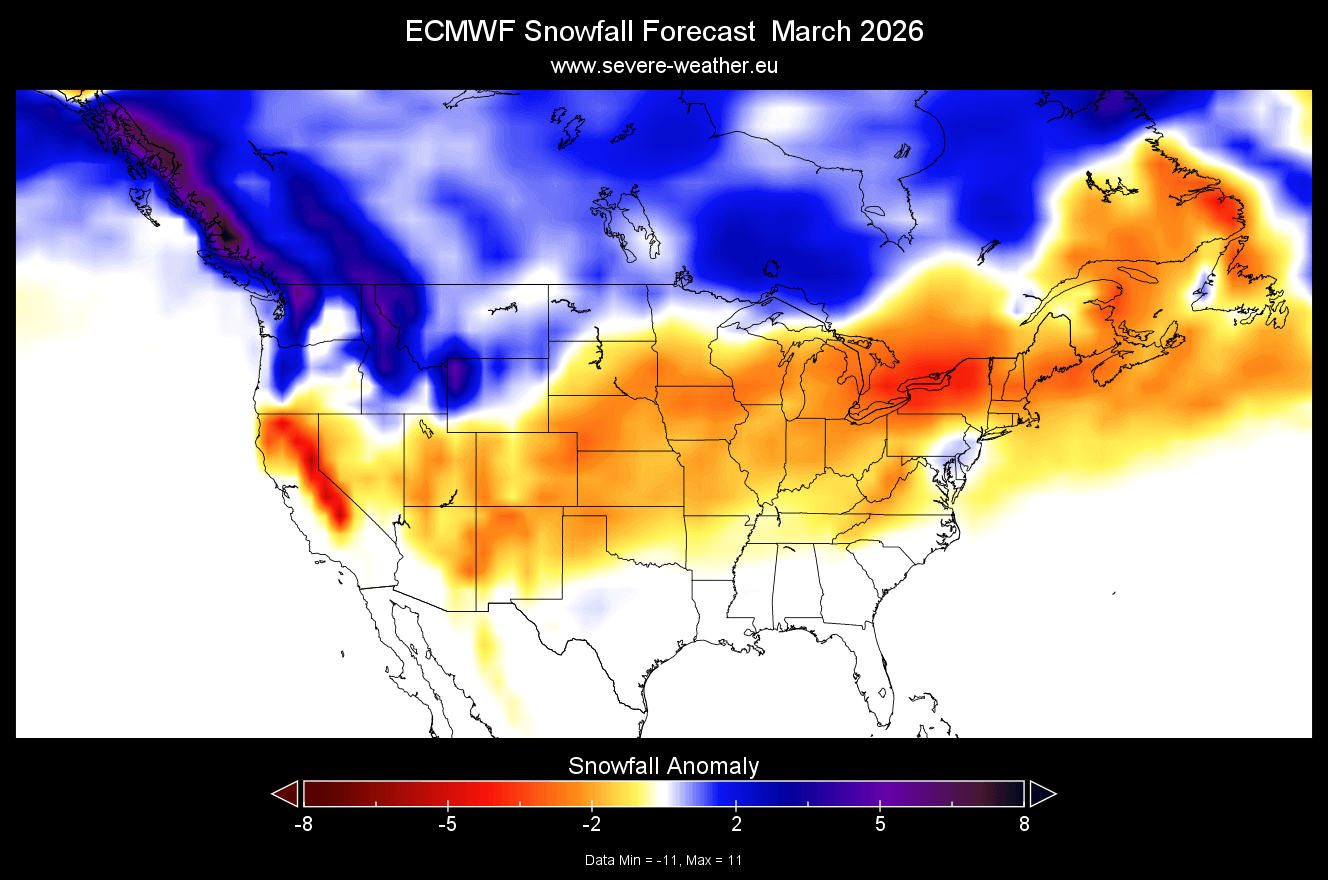
The March snowfall forecast shows the main snow area pulling back north again in early Spring. But while the snowfall is still above-normal over southern Canada and the northwestern United States, this keeps an increased cold air intrusion chance for the central and eastern United States.
But anomalies can only tell us so much. Below is the latest seasonal total snowfall forecast from ECMWF. It shows the total seasonal snowfall amount over the next six months and indicates an impressive snowfall amount and coverage for the coming season.
This clearly tells us that while some areas show below-normal snowfall, that does not mean no snowfall at all. It just means those areas are expected to see less snowfall than usual, while still having some snow on the ground during the whole season.
UKMO WINTER 2025/2026 SNOWFALL FORECAST UPDATE
Long-range weather forecasting is tricky, as there are a lot of factors that can impact seasonal weather. We are only looking at trends and probabilities, but still, the variation is key. The more forecast data you can look at, the better idea you can get about the weather expected. But sometimes, you can get even more confused.
And because you can never trust a single forecast model, we decided to always use the UKMO long-range forecasting system as our second go-to choice. It is developed by the United Kingdom Met Office, which is where the initials UKMO come from.
First, looking at the seasonal average for Europe, we can see another weak snowfall forecast, similar to the ECMWF. Most of the continent is forecast to have less snowfall than normal, except for far northern Europe. UKMO tends to be less optimistic about snowfall than the ECMWF above, at least in our experience from recent years.
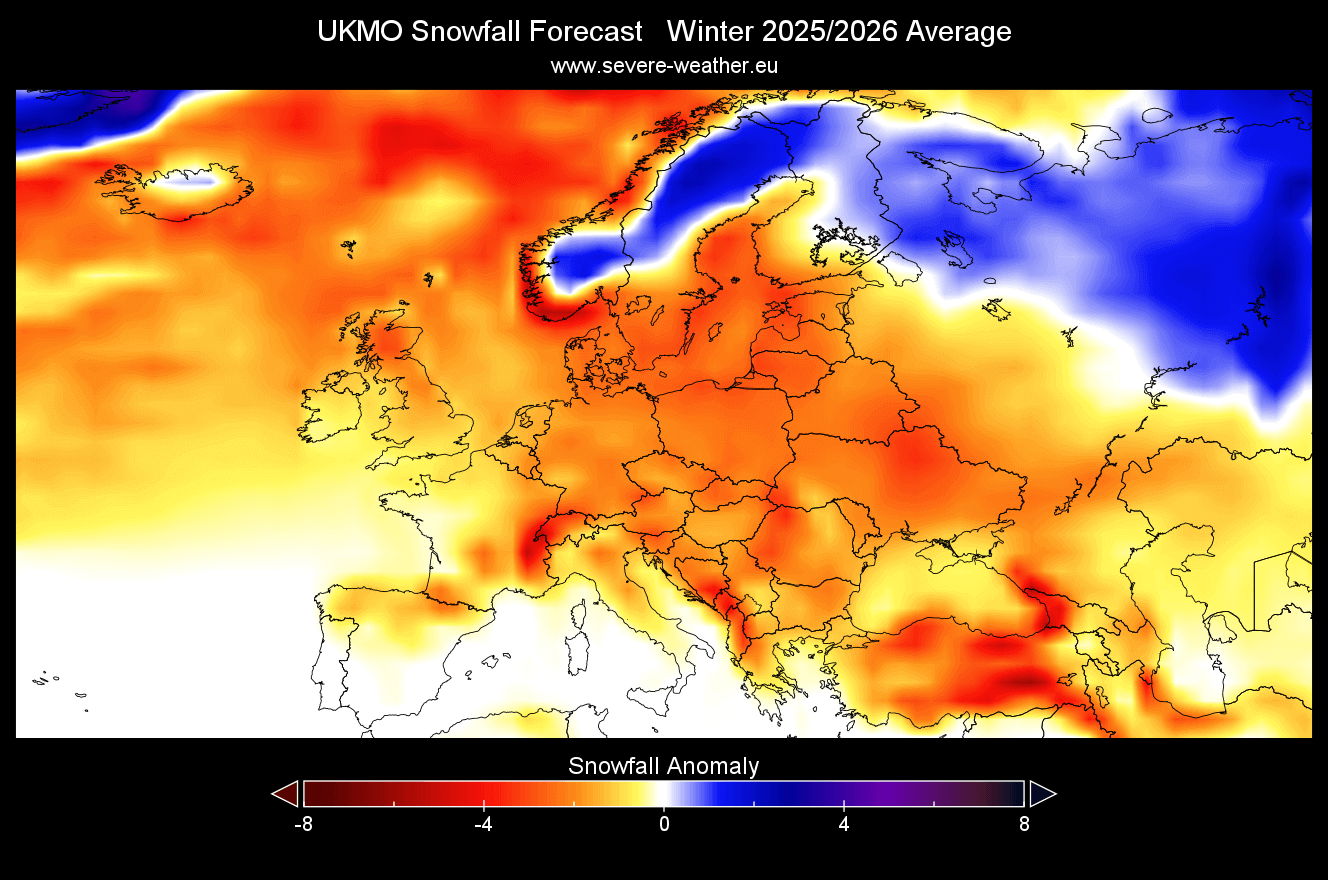
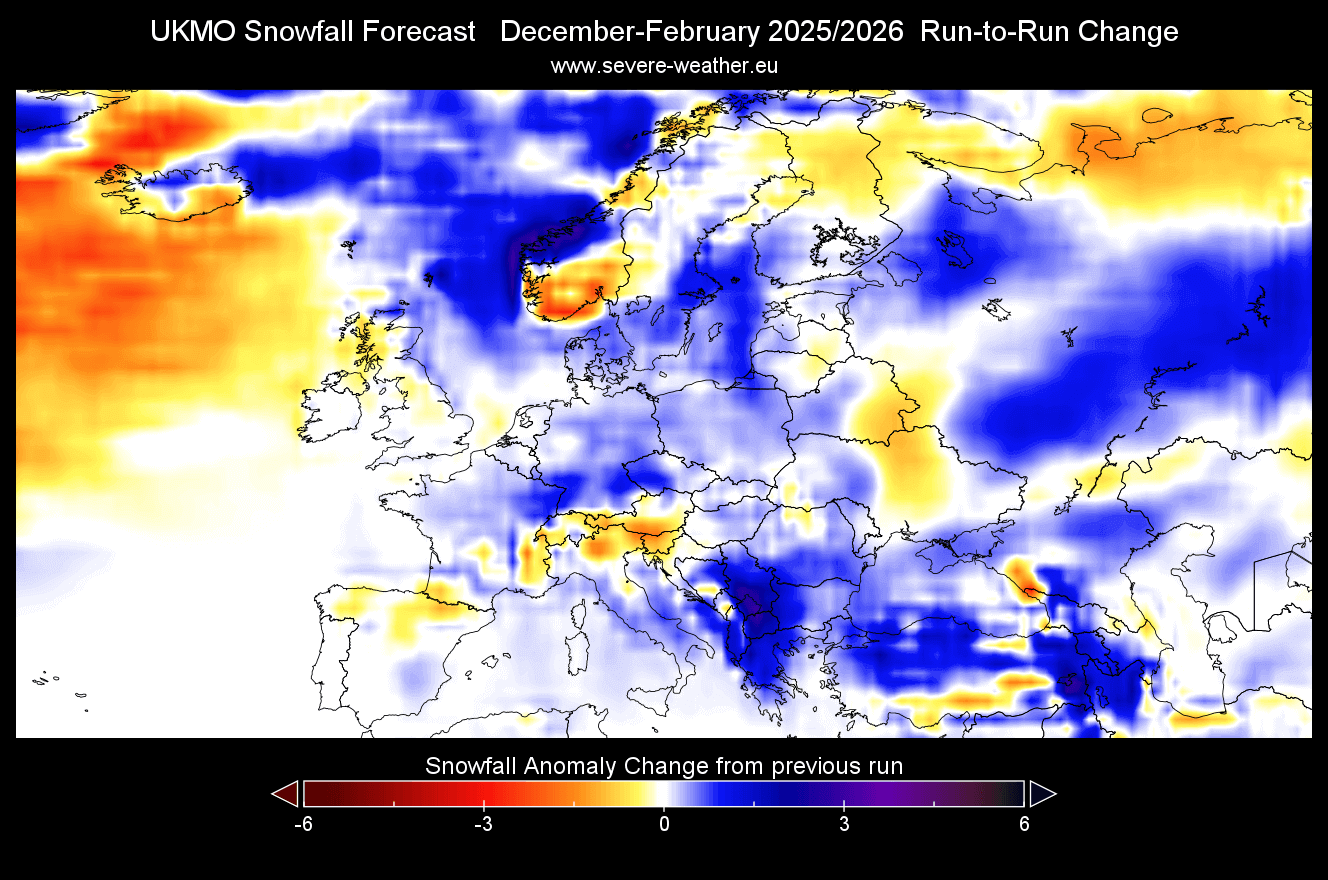
The latest run is a bit more generous with snowfall, as you can see in the image below. The latest run shows better snowfall compared to the forecast data from the previous month, over much of the continent.
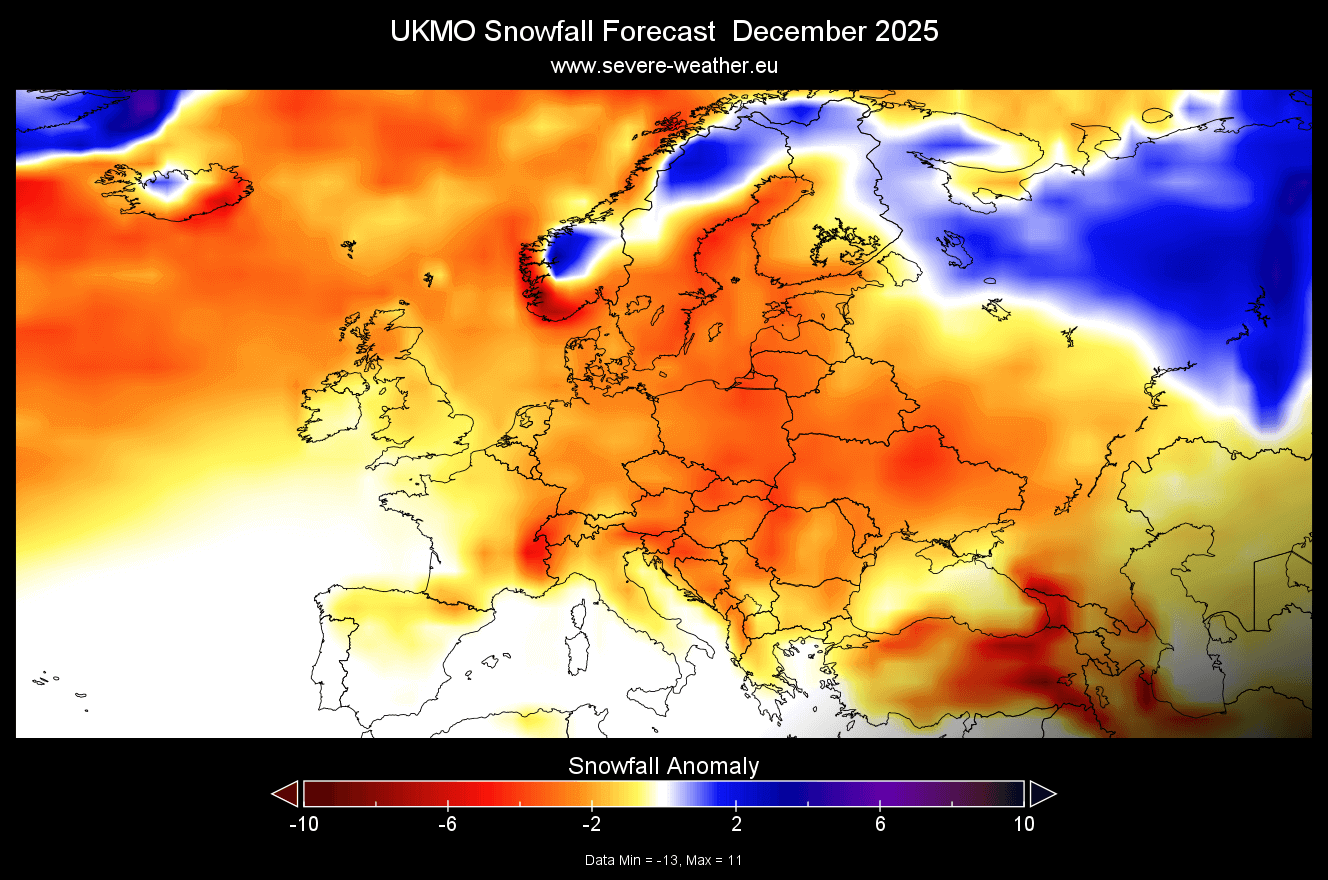
The December snowfall forecast shows stronger negative anomalies, just like the ECMWF. This agreement in both models gives more confidence for this scenario, with a slower start to the snowfall season.
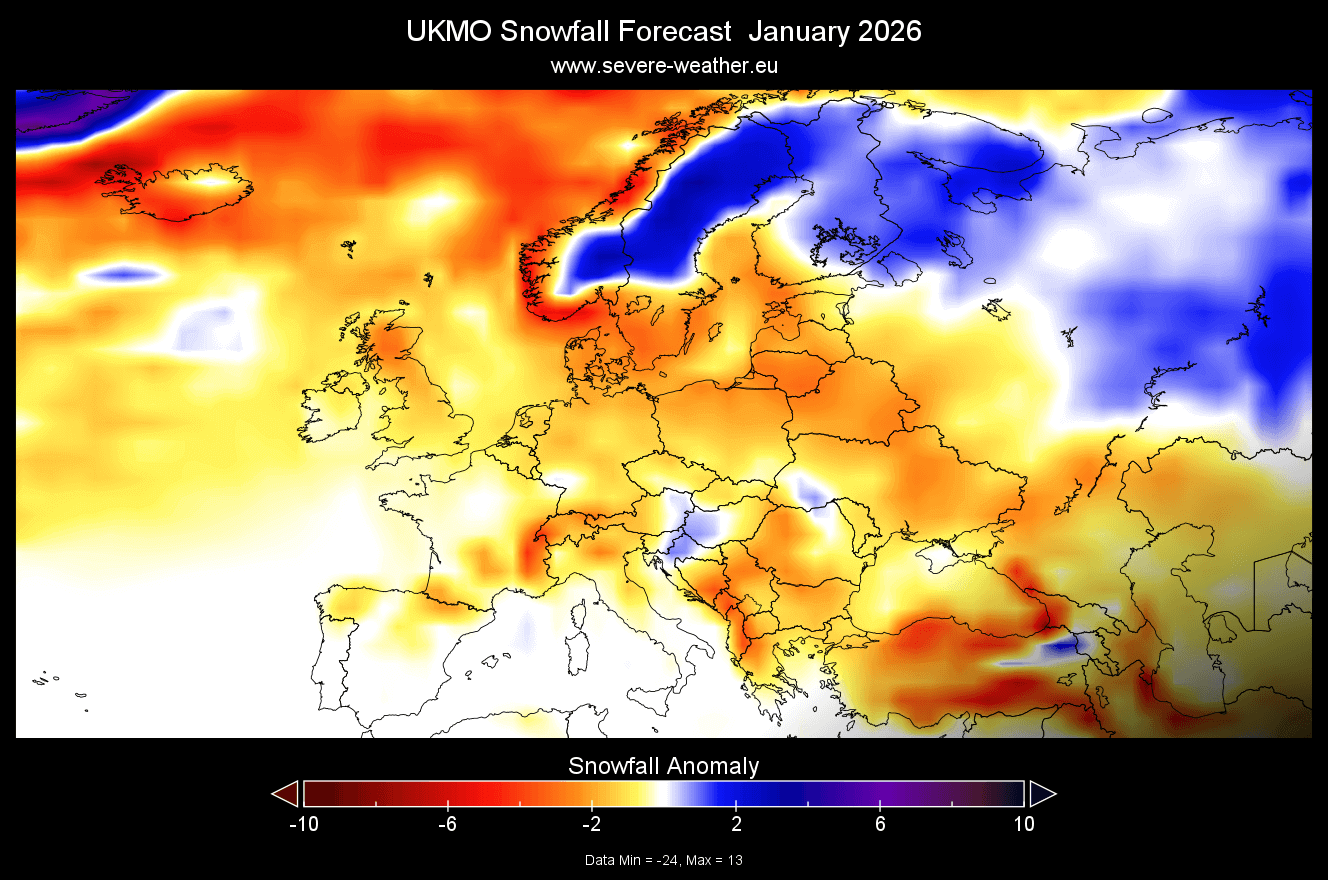
The January snowfall forecast shows more potential in some parts of central Europe, with even some above-normal areas. This shows that precipitation is available, but the temperatures are likely not cold enough for snow accumulation in the lowlands.
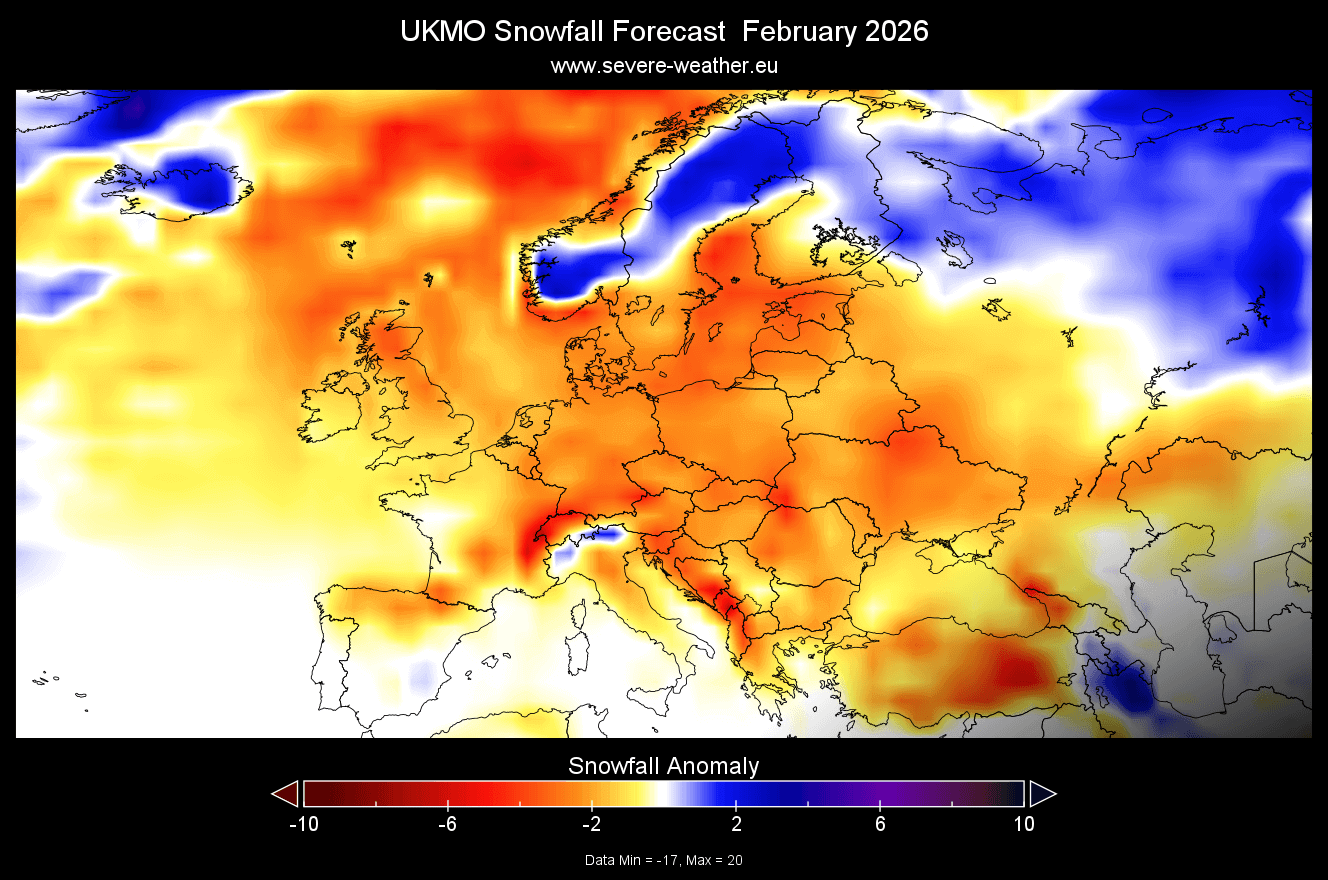
The February snowfall forecast again reduces snow potential over most of Europe, apart from the far northern parts. A small area of above-normal snowfall in the western sub-Alps indicates a more southerly flow over the continent.
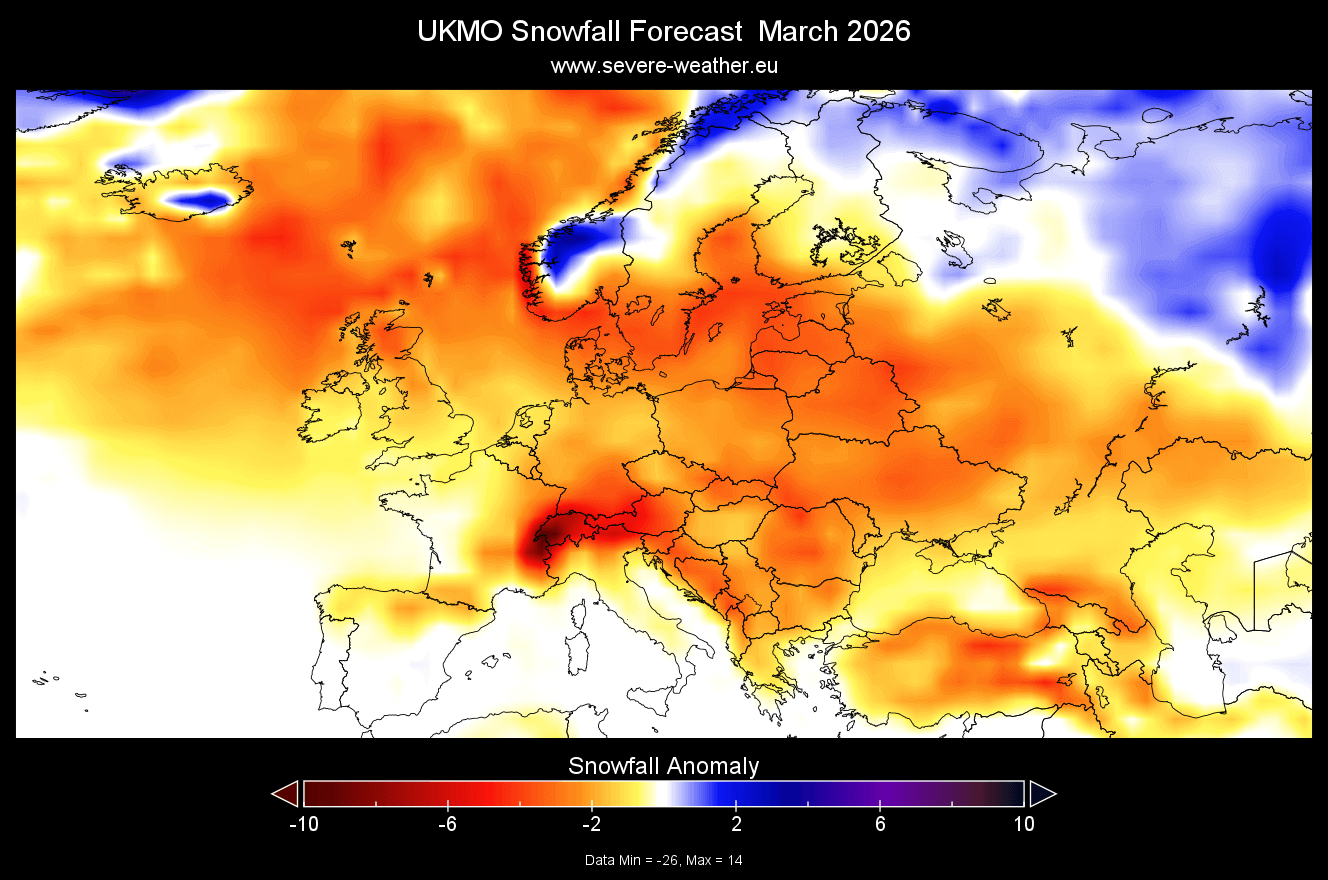
Looking at the March snow forecast, it shows strong negative anomalies, indicating a drier and warmer start to early Spring.
NORTH AMERICA UKMO SNOWFALL PREDICTION
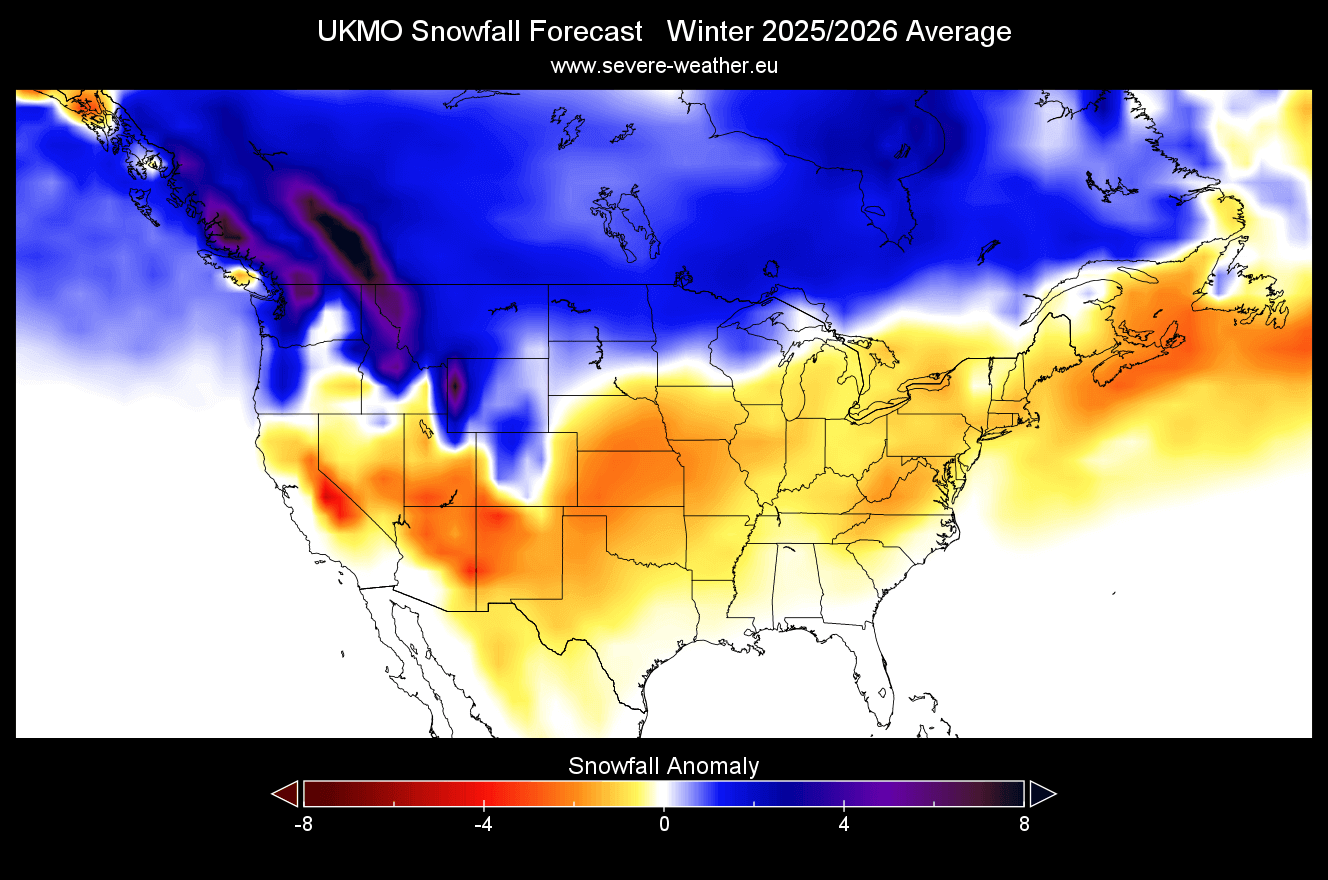
The average seasonal forecast for the United States and Canada shows a much more typical La Niña snowfall pattern. We see more snowfall forecast over the northwestern United States, the northern Plains, and the upper Midwest, and over most of southern Canada. Less snowfall is forecast over the central and southwestern United States, with lesser deficits over the lower Midwest and the eastern United States.
The UKMO also shows quite an improvement in snowfall amounts compared to the previous run. You can see more snowfall in the latest data over southern Canada, the northern U.S., and also in the southern states, the Midwest, and the eastern United States.
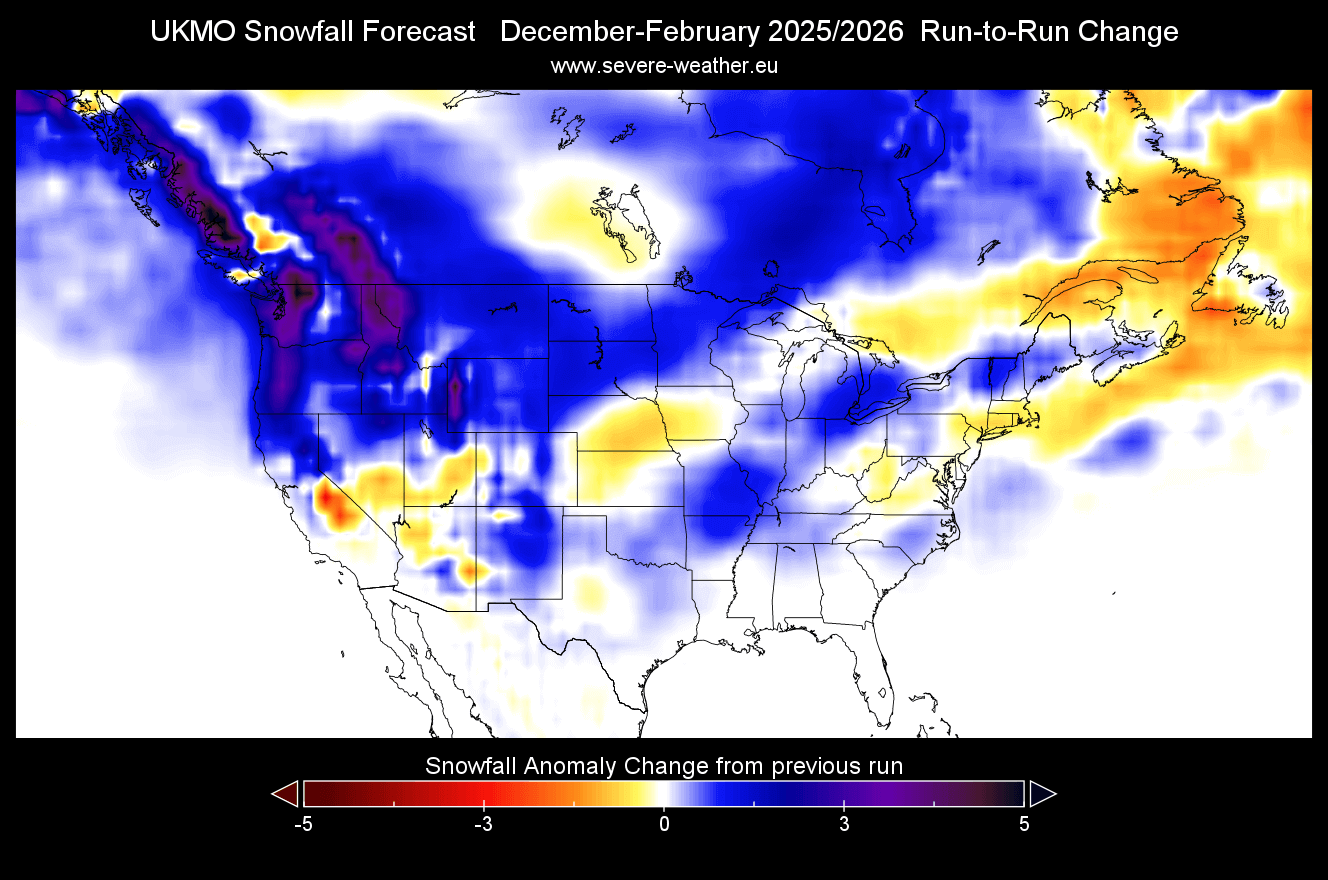
Less snowfall is seen in this model run over the far southeastern Canada and over the central Plains, but not by a large amount.
The December snowfall forecast already shows a snowfall increase, especially over the northwestern United States. More snowfall can also be seen in parts of the far northern Plains. The rest of the United States is forecast to receive less snowfall than normal this month.
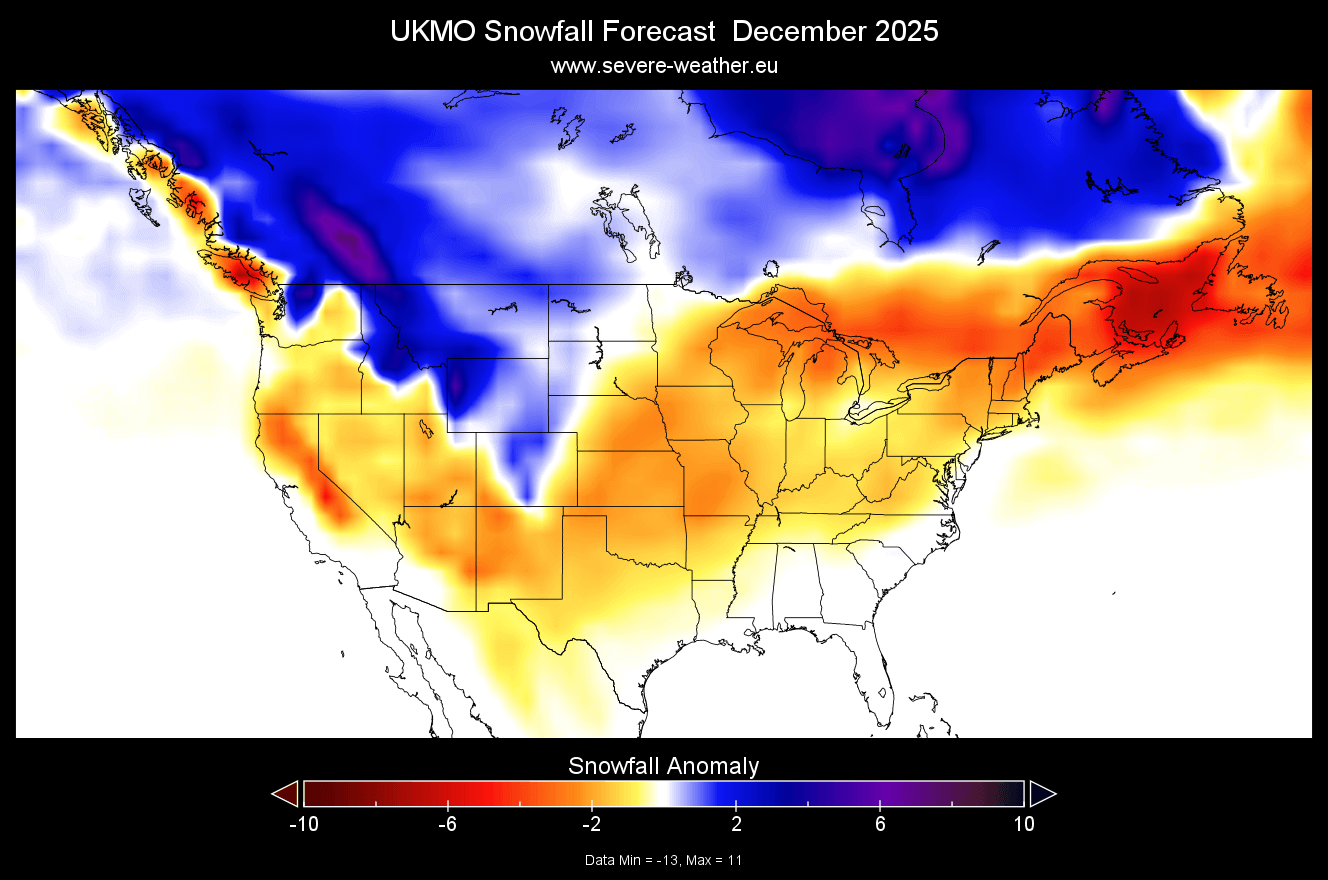
Canada, however, is forecast to have increased snowfall potential over much of the southern half, except for the southeastern parts. This is consistent with a weak/moderate La Niña active.
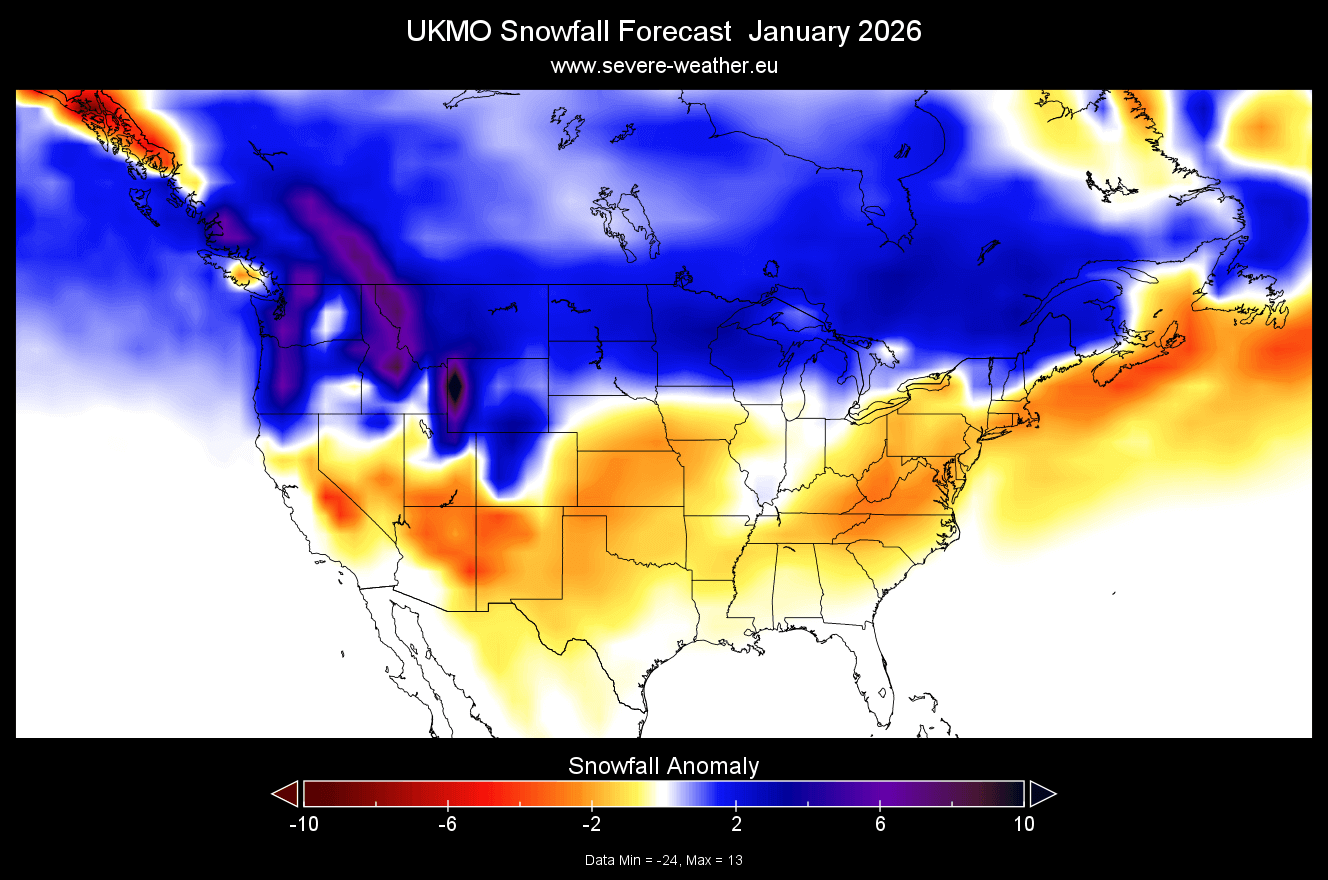
January snowfall forecast shows a stronger pattern, with more snowfall over much of southern Canada and the northern United States. This looks much closer to an expected snowfall pattern in a La Niña winter. The upper Midwest also shows more snowfall, and the Great Lakes area, while the southern half and the east are below normal
The February snowfall forecast shows an interesting picture, with above-normal snowfall over much of Canada and the northern parts of the United States. But you can now also see more snowfall starting to appear over the eastern United States, and with near-normal snowfall also along the east coast and over the northeastern United States.
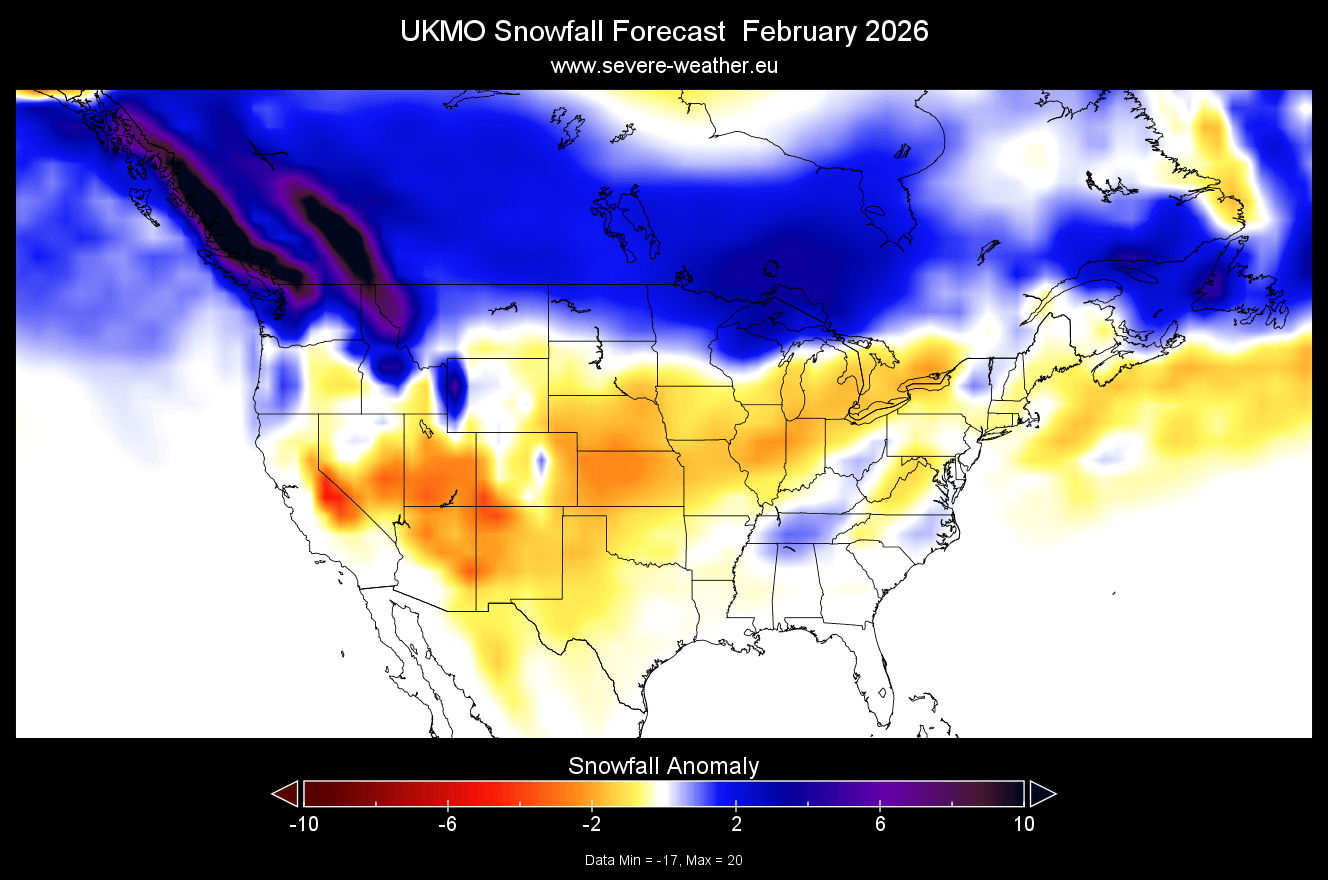
Overall, we don’t see strong deficits of snow across the United States, especially over the eastern United States. The main area with much below-normal snowfall is over the southwestern United States.
Looking at the March snowfall forecast, it shows continued snowfall potential over the northern United States and southern Canada in early Spring. The rest of the United States, apart from the southwest, also shows slightly reduced snowfall, but not too far from the normal amounts.
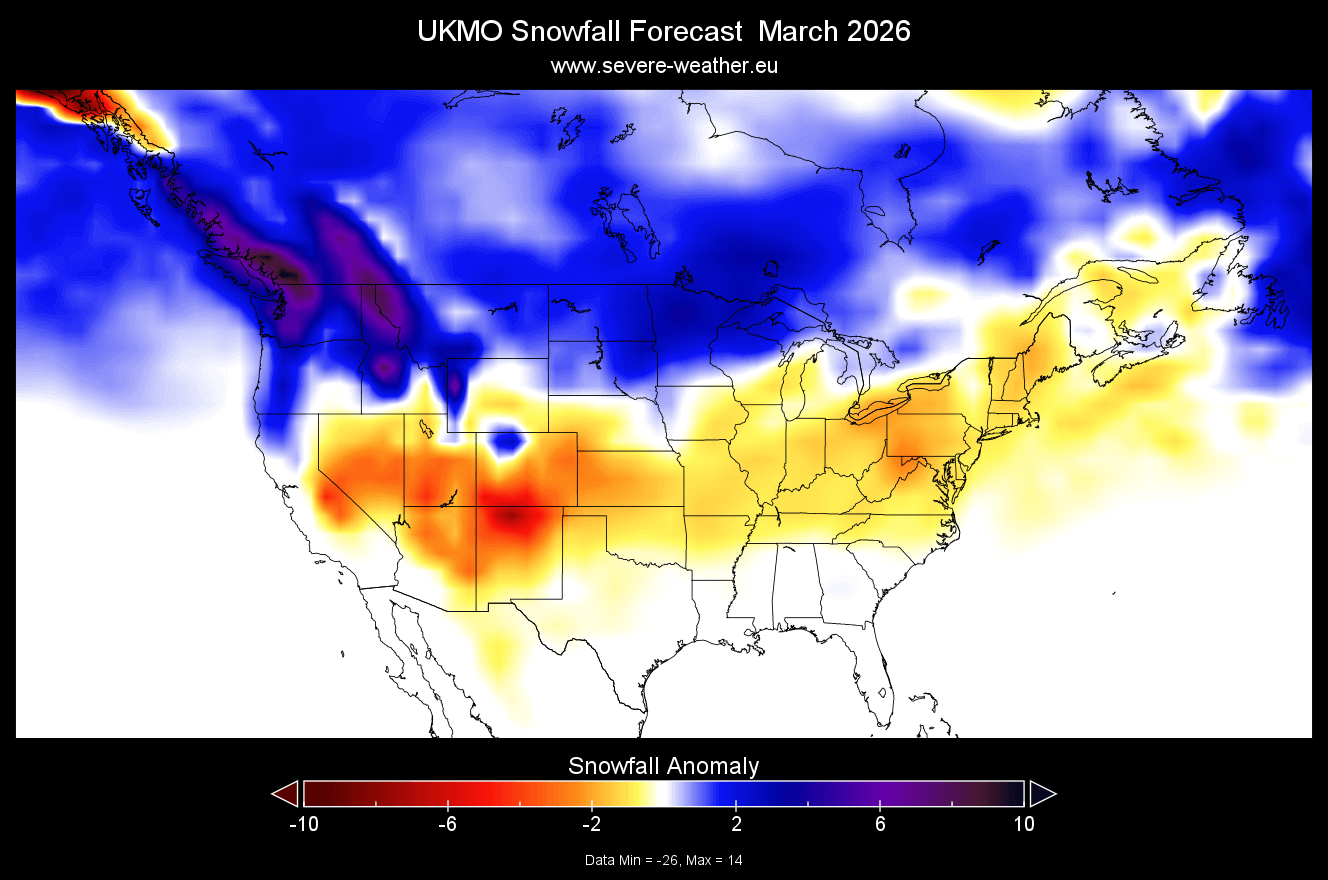
This shows good potential for an extended snowfall season, which would not be too unusual, coming off a La Niña winter.
OFFICIAL WINTER 2025/2026 FORECAST
We can also track snowfall potential on other temperature and precipitation Winter forecasts. The highest snowfall potential is usually found in regions with colder temperatures and more precipitation.
This can be seen in the NOAA’s official Winter 2025/2026 temperature forecast for the United States. It shows colder to equal temperature probabilities for most of the northern United States. The southern parts of the country and the northeast have a higher probability of warmer-than-normal weather.
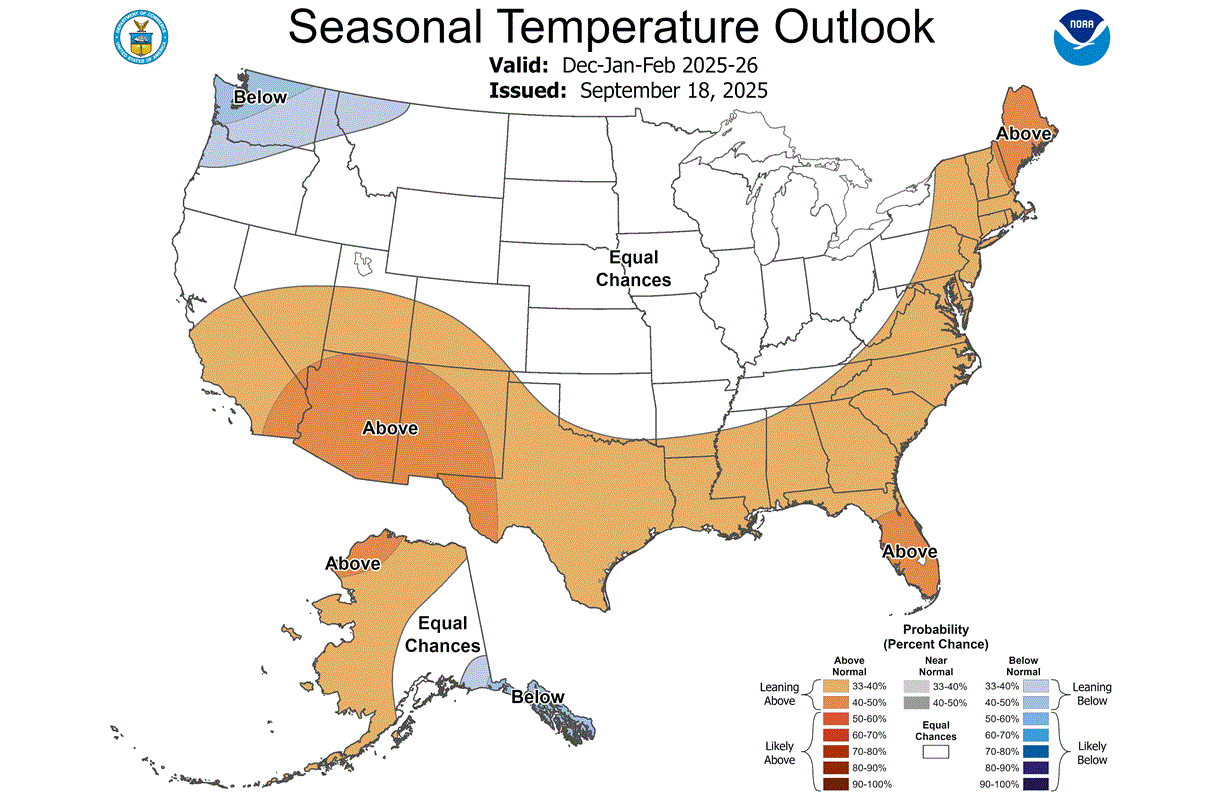
But take note of the trough of “average” temperatures probability extending across the Plains and into the Midwest. That can be interpreted as a potential route of winter cold air outbreaks and increased snowfall potential.
The official precipitation forecast shows a more typical La Niña effect. We see an equal-to-higher probability for more precipitation (and snowfall) over the northern half of the United States. The southern United States is forecast to have a drier winter season.
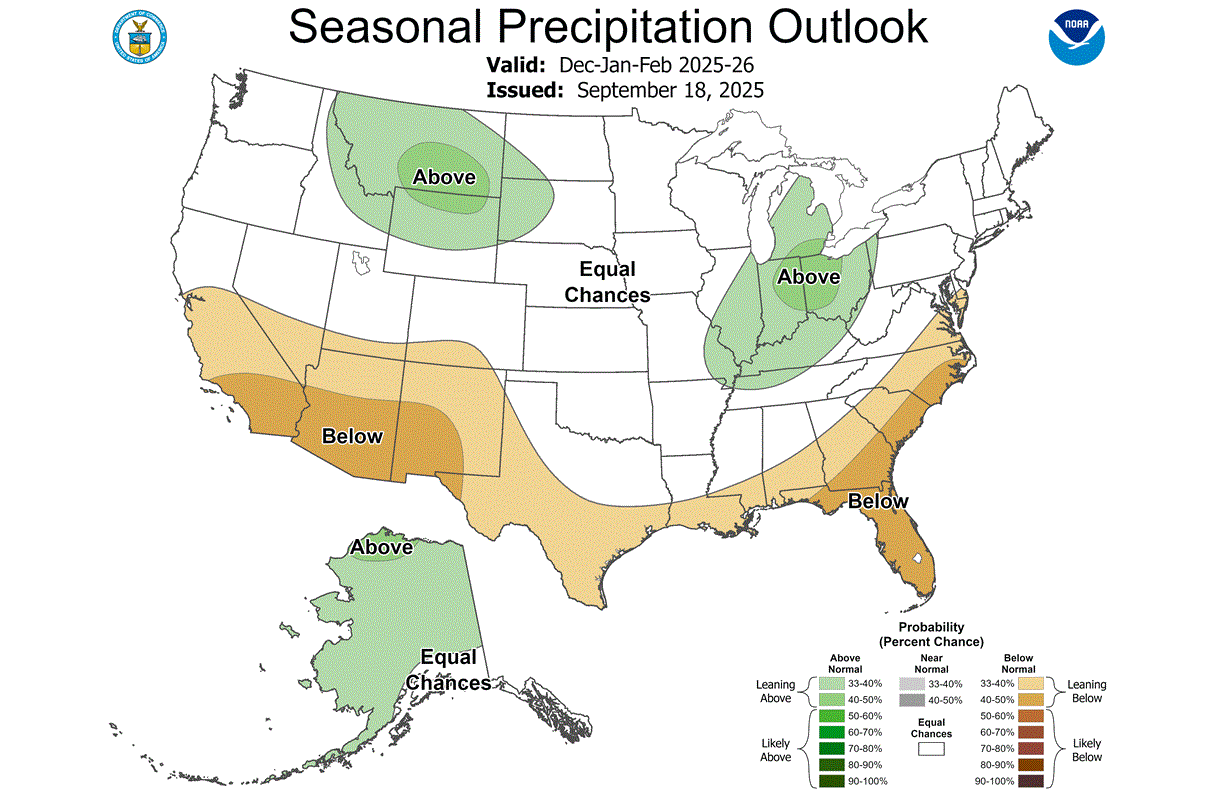
This hints at increased potential for strong lake-effect snowfall around the Great Lakes during a cold air outbreak. Especially since in a La Nina winter, the cold air is usually piling up not too far away in western Canada.
We will keep you updated on other developing weather trends, so don’t forget to bookmark our page. Also, if you have seen this article in the Google App (Discover) feed, click the like button (♥) there to see more of our forecasts and our latest articles on weather and nature in general.
Don’t miss:
Winter 2025/2026 Outlook: Global signals show a colder season ahead