Winter 2025/2026 is around the corner, and the latest forecast data shows cold and snow to start the season in December in the United States, Canada, and Europe. Long-range indications suggest the potential for cold events to persist into January, following a Stratospheric Warming event and the collapse of the Polar Vortex.
The global weather system has many large-scale and small-scale driving factors. The main factor this year will be a weak La Niña event in the Pacific, but a major disruption of the Polar Vortex will impact at least the first winter month.
In this article, we will look at two strong factors behind the upcoming Winter 2025/2026, how they work, and how they can bring us colder weather and snow. We will also look at the latest long-range forecasts and how the upcoming winter season is expected to develop across the United States, Canada, and Europe.
LA NINA WINTER EVENT
In the Pacific, we have the ENSO area, which stands for “El Niño Southern Oscillation.” This is an ocean region that periodically shifts between warm and cold phases. Typically, there is a phase change around every 1-3 years.
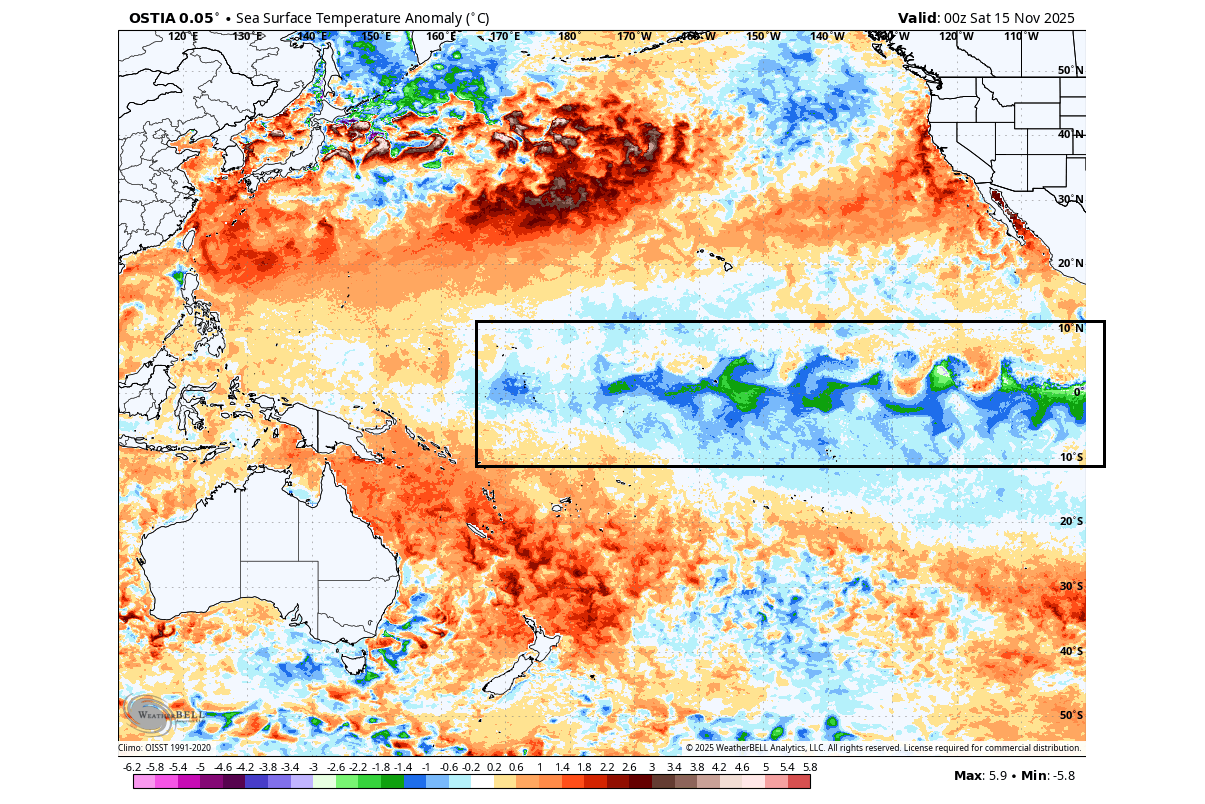
Below is the latest ocean temperature anomaly by the OSTIA dataset, and you can see a wave of cold anomalies in the ENSO area. You can see that a cold phase (La Niña) is currently active, and is in the weak to moderate strength range for now.
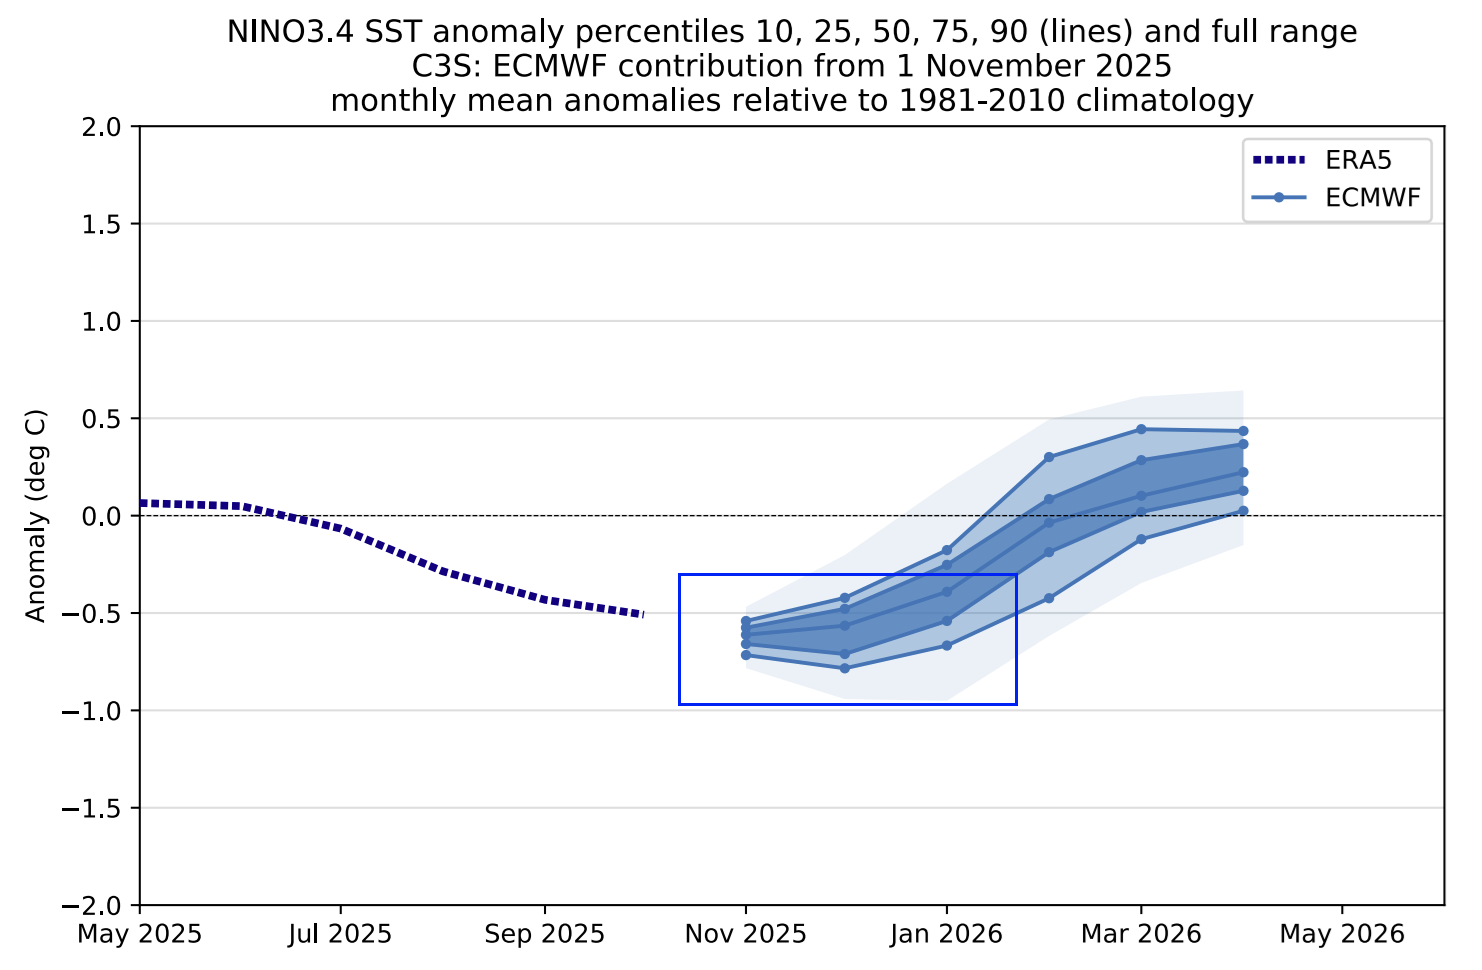
The long-range ensemble forecast below shows the forecast for the main ENSO region. The average forecast from all the calculations is within the cold phase area, with a high number of calculations well within the La Niña margin. This tells us that this La Niña event will impact the 2025/2026 winter and will fade before spring arrives.
La Niña has a specific impact on winter weather. We usually see a strong blocking high-pressure system in the North Pacific, and a low-pressure area over Canada. This redirects the polar jet stream down into the northern U.S., allowing cold spills also into the central and eastern United States.
Below you can see the temperature analysis for the past weak La Niña winters. What stands out is the cold anomaly area under the jet stream in western Canada and the northwestern United States. A colder area extends over the Midwest and down into the south-central plains and to the east. Europe also shows a colder trend over the north-central parts.
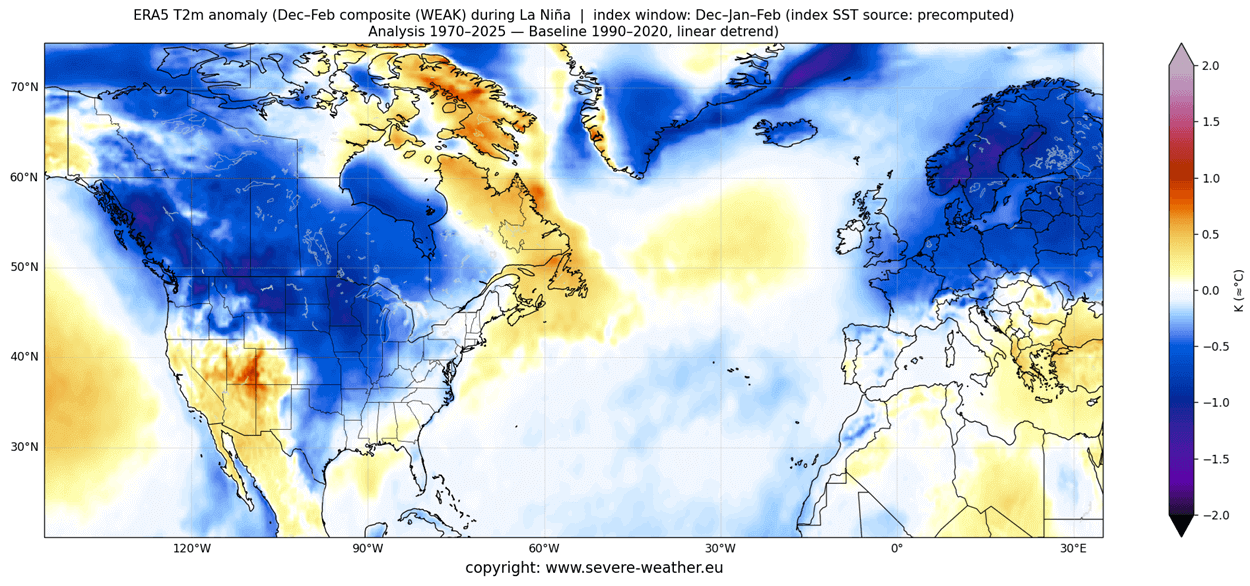
Warmer-than-normal weather and mild winter conditions typically develop over the southwestern United States, parts of the eastern United States, and eastern Canada. This image also includes some older winters, so it tends to look colder than some of the more recent La Niña winters.
So, as the colder air is more easily accessible to the northern United States, this also increases the snowfall potential when enough moisture is available. In the graphic below by NOAA-Climate, you can see the average snowfall pattern for La Niña years, as expected for this Winter season.
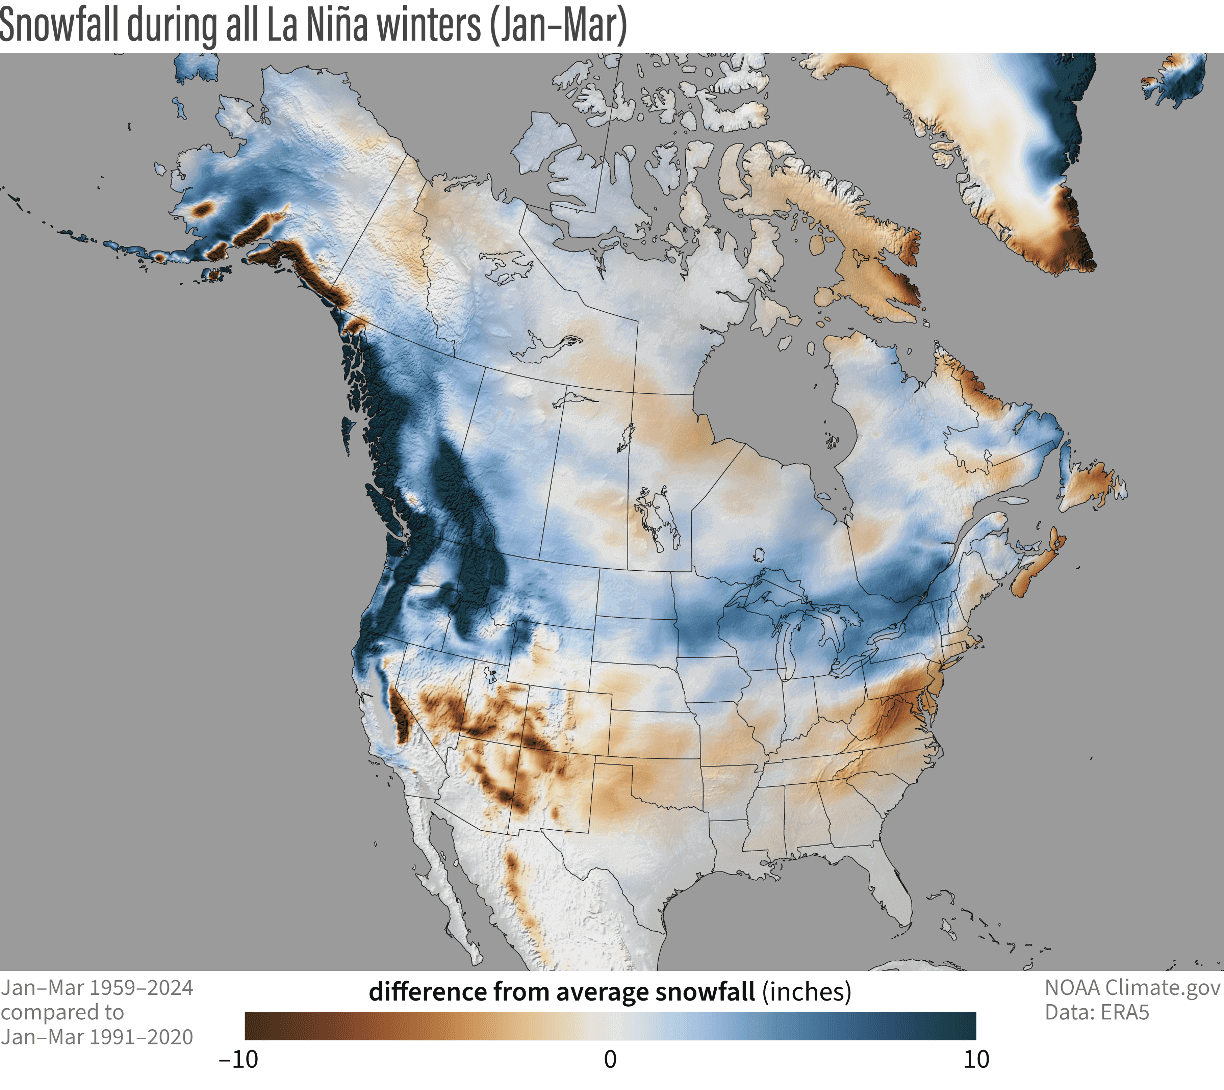
Besides the northwestern United States and the Midwest, you can also see more snowfall potential over parts of the northeastern United States and southeastern Canada.
The second strong factor for the upcoming Winter season is located much higher up, in the stratosphere.
THE POLAR VORTEX COLLAPSE
To understand what the Polar Vortex is and how it works in a simple way, you don’t need to be an expert.
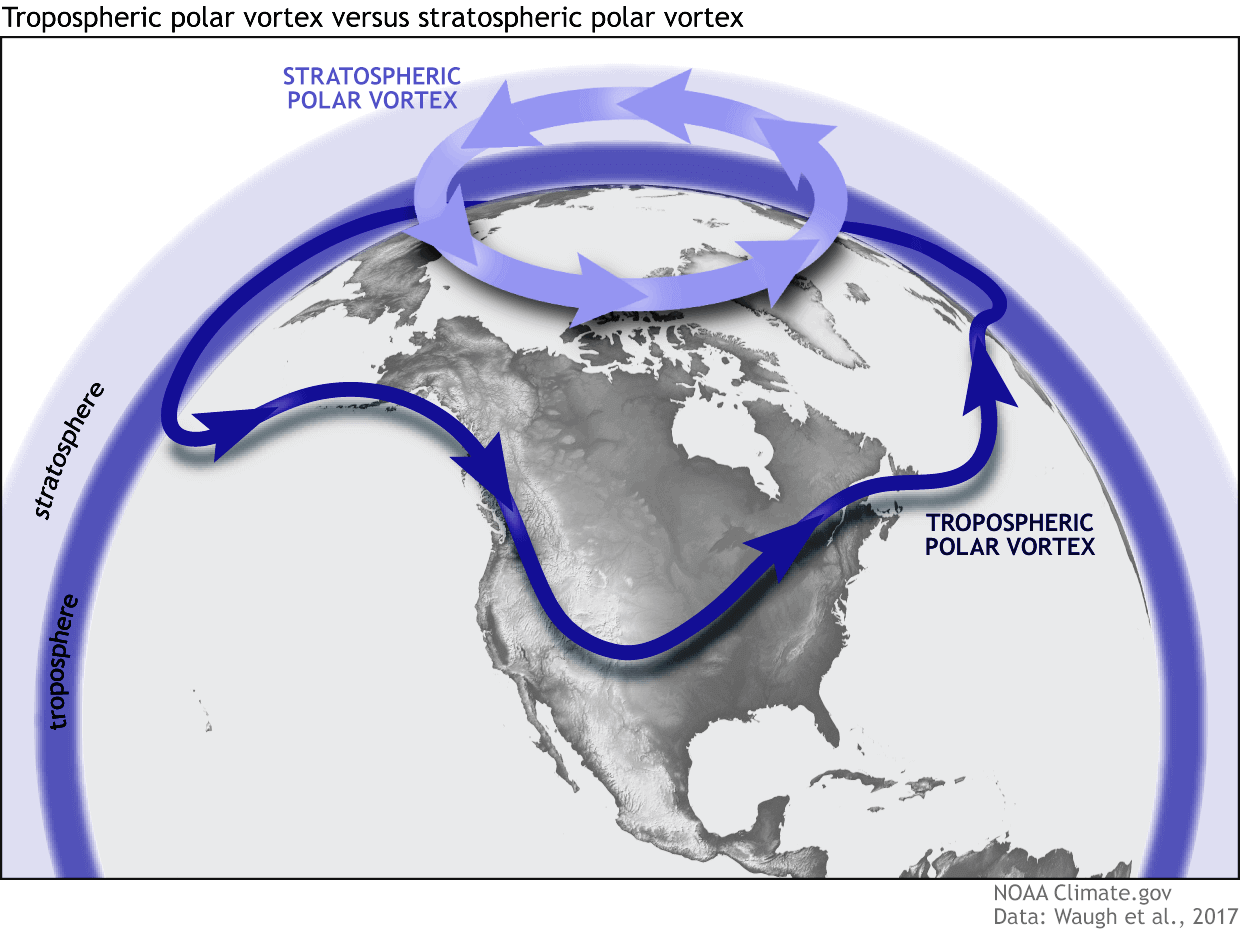
You can simply imagine the Polar Vortex as a “wall” spinning over and around the polar regions from the surface to the stratosphere (over 50km/30miles high), containing the cold polar air inside.
For this reason, we separate the entire Polar Vortex into an upper (stratospheric) and a lower (tropospheric) part. They both play their role differently, so we monitor them separately. But both parts together form the whole winter circulation and shape our daily weather at the surface.
We have to closely monitor the strength, shape, and size of the Polar Vortex because if it gets unstable, it can have a great impact on the weather below.
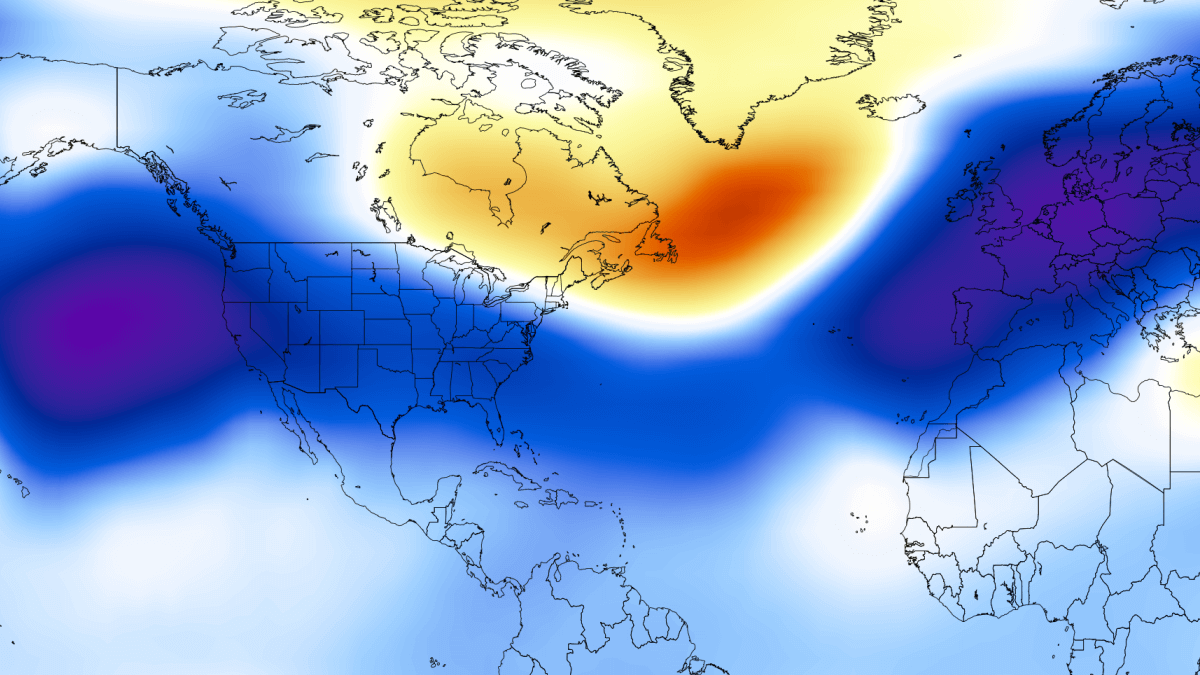
When the Polar Vortex gets disrupted or even fully collapses, it has a much harder time containing the cold air, which can now easily escape from the polar regions into the United States or other mid-latitude regions. Below is an example of how a disrupted Polar Vortex helps to release the cold polar air into the United States and Europe. Both images are by NOAA-Climate.
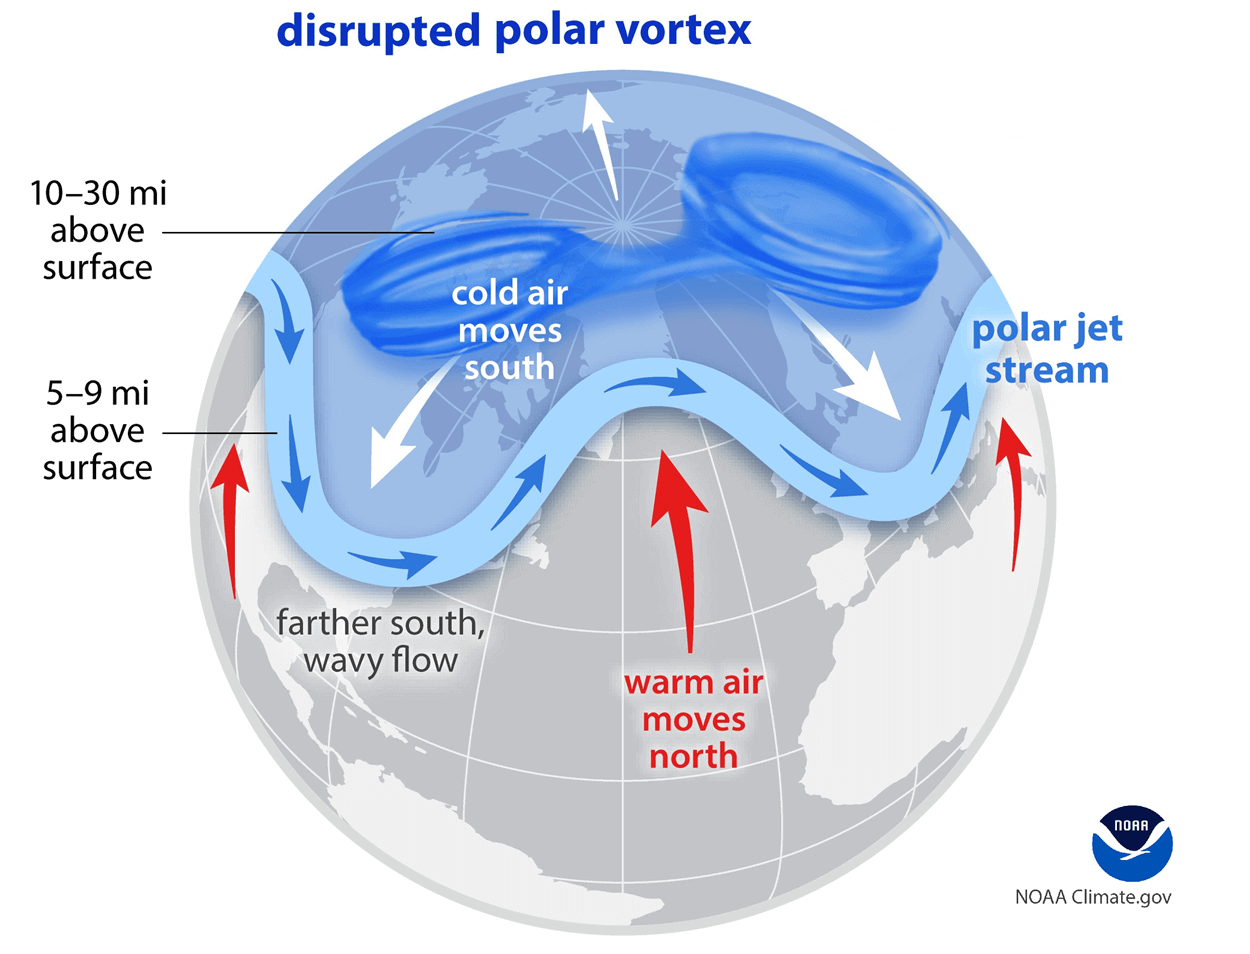
If you want proper Winter weather with cold and snow, a weak/disrupted Polar Vortex is exactly what you want to see.
For the best presentation of what the Polar Vortex is, we produced a high-resolution video below. It shows the Polar Vortex in true 3D, giving you the best possible idea of what it actually looks like if you were ever able to see it. Video shows the latest Polar Vortex forecast and the start of its disruption.
The main takeaway from the video should be that the Polar Vortex is a single large circulation, connected throughout the atmosphere.
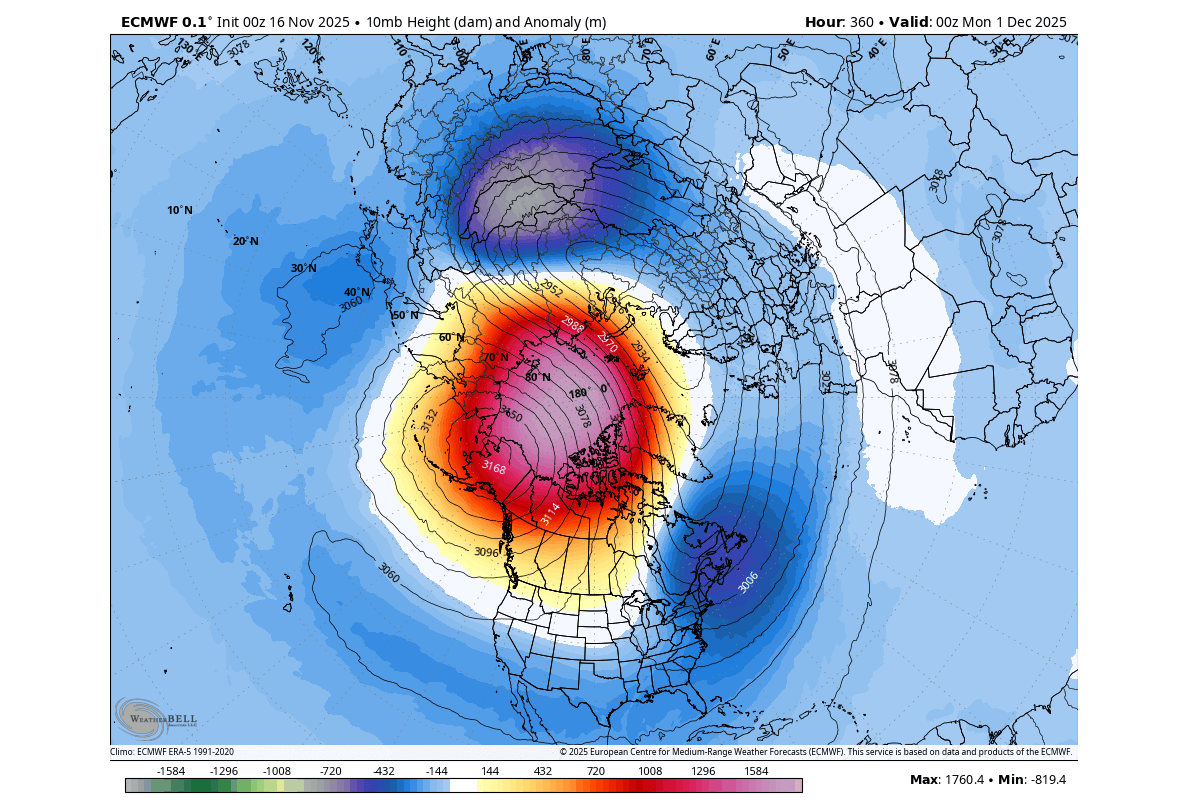
The latest forecasts show a Sudden Stratospheric Warming event (SSW) later this month, around Thanksgiving. In the image below, we have the pressure and temperature for the mid-stratosphere at the 10mb level (30km/18.5miles height). You can see the two main pressure systems and a warming wave around the Polar Vortex.
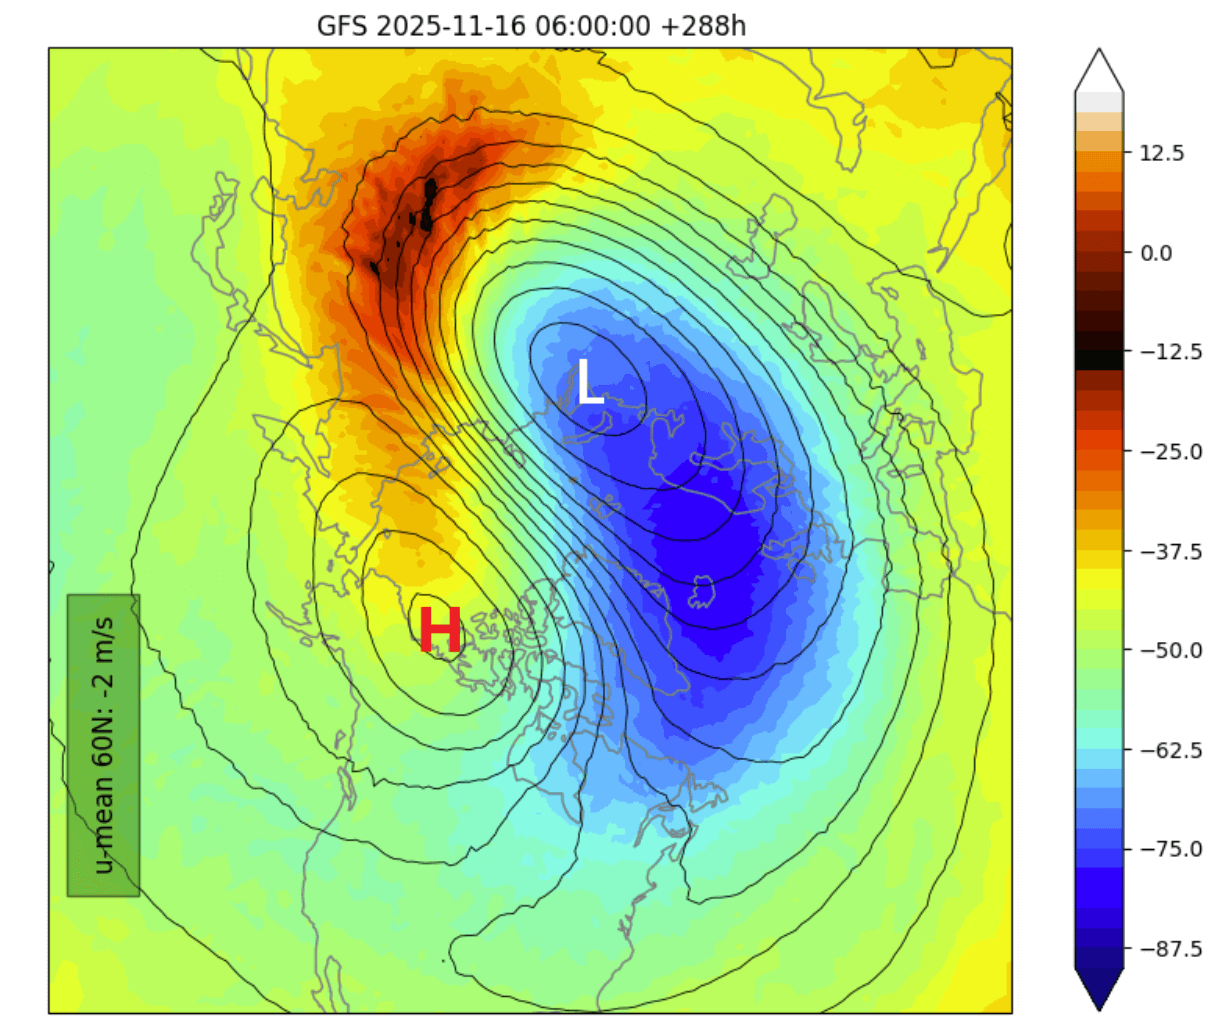
You can also see a very strong high-pressure area in the mid-stratosphere, sometimes called the “anti-vortex”. This high-pressure anomaly will compress and deform the Polar Vortex, starting a potential collapse of its structure and its ability to contain cold polar air in the lower levels.
Below is the mid-stratosphere pressure anomaly forecast for the same period. In this image, you can clearly see the large high-pressure anomaly in the mid-stratosphere at the 10mb level (30km/18.5miles height), squeezing the Polar Vortex, slowing it down, and creating a big disruption in the atmosphere.
Such a stratospheric warming event is quite unusual at this time of year. There are fewer than a handful of these stratospheric events recorded this early in the past 70 years, with this being the earliest on record, if it manages a proper wind reversal.
Below is the latest analysis and forecast of the stratospheric winds around the Polar Vortex. The black line shows the long-term average, and the color lines are different forecasts. You can see that all forecasts indicate a power reduction of the Polar Vortex over the next two weeks, as the high-pressure area expands in the stratosphere.
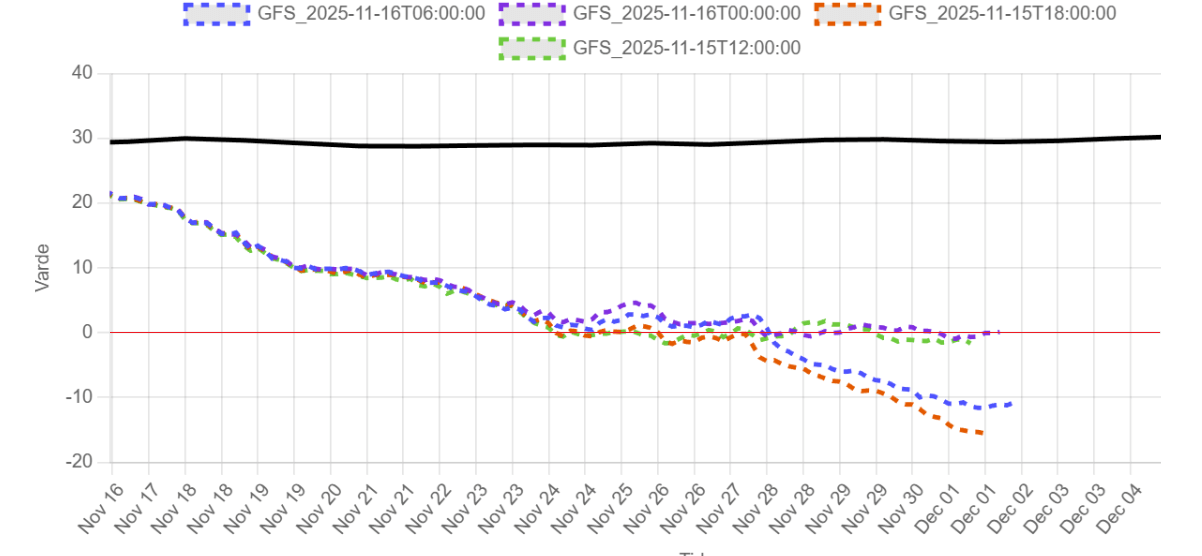
A crucial threshold is the 0 line, which marks a real wind reversal from westerly to easterly in the stratosphere. Latest forecasts show a reversal, which would mark this event as a major Sudden Stratospheric Warming (SSW). Surface weather impacts can also occur without an official wind reversal if the Polar Vortex is disrupted sufficiently.
We have checked past data and found only 3 stratospheric warming events that occurred this early in the season in the past 70 years. The seasons were 1958, 1968, and 2000, with stratospheric warmings in November. Two of which had a full wind reversal, and with 2000 just a weakening.
Below you can see the PSL surface temperature anomaly for December in those 3 seasons, following the SSW. It is very clear that these early events created a cold weather pattern over Canada and the United States, except for the southwest.
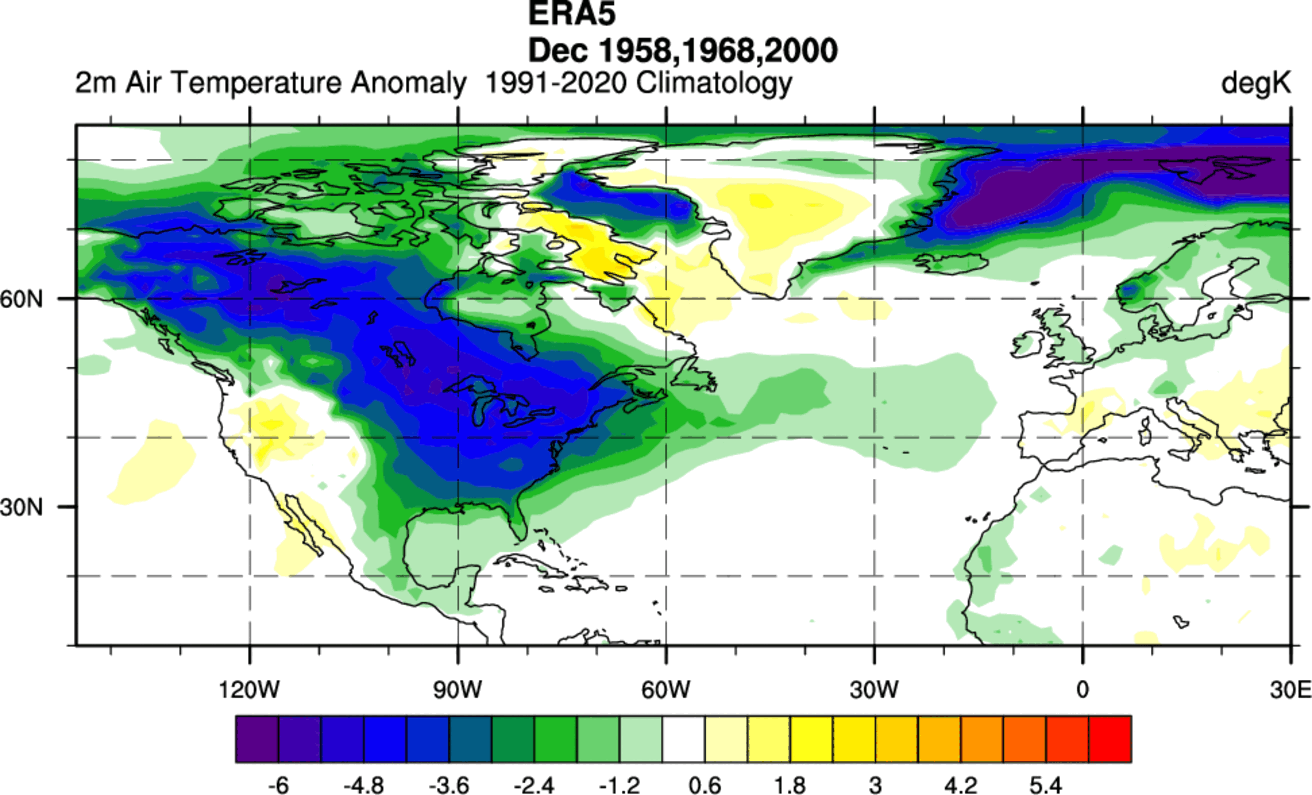
Europe shows a weaker response, with some cooling evident over the northern and north-central parts, similar to the La Niña map above.
We now know which are the two main direct factors that will shape Winter 2025/2026, but what do the actual latest forecasts say for the upcoming winter season?
WINTER 2025/2026 BEGINS
The meteorological winter season covers the coldest three months of the year: December, January, and February. In this segment, we will look at each month individually, using the latest long-range forecast data.
The main impact region of the SSW seems to be North America for now. Below is the 500mb (5km/3miles) pressure anomaly forecast for December. You can see how the forecast shows the expected blocked North Pole, with a broad low-pressure area creating a cold northerly flow into the United States from the polar regions, also known as the cross-polar flow.
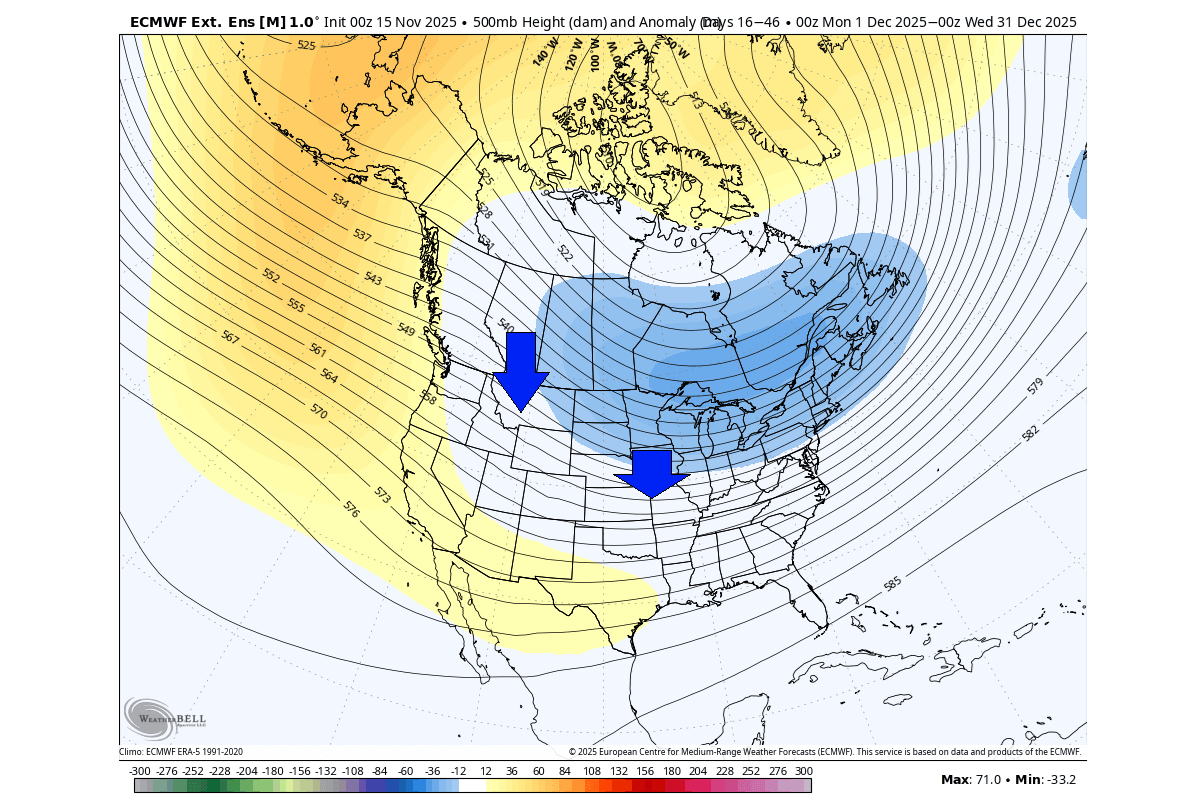
This is exactly what past data indicates following a strong disruption of the Polar Vortex. This is a strong sign of a cold and snowy start to Winter across the United States and southern Canada.
The temperature forecast for the whole of December shows an unprecedented look, with most of the United States and southern Canada running colder than normal. For something like this in recent times, you do need a strong driver, like a stratospheric warming event.
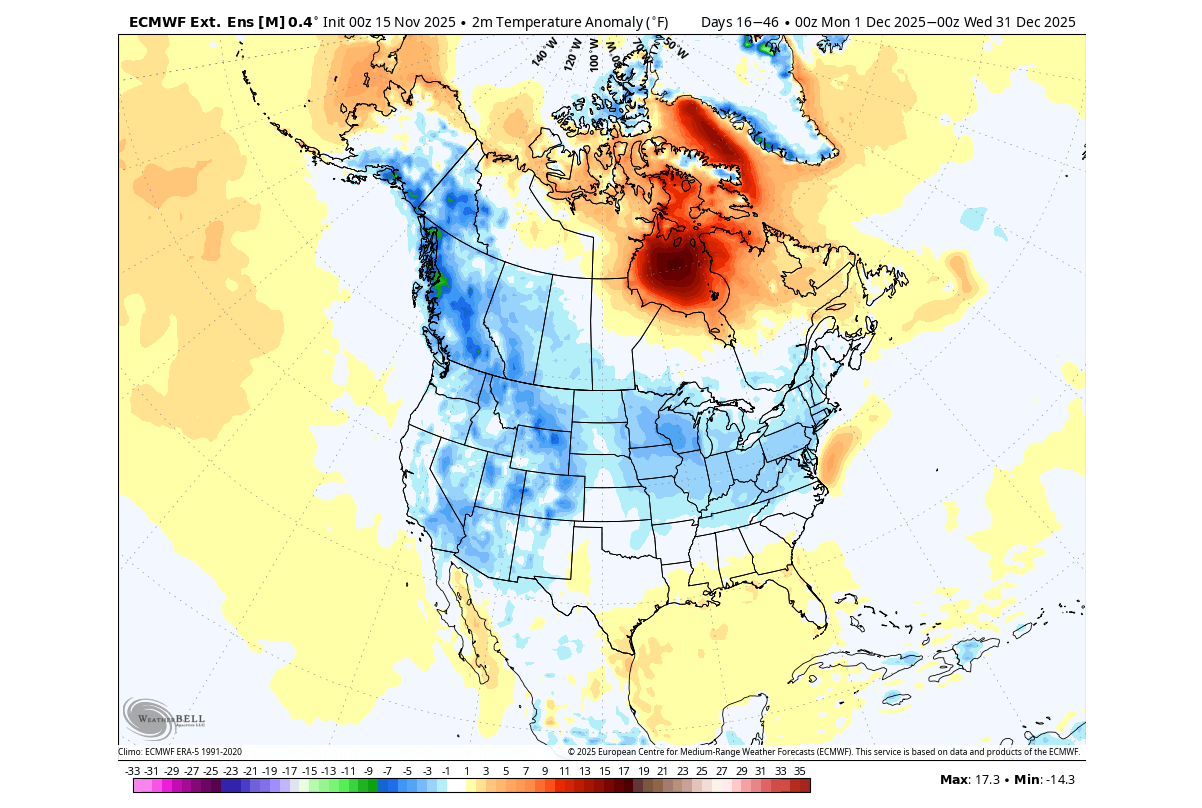
The exception is over northern Canada, under the high pressure, and over the far southeastern United States. But the rest of the country is in for a different kind of winter start, with the Arctic gates unlocked.
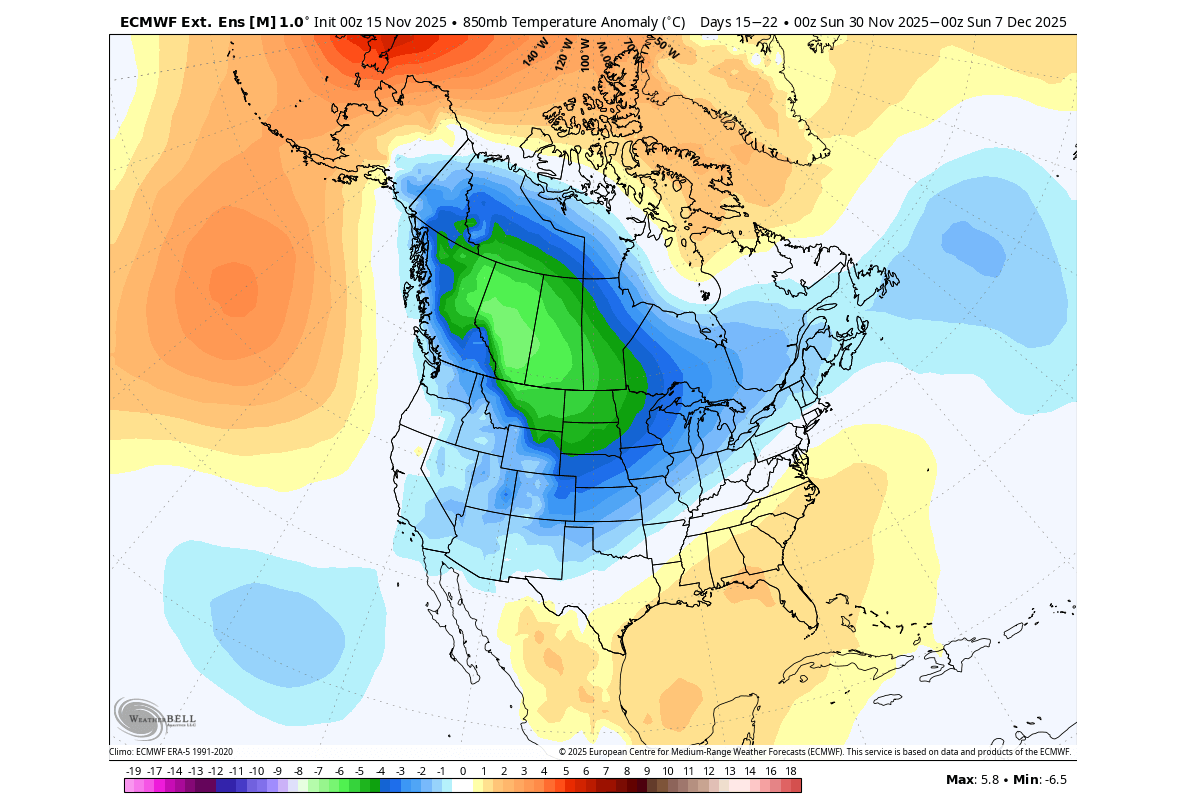
The temperature forecast for the first week of December indicates a potentially strong release of cold polar air from southern Canada into the northern, central, and northeastern United States. This is a proper way to open the new season, and is expected to spill the cold air over the rest of the country going into the month.
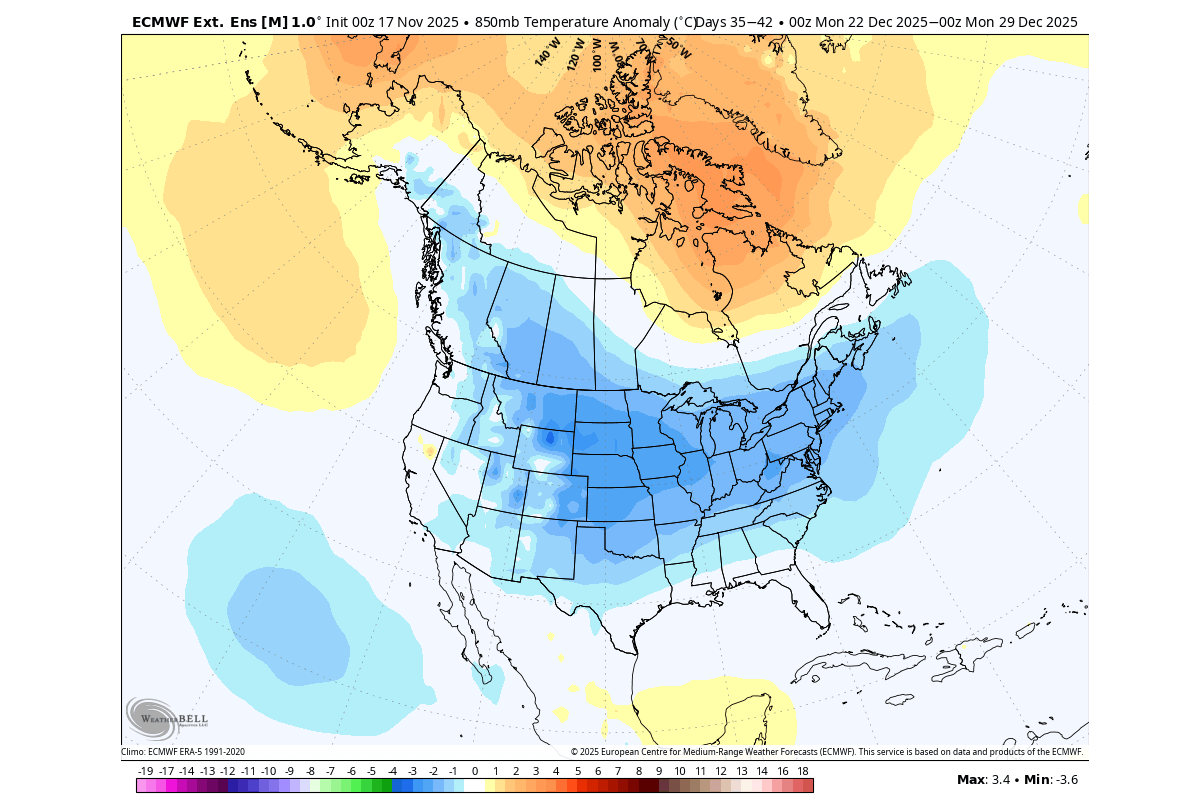
Looking into late December, we can see the cold air anomaly covering most of the United States, expanding from southern Canada. We specifically chose to show this week, as it covers the Christmas holidays. And since it shows a colder trend, this is exactly the right basis for looking at the potential of white/snowy holidays across the northern, central, and eastern United States.
Below is the snowfall forecast for December, which shows a good spread of total snowfall from Canada into the northern, western, and eastern United States. Some of the amounts are significant, but at this range, what matters more is coverage, and you can see a very good snow cover advance for this month.
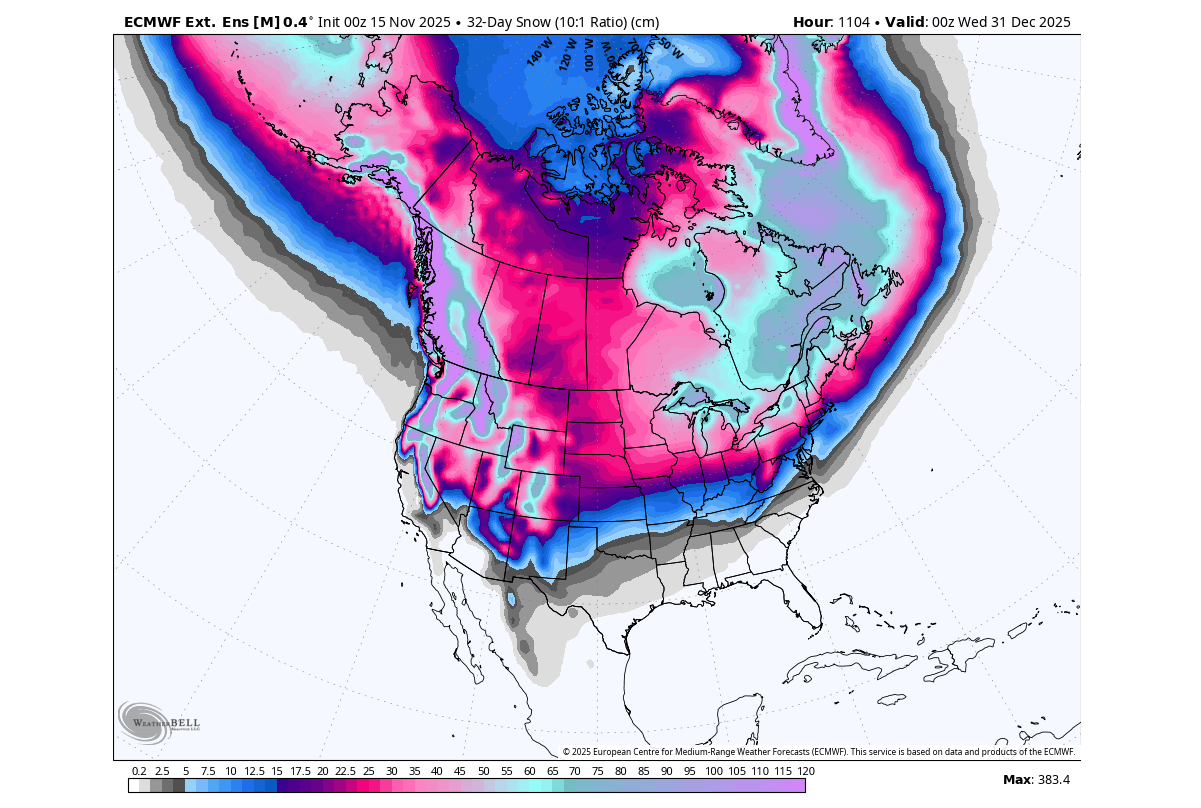
This is another positive sign for a good chance of a white/snowy Christmas deeper to the south of the U.S. and over the east, compared to many recent winters.
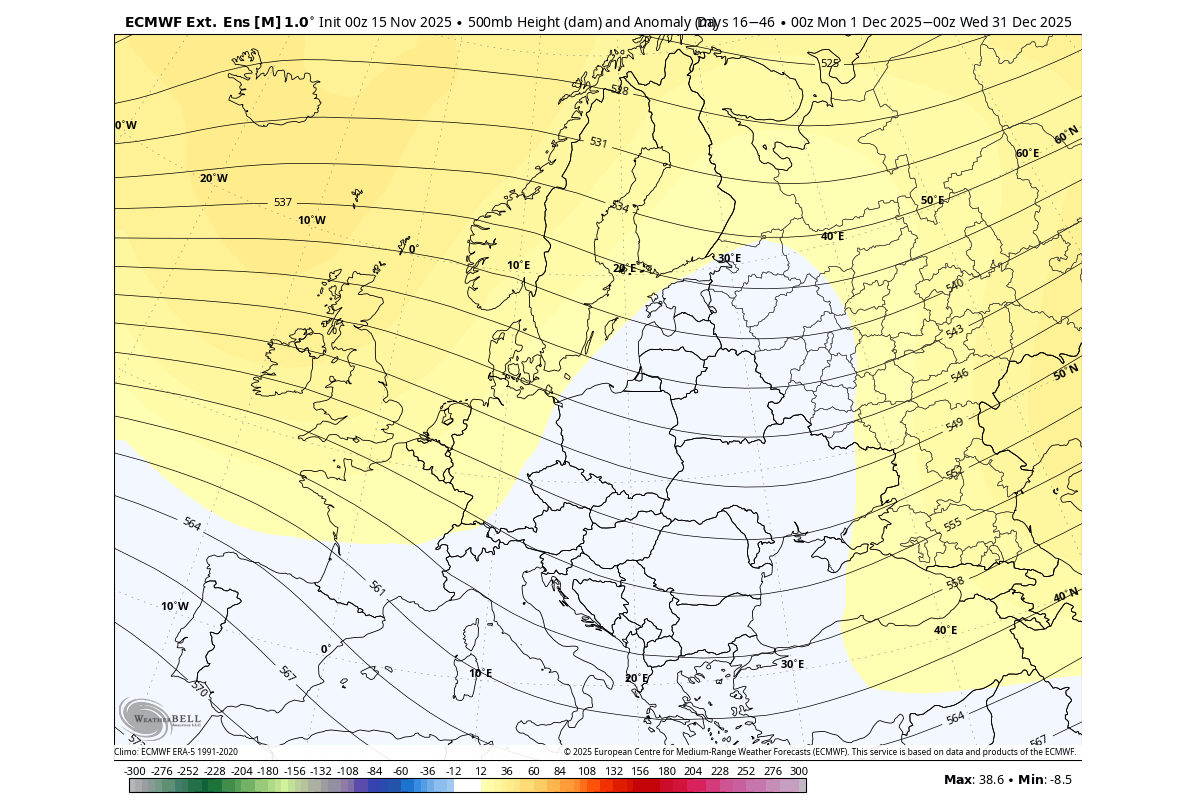
Europe shows a more dipole pressure pattern for December, with higher pressure to the north, due to the stratospheric warming (among other things), and lower pressure over central and southern parts. This tends to enable a more easterly flow, which is usually colder.
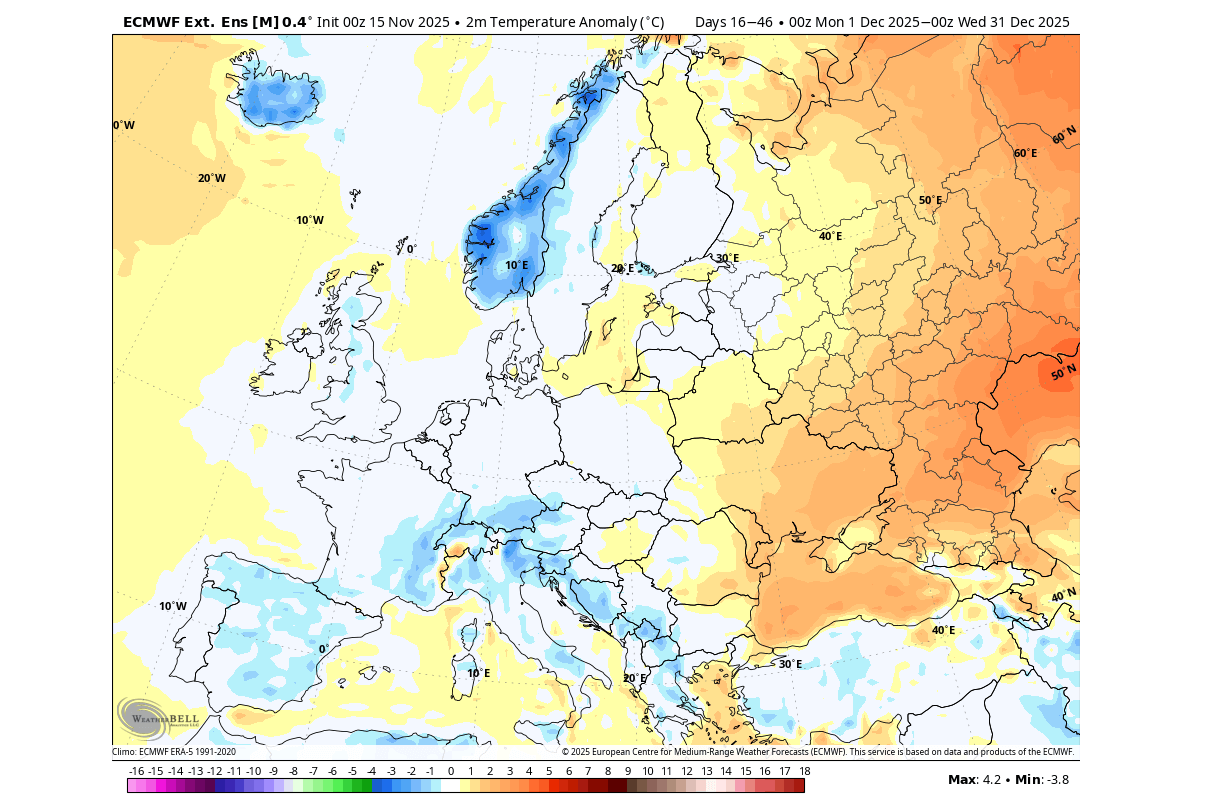
The temperature forecast for December does show normal to colder temperatures over a large part of the western and central regions. This is something that could be expected with the high-pressure area over the north, creating a reversed (codler) flow coming from the northeast.
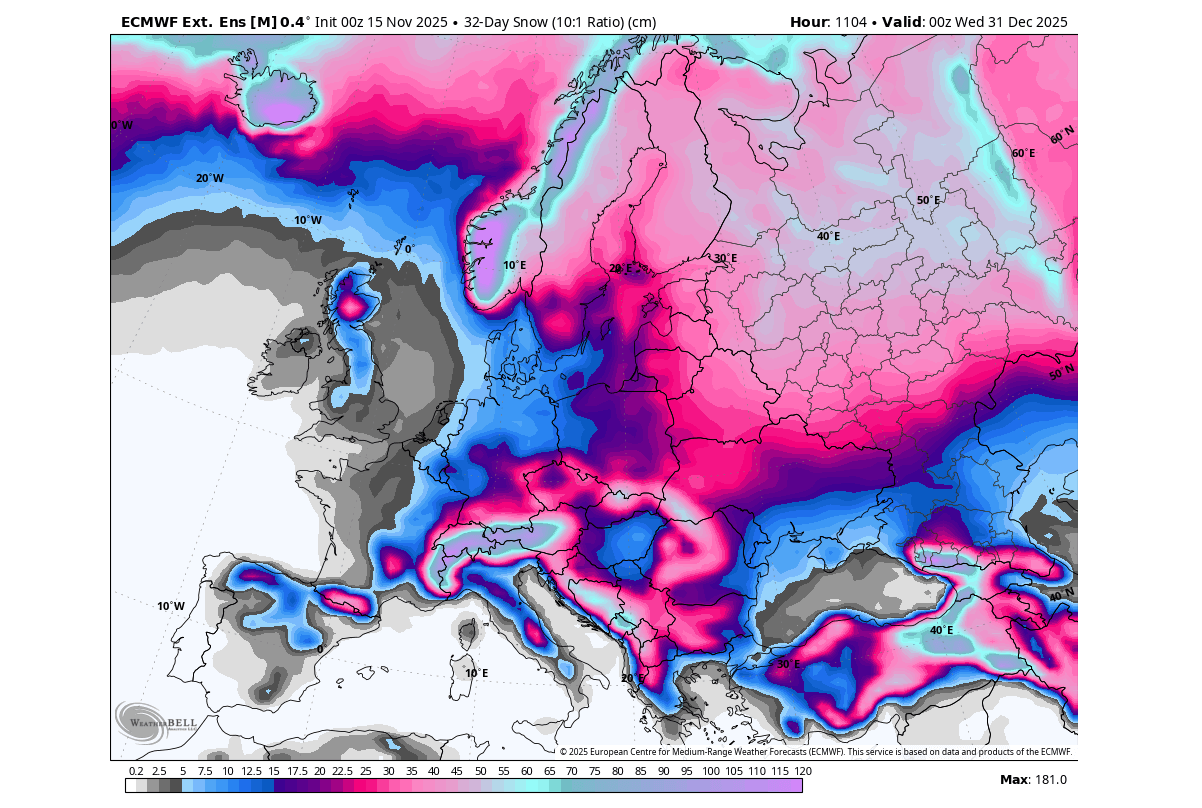
The snowfall forecast is also looking promising, with a decent amount of snow coverage expanding over the continent. This is one indication of a supportive pressure/temperature pattern, which provides enough cold air to allow snow precipitation.
Overall, we have to keep in mind that this is a deep, extended range. But as this pattern follows a stratospheric warming event (SSW), this is exactly what we would expect to see after such major changes. Especially in the United States, which has experienced some significant cold weather responses after an SSW in the past.
JANUARY 2026 WINTER WEATHER
The January pressure pattern forecast from ECMWF below shows the continuation of the disrupted December pattern, with a high-pressure area over Greenland and the North Pacific. This allows a low-pressure area to persist over Canada and the northern U.S., keeping the cold northerly flow active during mid-winter.
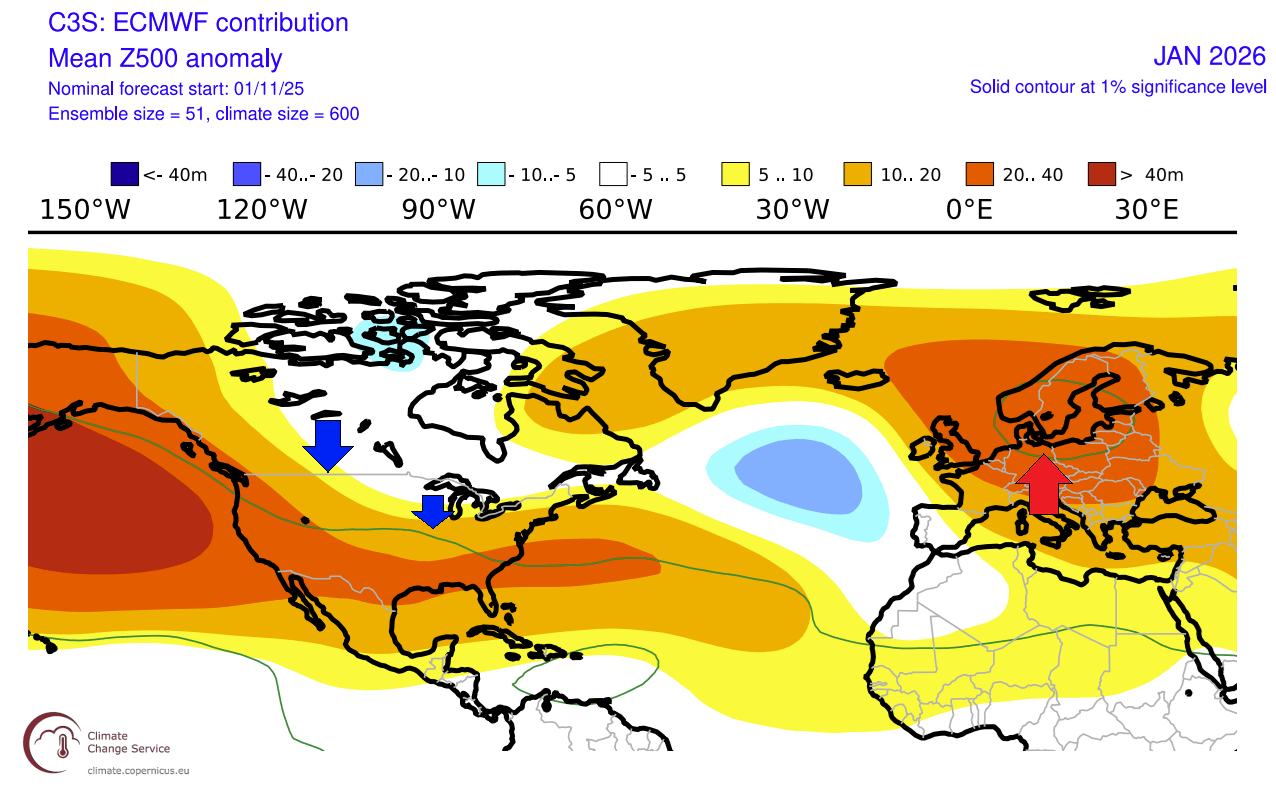
A low-pressure system in the North Atlantic helps to create a higher-pressure area over Europe. But as the low keeps further out, the flow over the continent is not pure southerly but partially from the north/northeast.
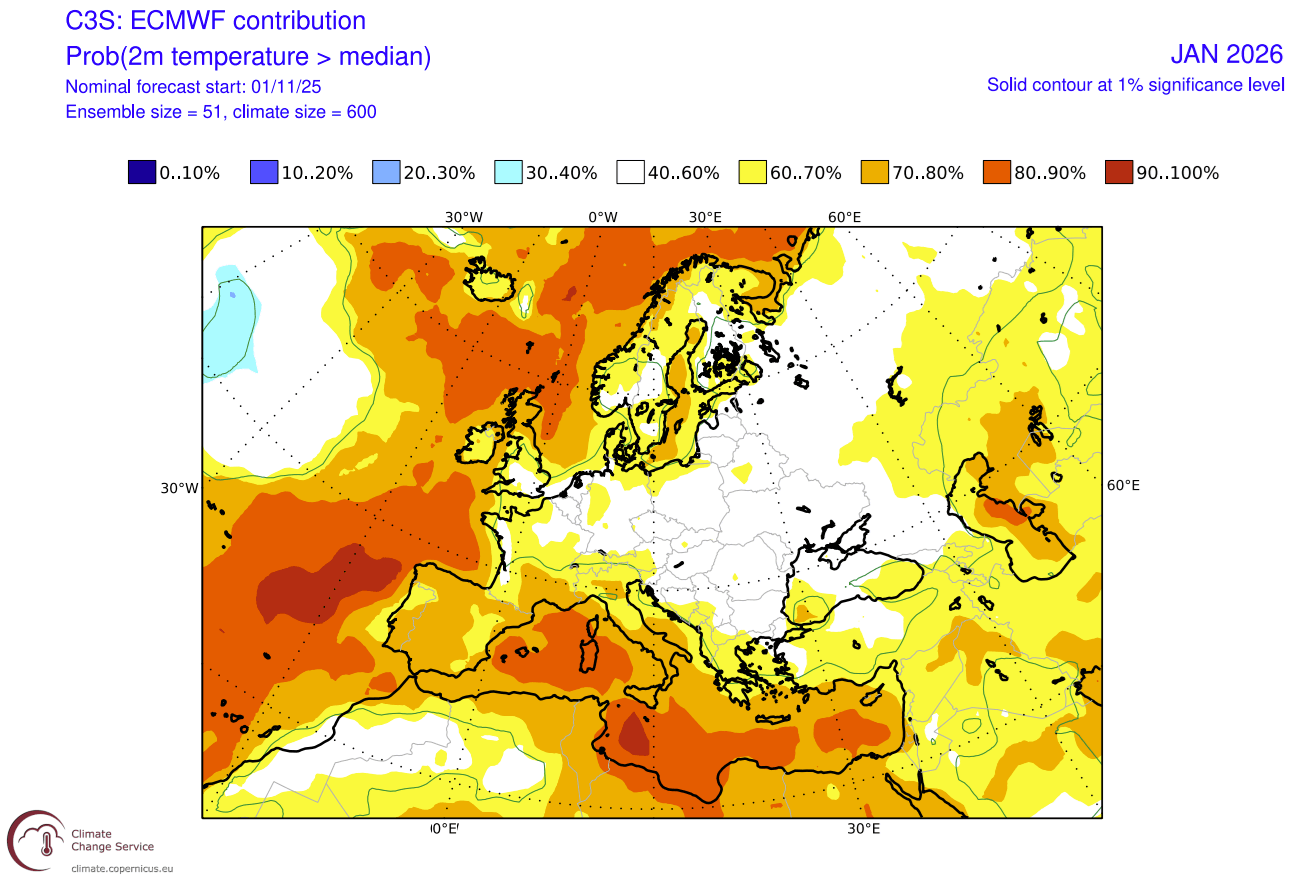
Looking at the surface temperature forecast over Europe, we see the surface temperatures are mostly above normal across the oceans. But you can see a rather neutral zone over the central parts and towards the northeast, likely impacted by the high-pressure system, creating a more northerly to easterly flow over these parts.
Over North America, the ECMWF forecast does not usually show cold anomalies at this range. Instead, it indicates normal/neutral areas, which are translated into the regions with the highest cold potential. Here we see warmer temperatures over the south/southwestern United States, but most of Canada is at normal temperatures.
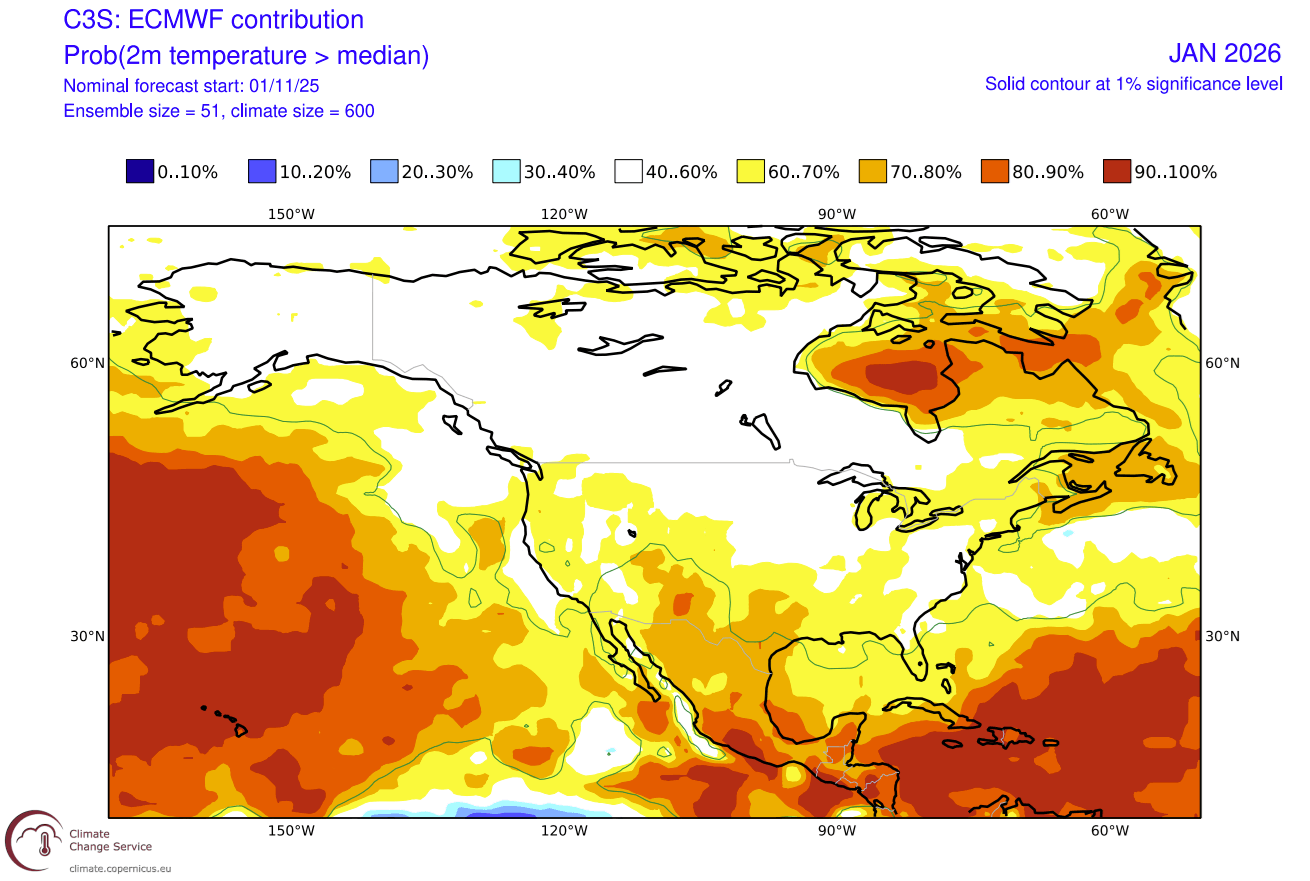
This means a cold airmass will sit over southern Canada, continuing from December. You can also see the indication of the cold corridor extending into the northern and eastern United States. So while we can’t see clear
The precipitation anomaly forecast for North America shows increased precipitation and likely increased snowfall across the northern United States. More snowfall is also forecast for southern Canada. Less precipitation is forecast for the southwestern United States.
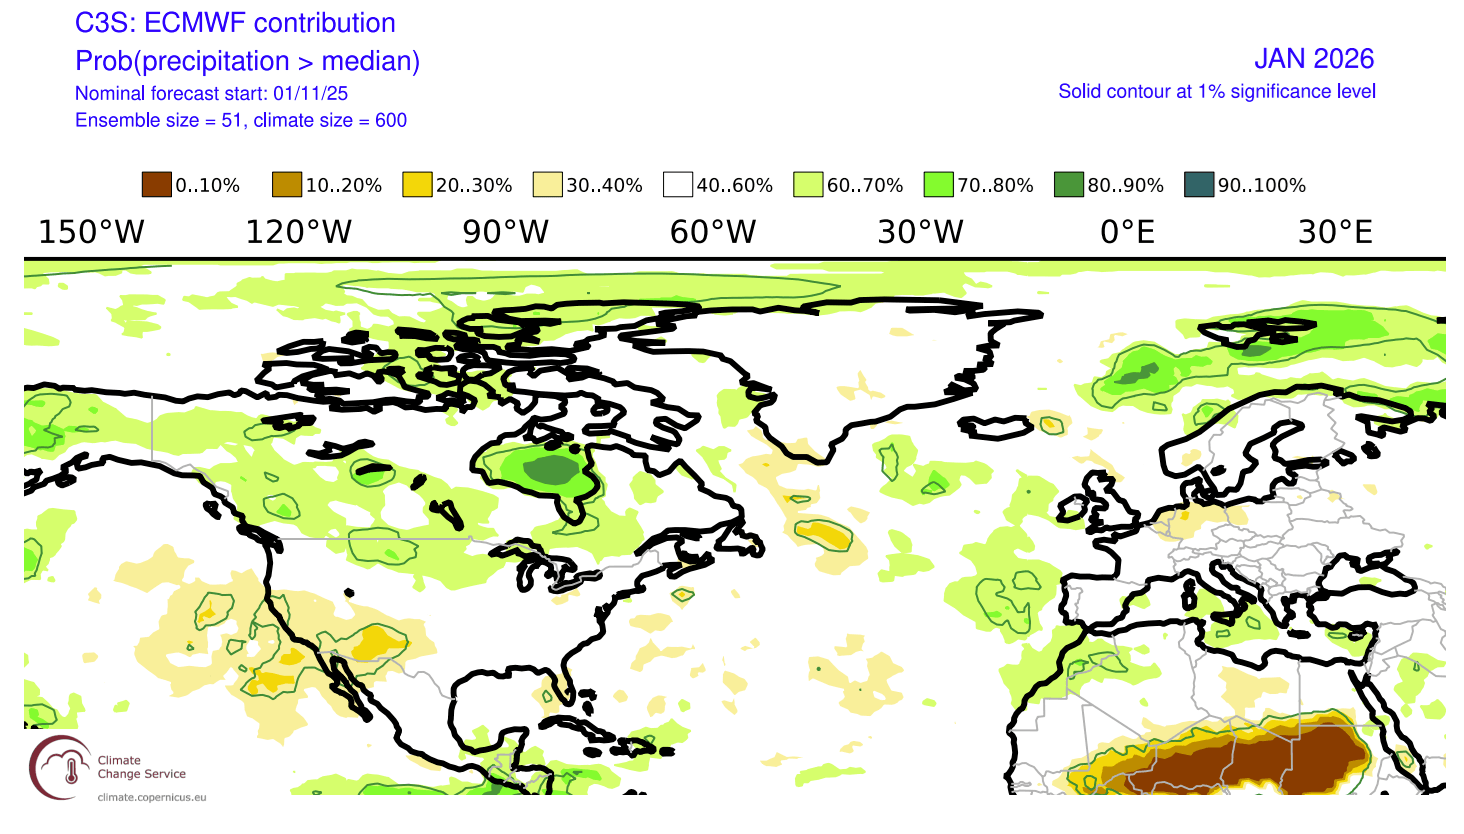
Across Europe, we see mostly below-normal precipitation, which is an indication of a higher pressure area and a likely drier/cooler airmass from the northeast.
FEBRUARY 2026 WEATHER PATTERNS
February is the last month of the meteorological winter, and often serves the coldest temperatures of the season. But the story in 2026 could be different, though at this range it is still likely to adjust, just like December is now turning out to be colder, despite early warm forecasts.
The February pressure forecast shows a pattern shift into a milder configuration, driven by the strong low-pressure area over Greenland and the far North Atlantic. High pressure is forecast to return over the eastern United States and also over Europe.
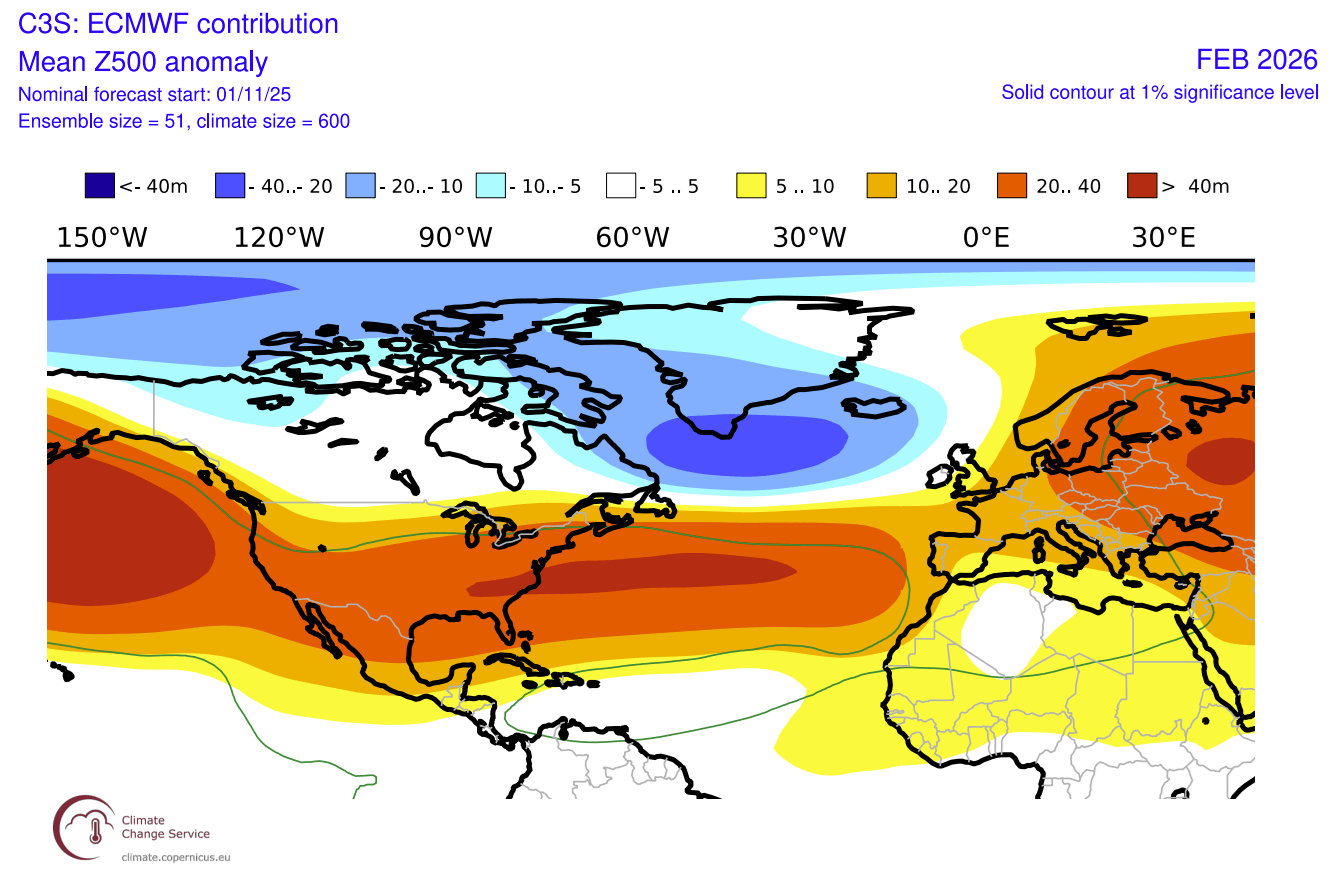
This indicates that the Polar Vortex circulation could regenerate in February, locking the colder air back into the polar regions.
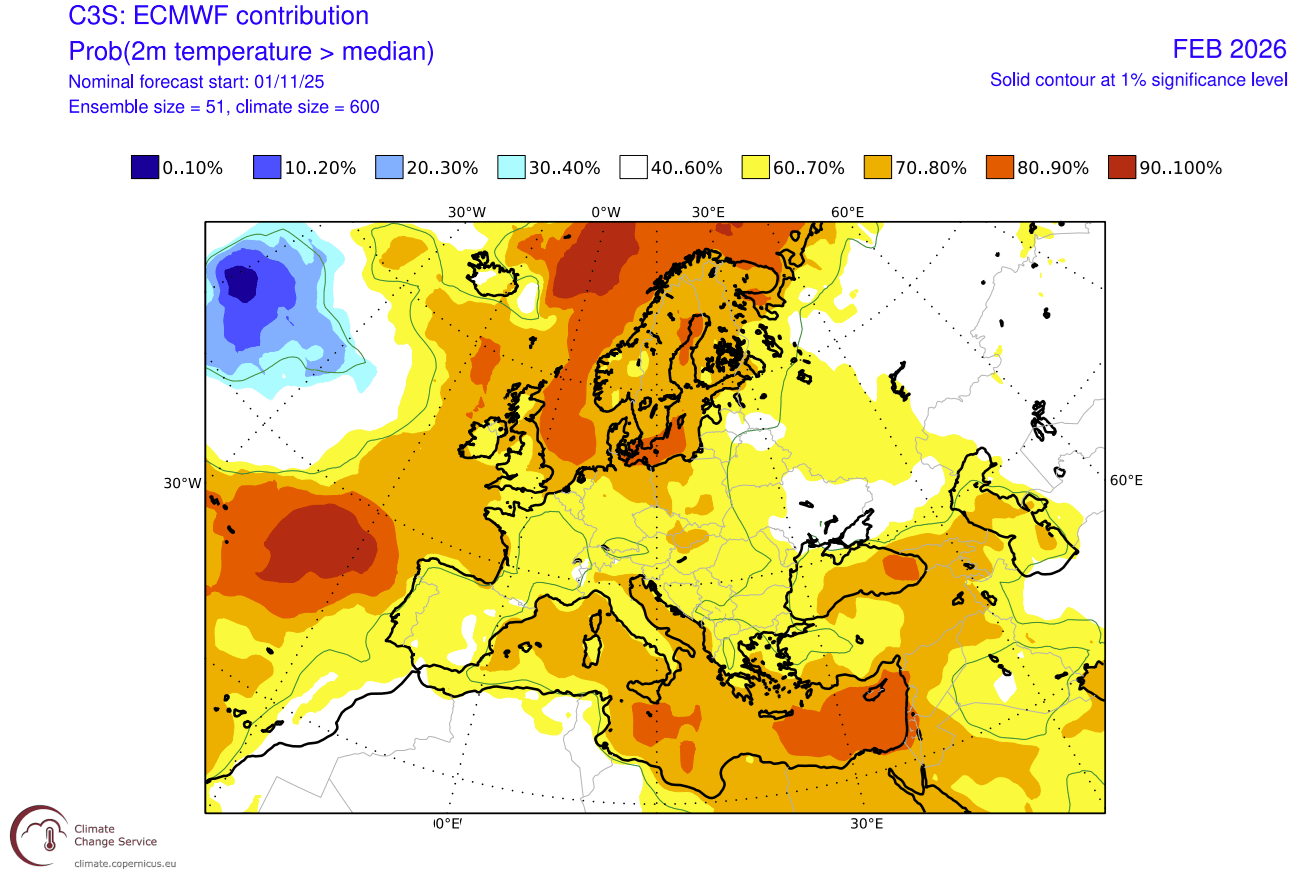
Looking at the surface temperature forecast over Europe, we see the surface temperatures are mostly above normal across the continent. But the warm probability is not so high, so it’s likely that this month could see a colder start and a warmer end, or vice-versa.
Over North America, the ECMWF forecast shows above-normal temperatures to start expanding from the south. But since southern Canada is still forecast with normal to colder temperatures, that allows the forecast to show a potential region of cold transport again, into the northern and eastern United States.
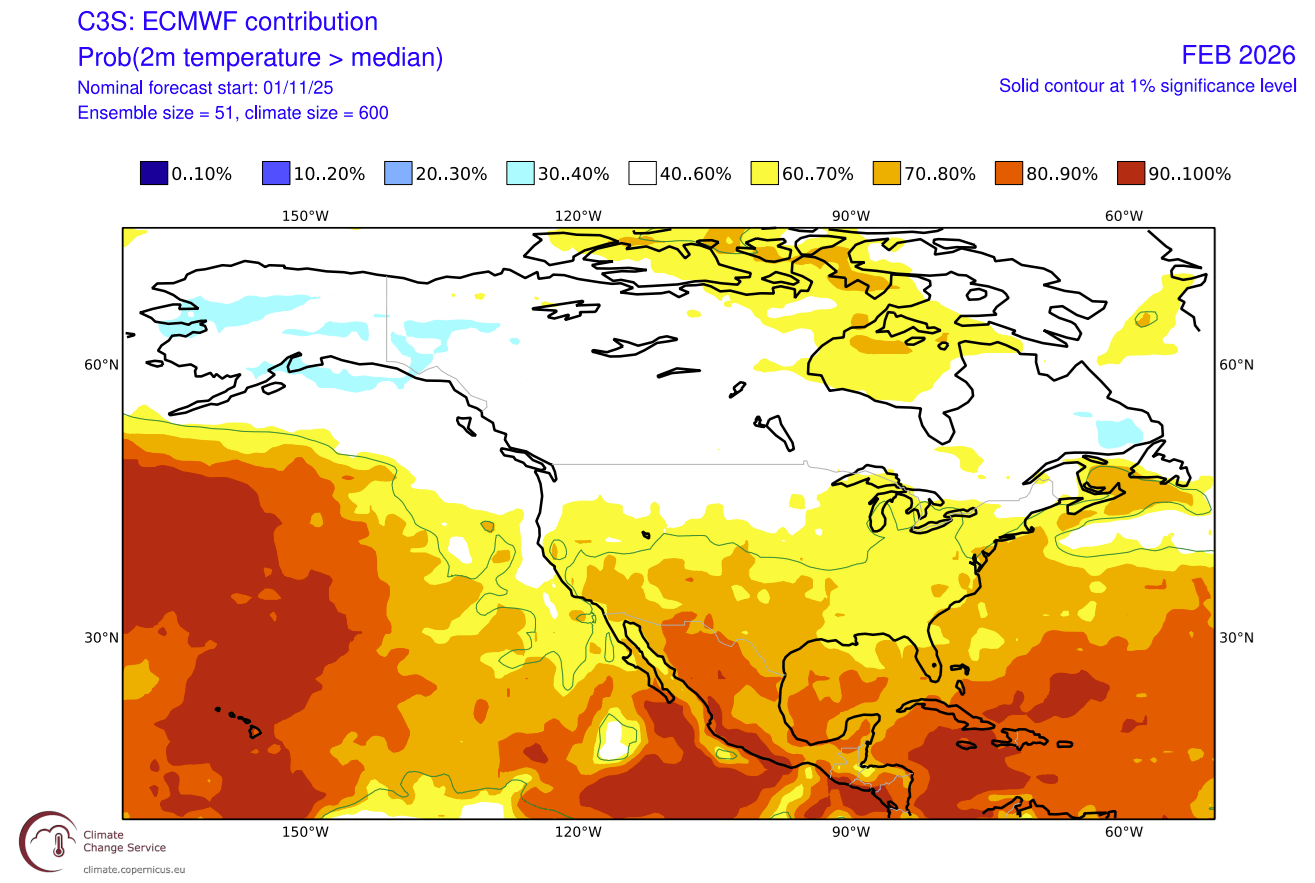
Here, we can also take this as an indication of a potential double-character weather pattern, with a colder start to the month, following a colder January pattern. But above-normal temperatures are likely to return over the month, as the La Niña also starts to fade away.
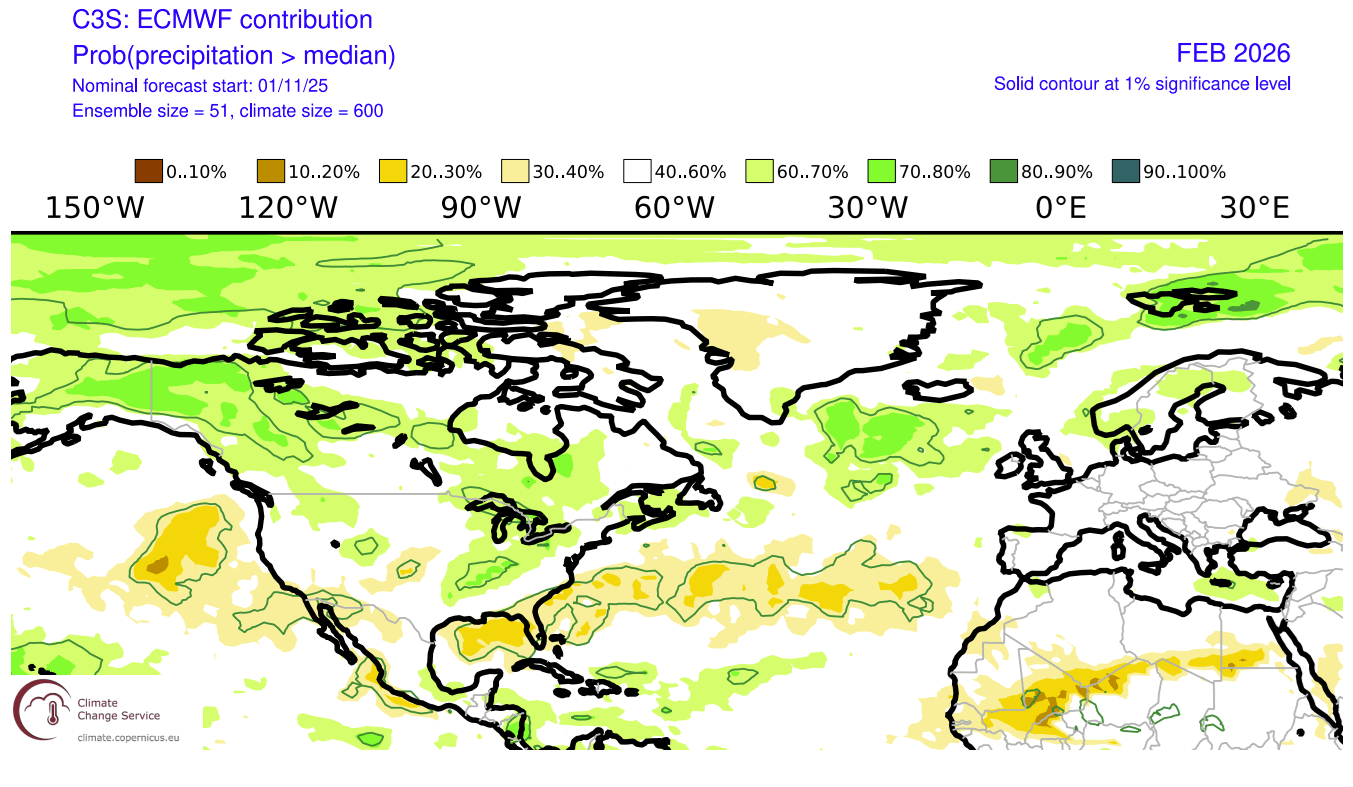
The precipitation anomaly forecast shows more precipitation than usual across the northern and eastern United States and over southern and western Canada. The main snowfall potential is over southern Canada, also reaching into the northern and eastern United States.
Europe shows more precipitation over the northern parts, due to the impact of the low-pressure area. But the central and western parts show near-average precipitation this month.
We will keep you updated on the global weather pattern development, so don’t forget to bookmark our page. Also, if you have seen this article in the Google App (Discover) feed, click the like button (♥) there to see more of our forecasts and our latest articles on weather and nature in general.
The main forecast images in this article are from WeatherBell, using a commercial forecaster license.
Don’t miss the current ongoing Stratospheric Warming event: