An early look at the Winter 2025/2026 shows the influence of a weak La Niña phase. The latest forecasts also indicate a weaker Polar Vortex, which means more dynamic pressure patterns, enabling colder winter days over the United States, Canada, and Europe.
The global weather system has many large-scale and small-scale driving factors. The main factor this year will be a weak La Niña event in the Pacific, but we also expect the Polar Vortex to play an important role in early to mid-winter.
We are first going to quickly look at the two main factors for Winter 2025/2026, before looking at the early long-range forecasts that show an interesting pattern developing over the Northern Hemisphere this upcoming winter.
COLD LA NINA RETURN
La Niña is a cold phase of the large oceanic ENSO oscillation. It is a region of the tropical Pacific Ocean that shifts between cold and warm phases. The cold ENSO phase is called La Niña, and the warm phase is called El Niño.
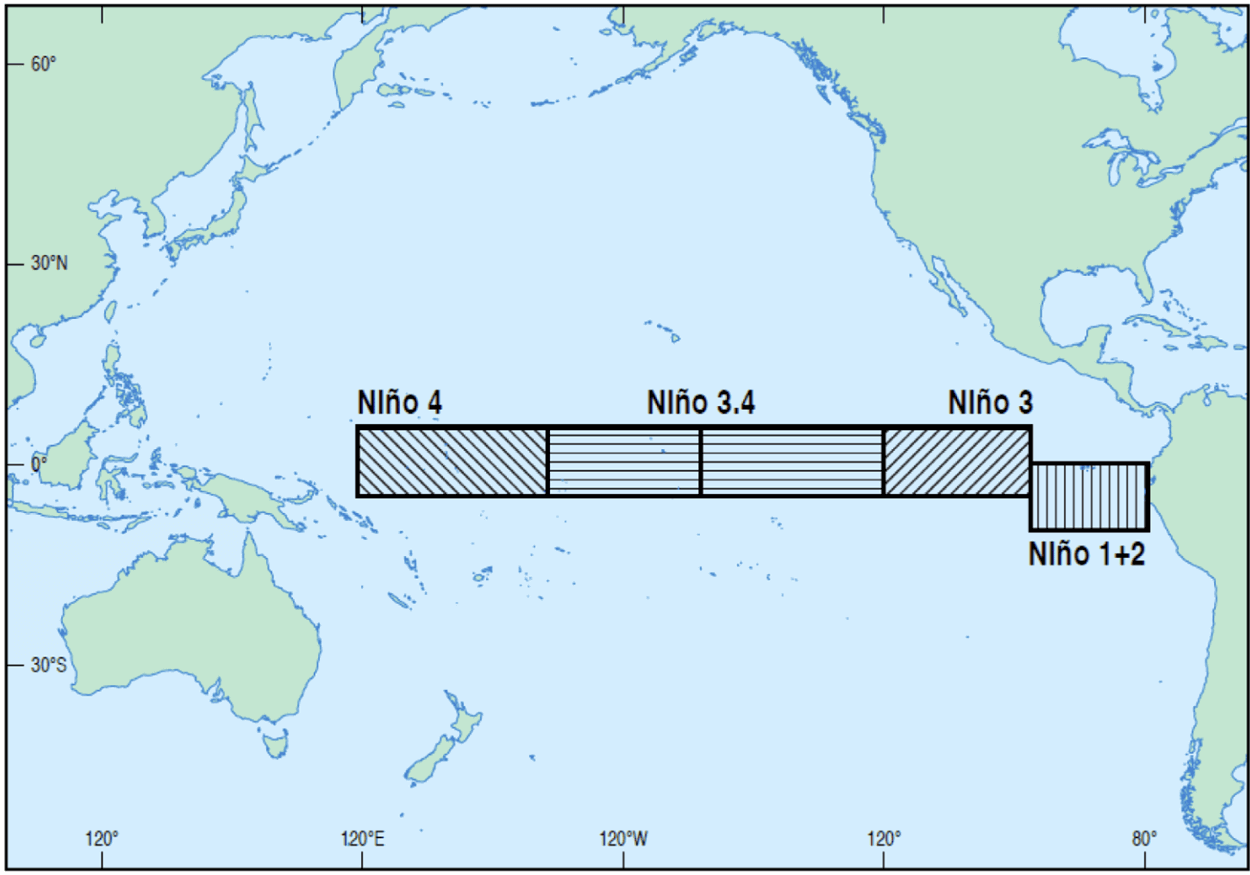
These ocean temperature anomalies (warmer or colder) occur in specific regions of the Pacific Ocean, as shown in the image below. The main region is 3.4 and is also the main area where we determine the active phase and its strength.
Below is the latest ocean anomaly analysis. It shows colder-than-normal surface waters in the central and eastern ENSO regions. These cold anomalies have a “wave-like” shape. This is because of the strong easterly trade winds that push the waters towards the west, creating swirls on the ocean surface. Image by cyclonicwx
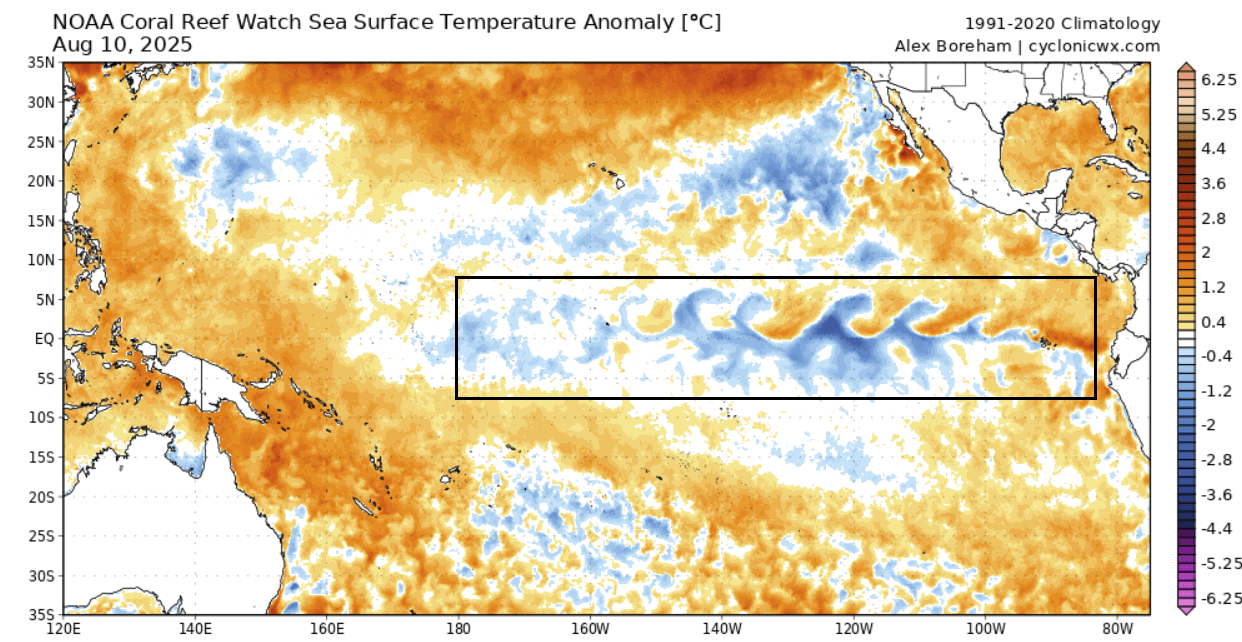
These cold anomalies are not strong or widespread enough to be considered a La Niña event and show a neutral phase. But these are the signs of the next La Niña phase, trying to do a slow start and emerge onto the ocean surface in the coming months.
Below is a high-resolution video that shows the ocean temperature anomalies for the past 30 days, showing a cooling area over the ENSO regions. This is still a clear neutral phase, but shows early seeds of a weak La Niña that is forecast to develop.
Below is the ocean temperature forecast for early Winter from the latest data, and it shows that a La Niña event is active. It is not a strong event and will likely become a weak to moderate event at best. But as you will see in the winter pressure patterns, it will leave its mark on the jet stream position.
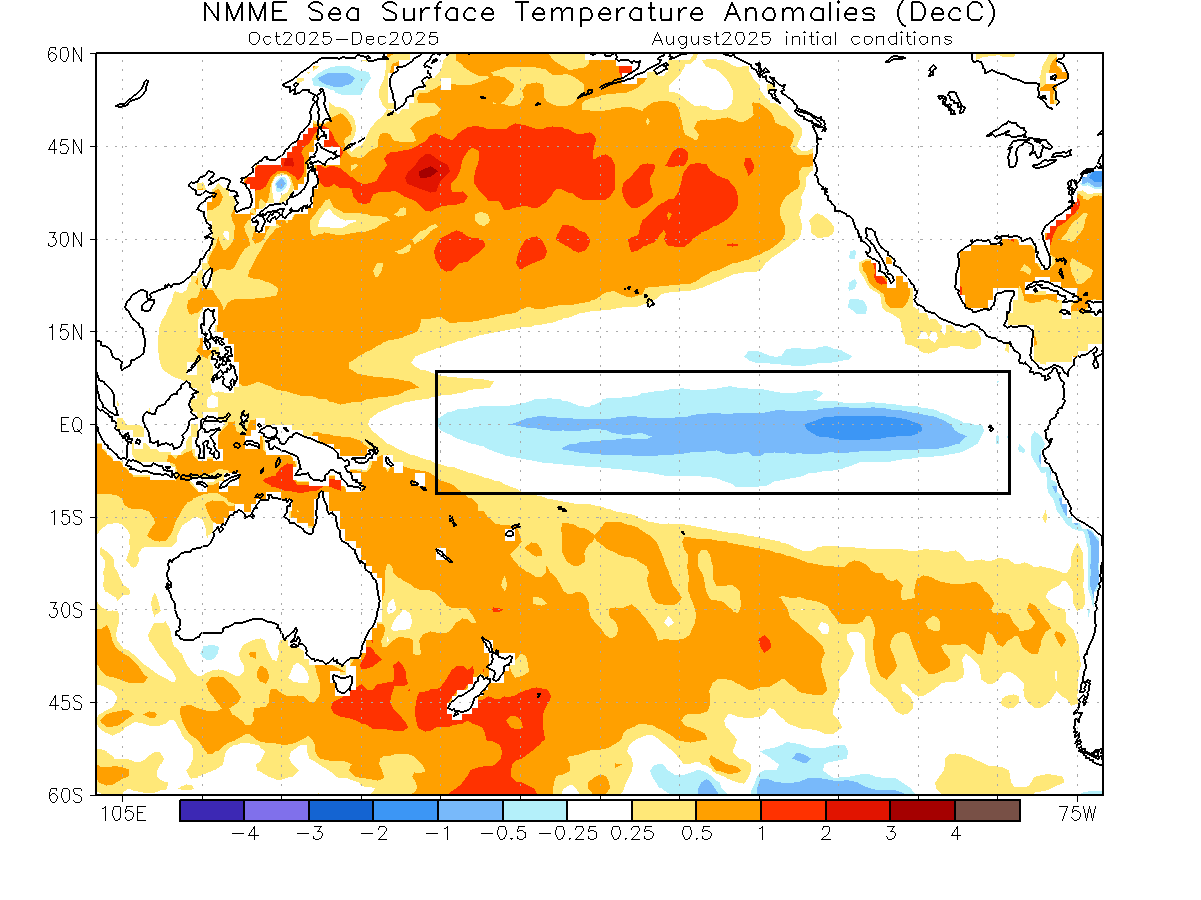
This data gives us enough confidence that we will see some influence from these anomalies over the coming cold weather season. The question now is how exactly La Niña changes the winter weather patterns.
La Niña usually comes with a high-pressure system over the North Pacific. That promotes the development of a low-pressure region over Alaska and Canada, shifting the jet stream downwards in between the two pressure systems.
The image below shows the typical La Niña winter development over the United States. It shows the average position of the jet stream during La Niña winters and the resulting weather patterns over the United States and Canada.
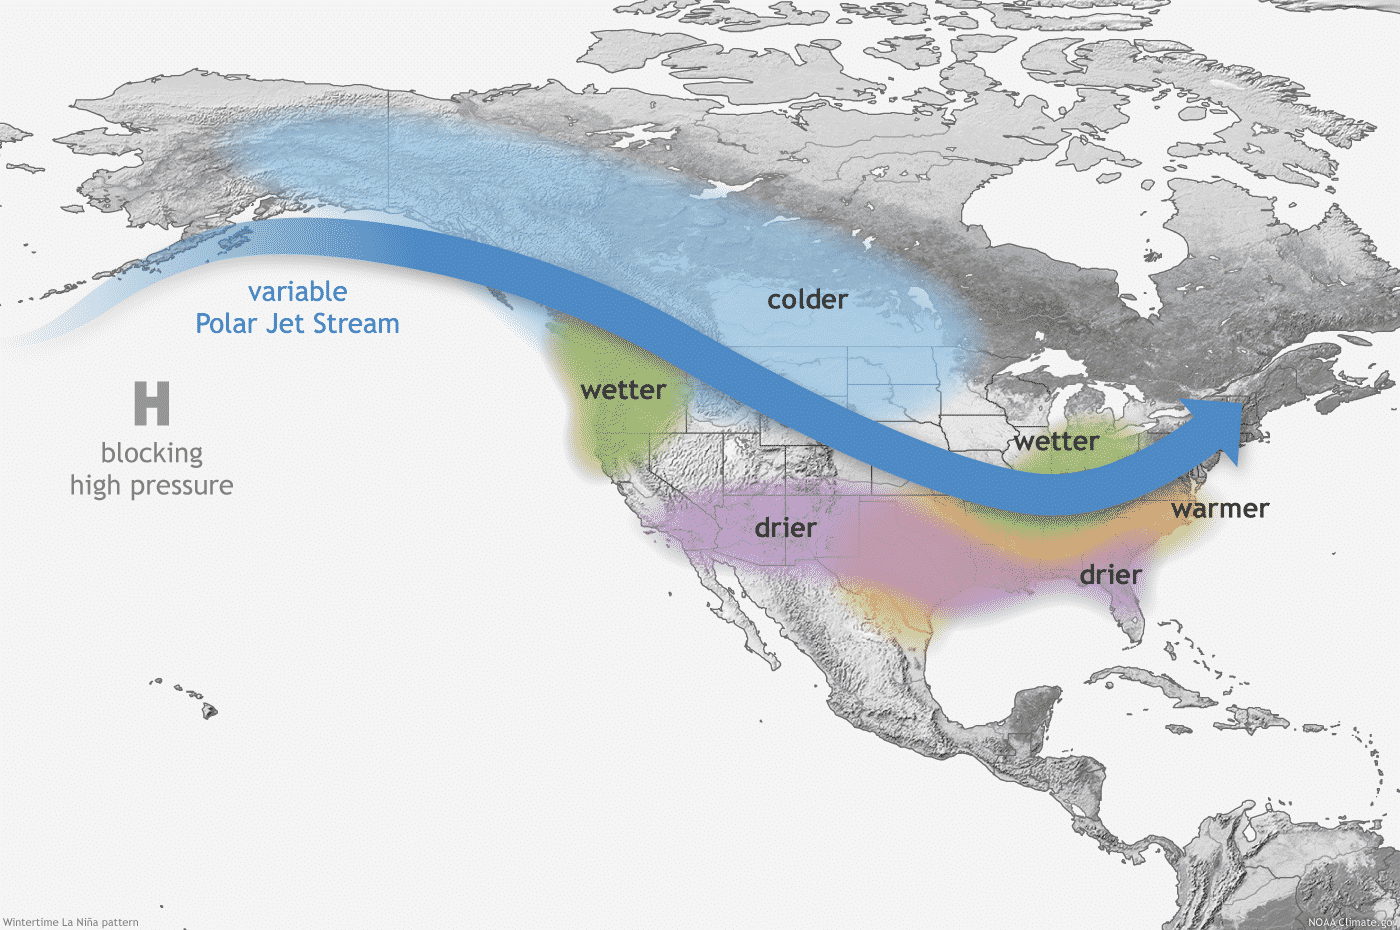
The displaced jet stream brings colder temperatures and winter storms from the polar regions down into the northern and northwestern United States. Warmer and drier winter weather prevails over the southern states.
As the colder air is more easily accessible to the northern United States and southern Canada in a La Niña winter, that increases the snowfall potential.
You can see above-average snowfall across much of the northern United States and southern Canada. Peak snowfall is usually across the higher elevations of the Pacific Northwest. But in other areas, states like Minnesota, Wisconsin, Michigan, New York, Vermont, and northern Pennsylvania stand out with more snowfall in such winters.
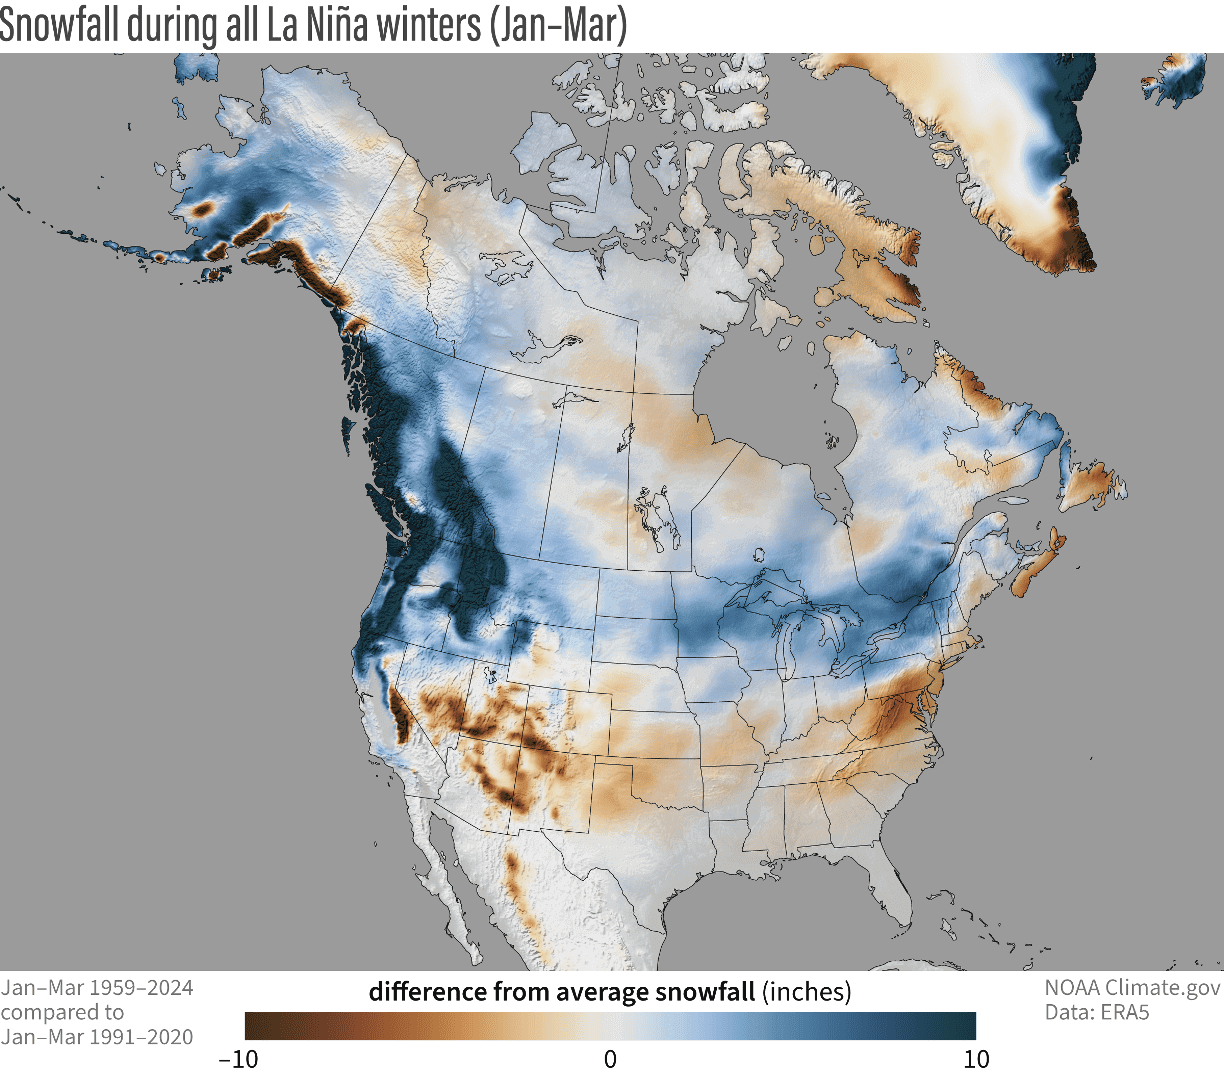
The southern United States usually experiences less snowfall in such winters because the jet stream is more confined to the northern United States and southern Canada.
But as La Niña is an ocean factor, we are also observing the forecasts for the stratospheric Polar Vortex, as it can be a key final factor between a cold and a warm winter, despite a La Niña.
THE POLAR VORTEX WINTER FACTOR
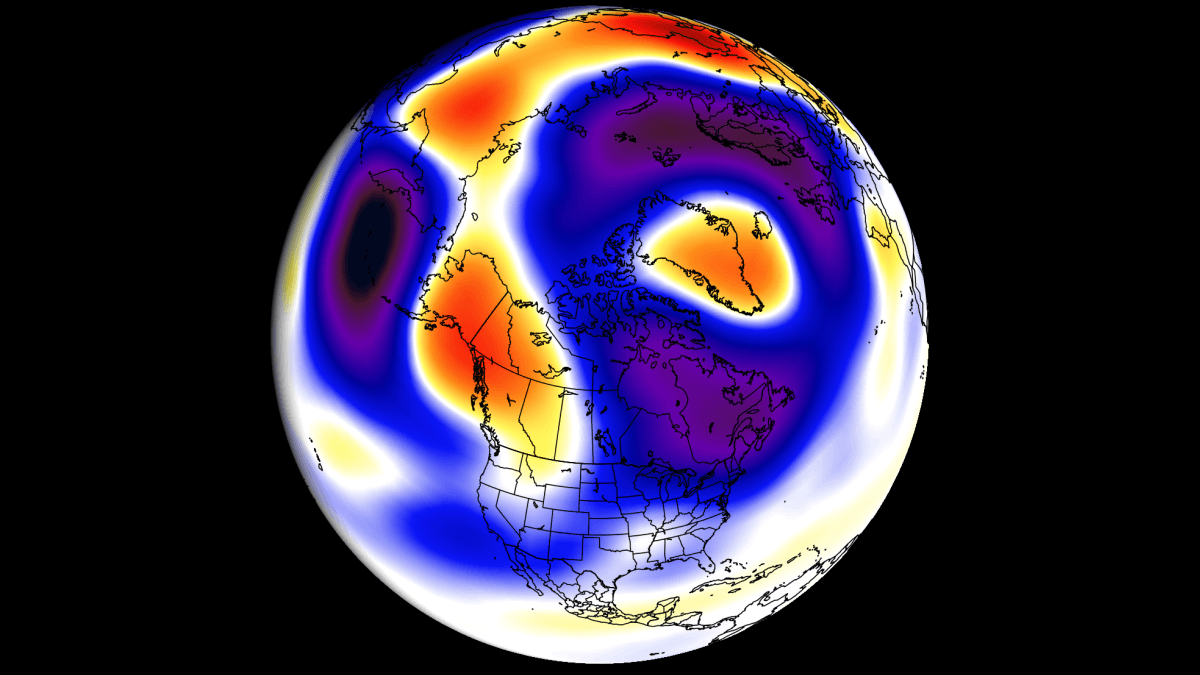
The Polar Vortex is a large cyclonic area that spins over the entire Northern Hemisphere and re-emerges every Fall. It plays a key role in weather development over the Winter and into Spring. For this reason, we have to take a quick look at its importance and early forecast, which shows an interesting development for 2025/2026.
The Polar Vortex winter impacts can come in two main modes:
A strong/stable Polar Vortex usually means strong polar circulation and a stable jet stream. This contains the colder air in the far north, creating milder conditions for most of the United States or other mid-latitudes.
In contrast, a weak Polar Vortex creates a disrupted jet stream pattern and a strong weather response. As a result, it has a harder time containing the cold air, which can now more freely escape from the polar regions into the United States or other mid-latitude regions.
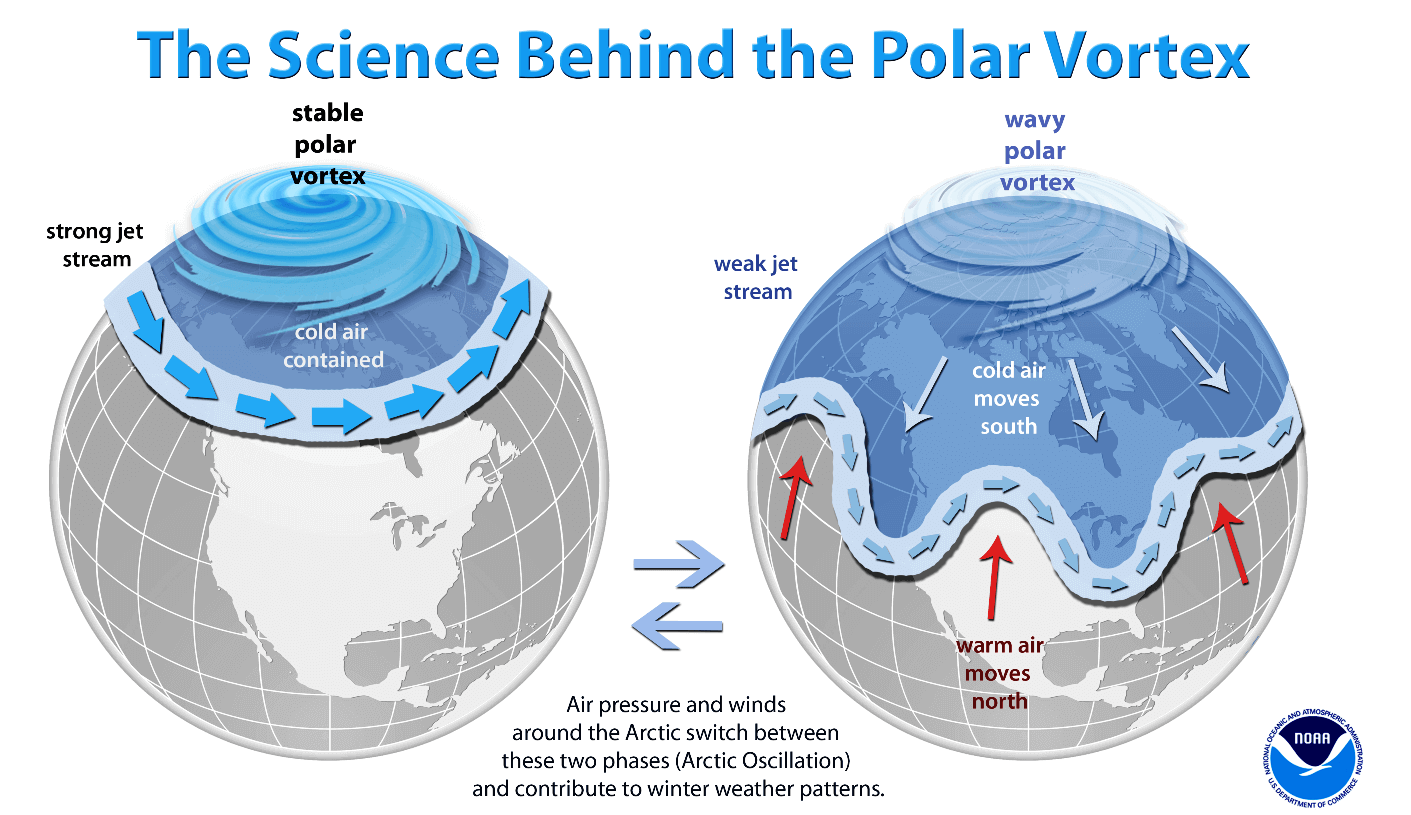
So, if you want a colder and snowier Winter, your best bet is a weak Polar Vortex. In nature, a weak Polar Vortex essentially means a breakdown of the winter circulation. This allows the cold air to escape the polar regions more easily and head for the mid-latitudes like the United States.
That is usually achieved by increasing the pressure or temperature in the polar Stratosphere. We call such an event “Sudden Stratospheric Warming”. As the name suggests, it is a rapid temperature increase in the Stratosphere, and we had such an event this Spring.
Historically, a La Niña winter has a 60-75% chance of producing a Stratospheric Warming Event (SSW). It has produced them in the past and also in recent winters. The image below shows the typical SSW event frequency by month and by the ENSO event, revealing that a La Niña tends to favor a weaker Polar Vortex overall.
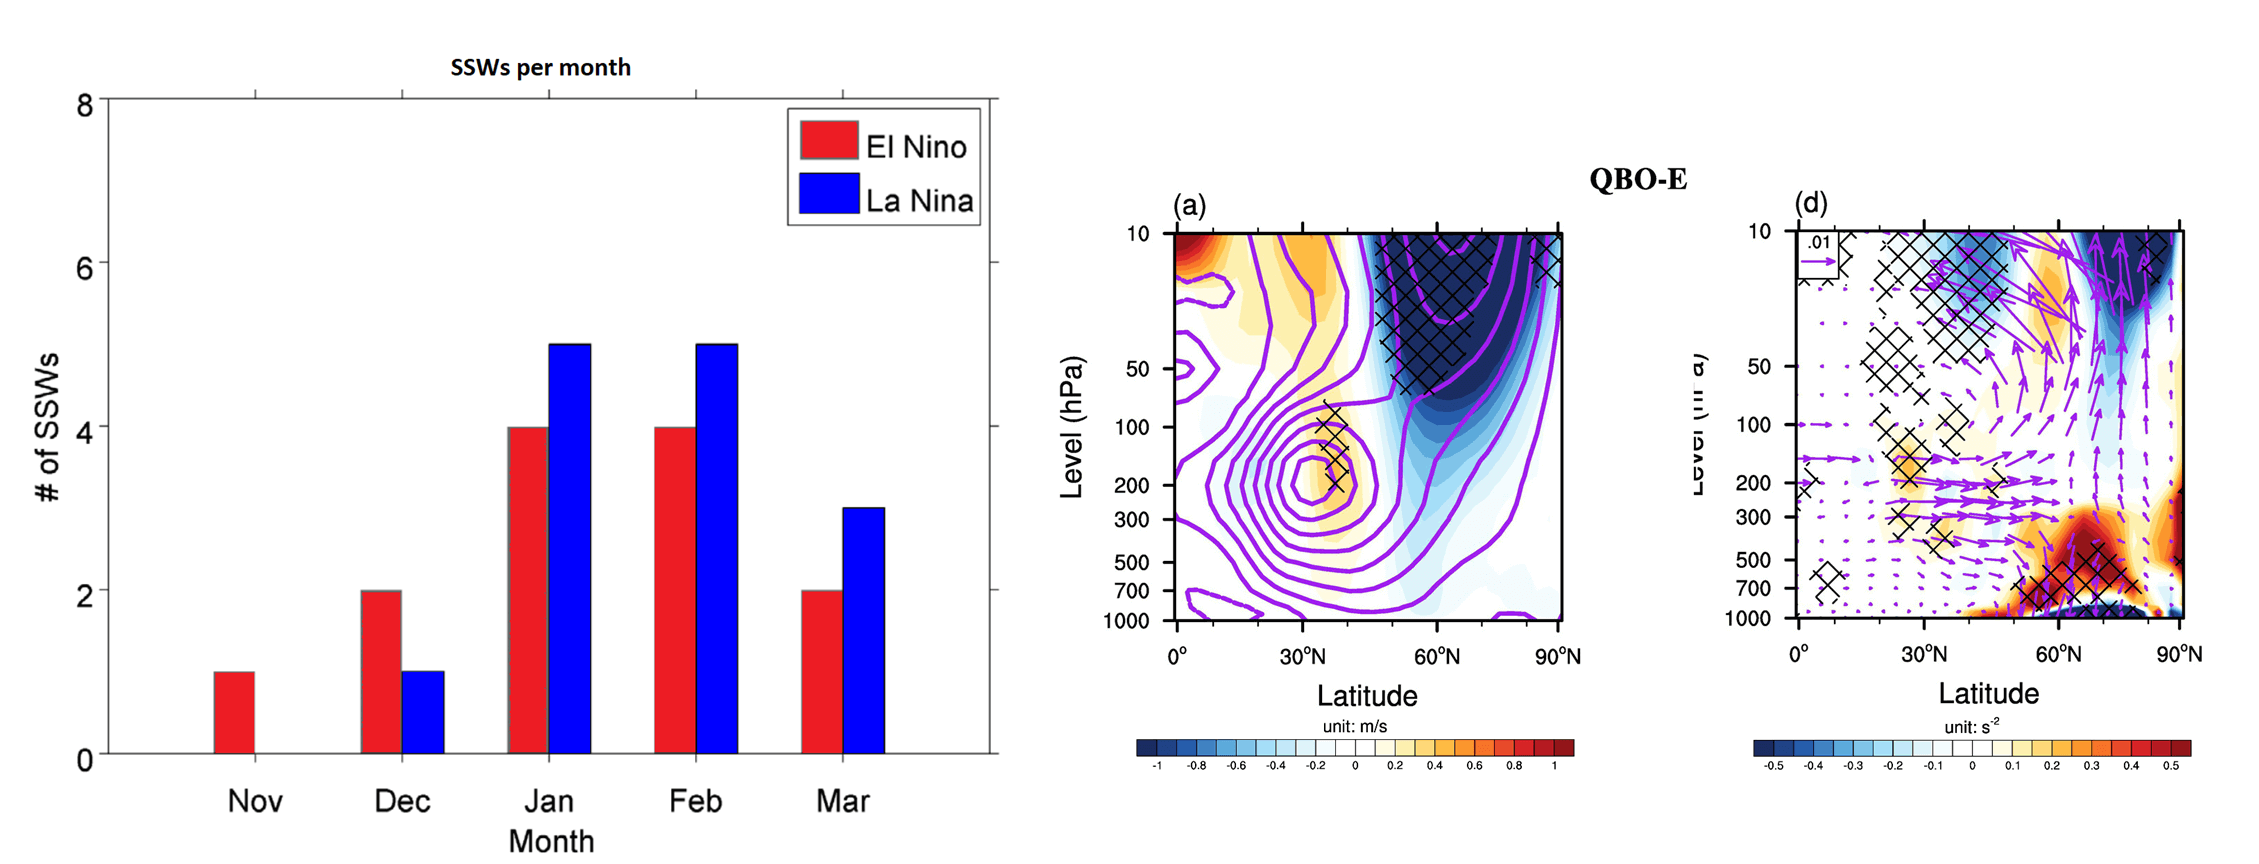
You can also see an effect from the east QBO in combination with a low sea-ice extent, weakening the Polar Vortex. We have already discussed this in more detail in our previous articles, so we will link to our more in-depth analysis below this article.
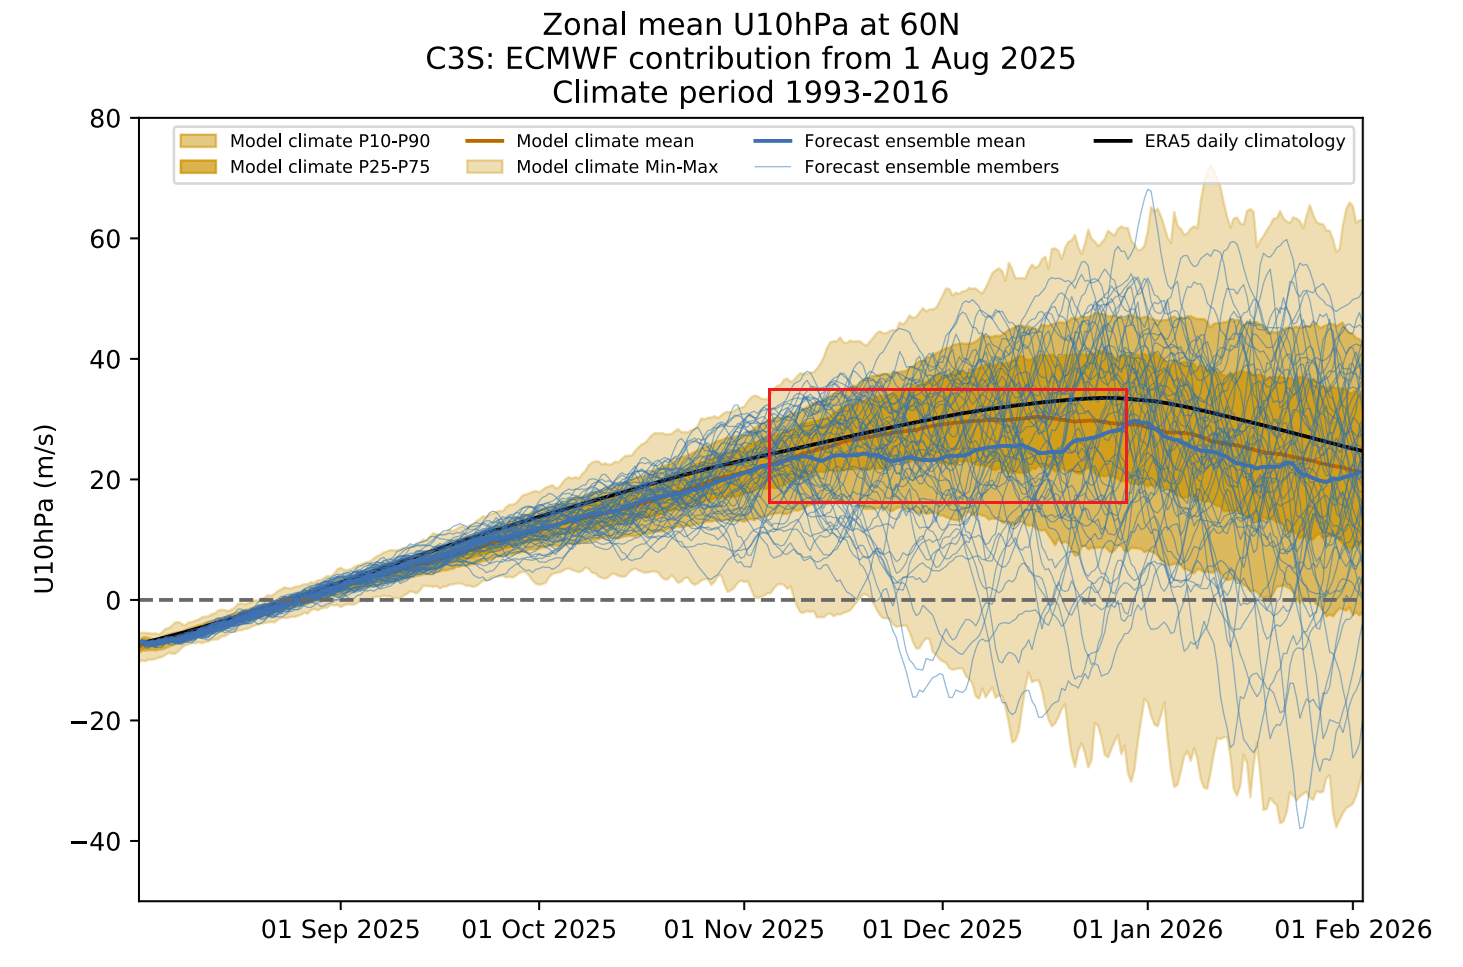
The ECMWF forecast for the Polar Vortex actually shows its power (wind speeds) to be weaker than normal in the early winter stages. This is kinda expected, given the overall global factors that help to send energy into the stratosphere, weakening the Polar Vortex, raising potential for colder winter days.
So, as we now know what factors can shape the winter patterns, we will continue to the actual Winter 2025/2026 predictions and look for some of these peculiar winter patterns.
WINTER 2025/2026 FIRST FORECAST
For the early Winter forecast, we looked at two seasonal models: the ECMWF and CanSIPS. The images are from the Copernicus project and Weatherbell (commercial license).
All these forecasts are an average picture over three meteorological winter months (December-January-February) and show the general prevailing weather patterns.
Even if the models were 100% accurate, it does not mean such weather conditions would last for three months straight. It only suggests how the weather patterns might look most of the time.
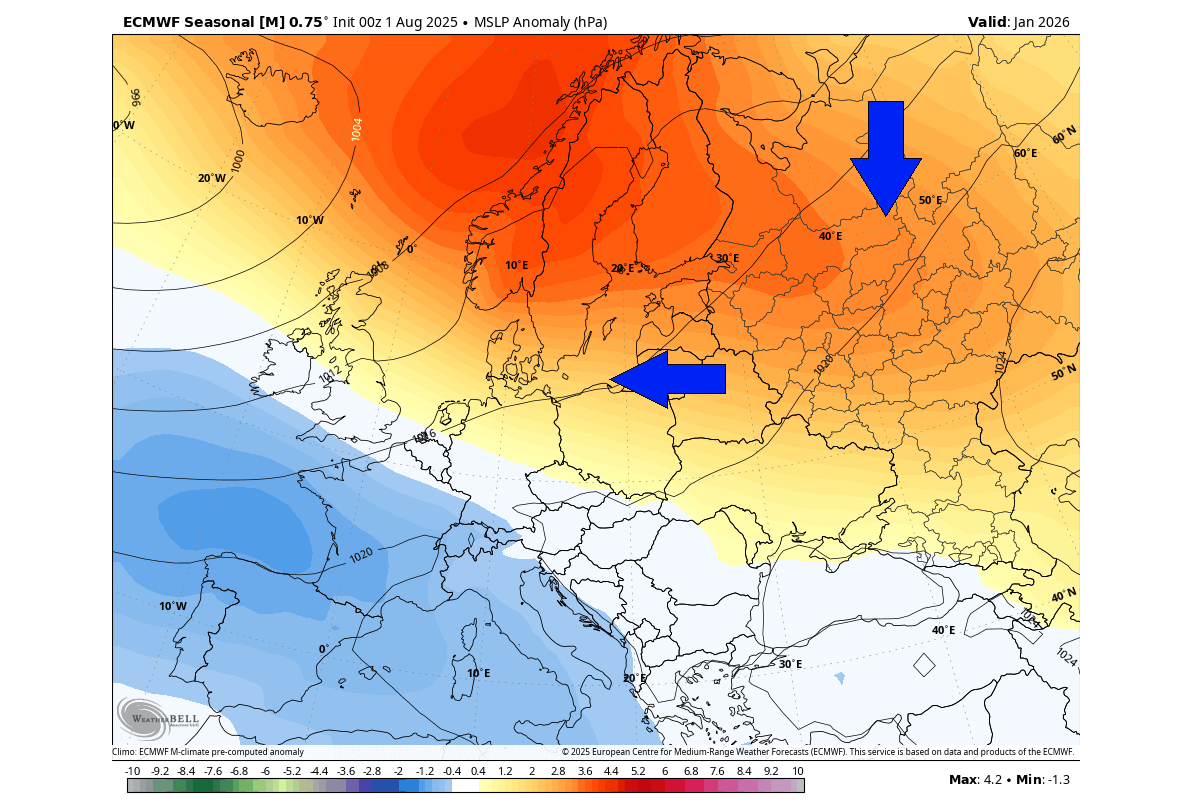
The early winter pressure pattern forecast from ECMWF shows the La Niña high-pressure system in the North Pacific and a broad low-pressure area from eastern Canada into western Europe. A high-pressure area extends from the southern United States across the Atlantic. Notice the very blocked polar regions, indicating a weak Polar Vortex.
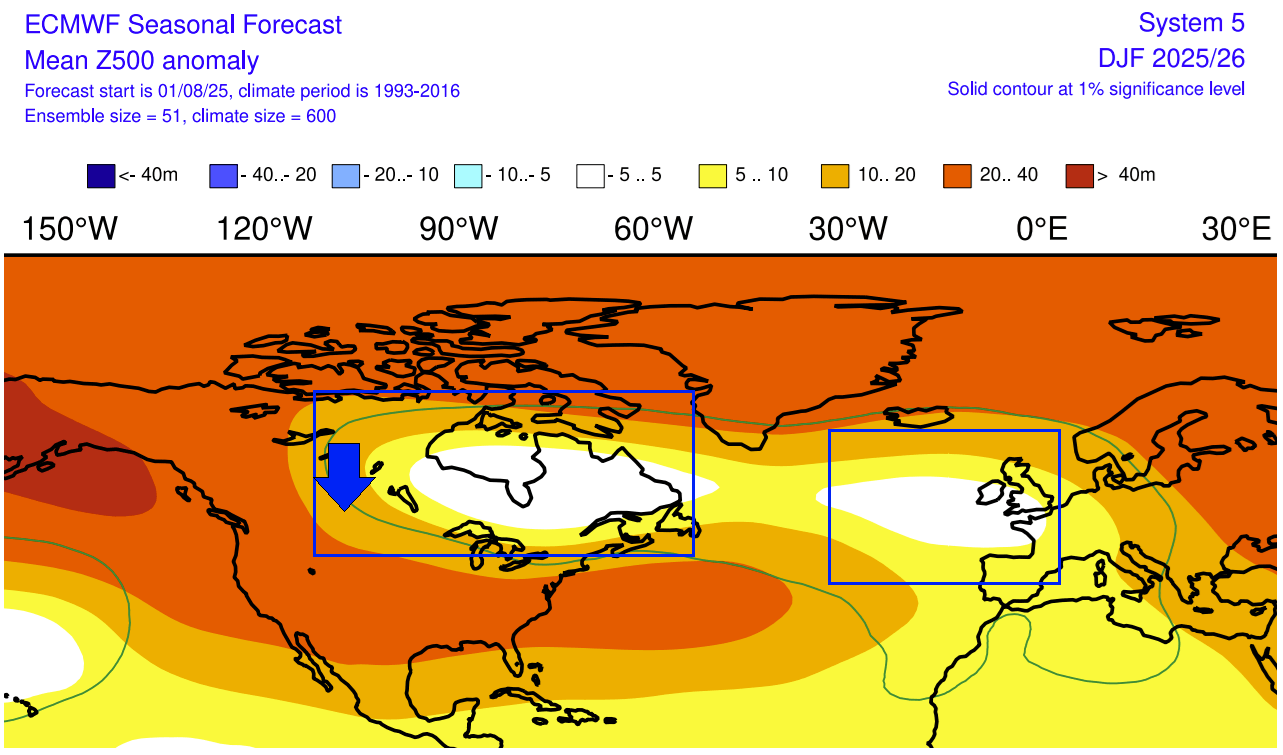
Such a pressure pattern pushes the jet stream into the northern and northwestern United States, and enables a northerly flow into the northern and east-central United States. Over Europe, this usually brings a more southerly flow, except over the UK.
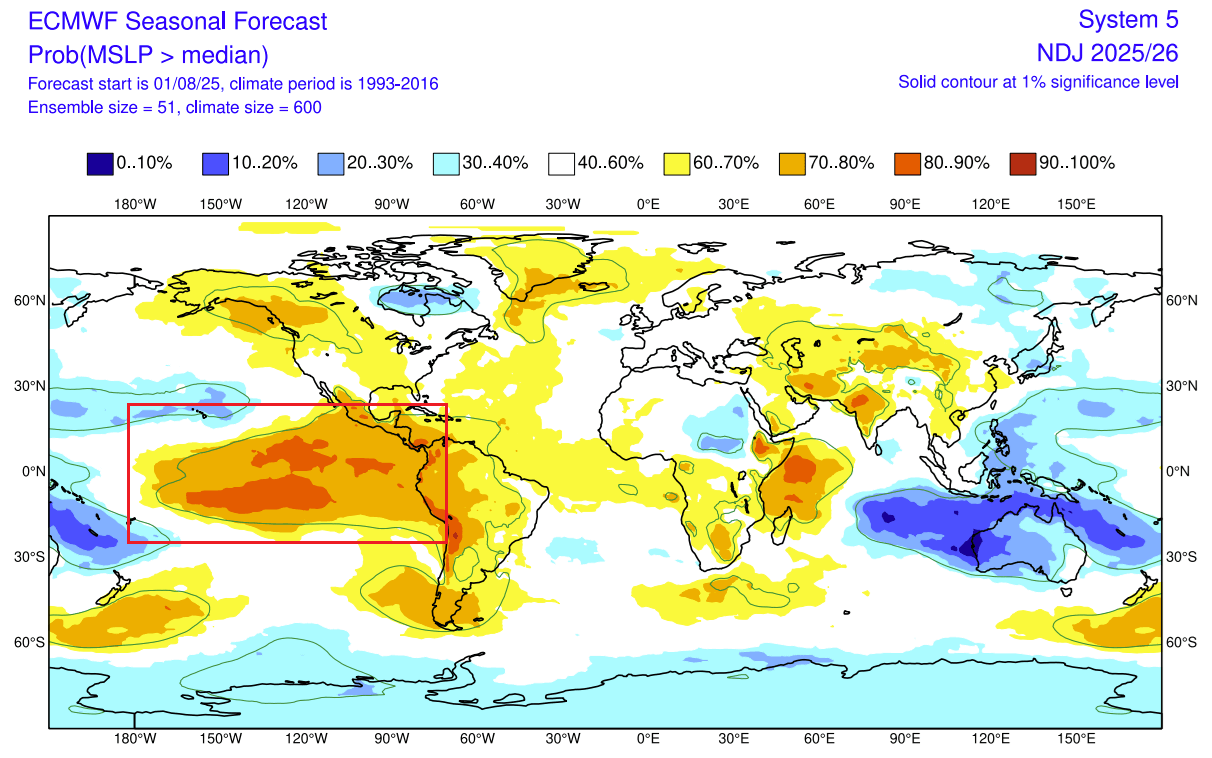
The surface pressure anomaly also indicates an expected La Niña pattern over the tropical Pacific. A broad high-pressure area is forecast over the ENSO regions. This is a sign that confirms the La Niña influence on the tropical surface-level circulation and its presence in the atmosphere.
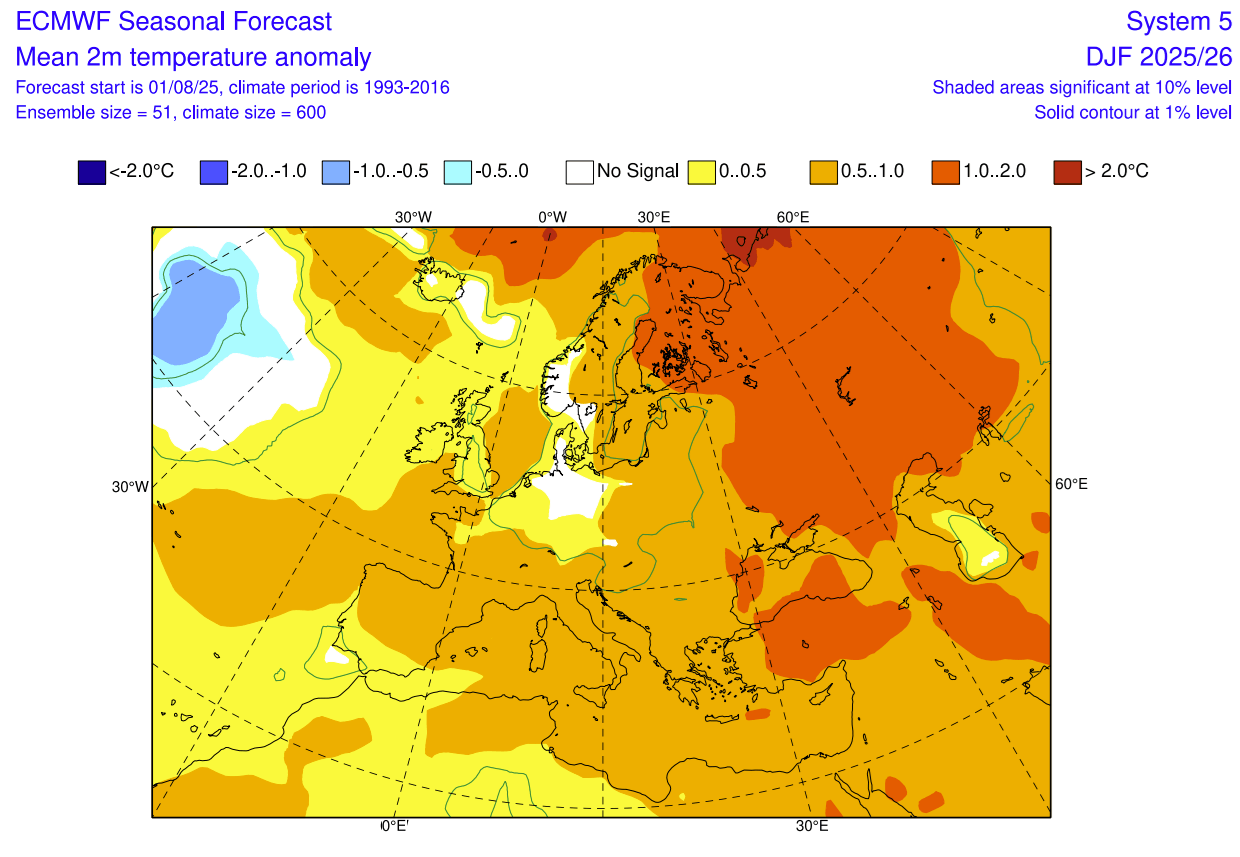
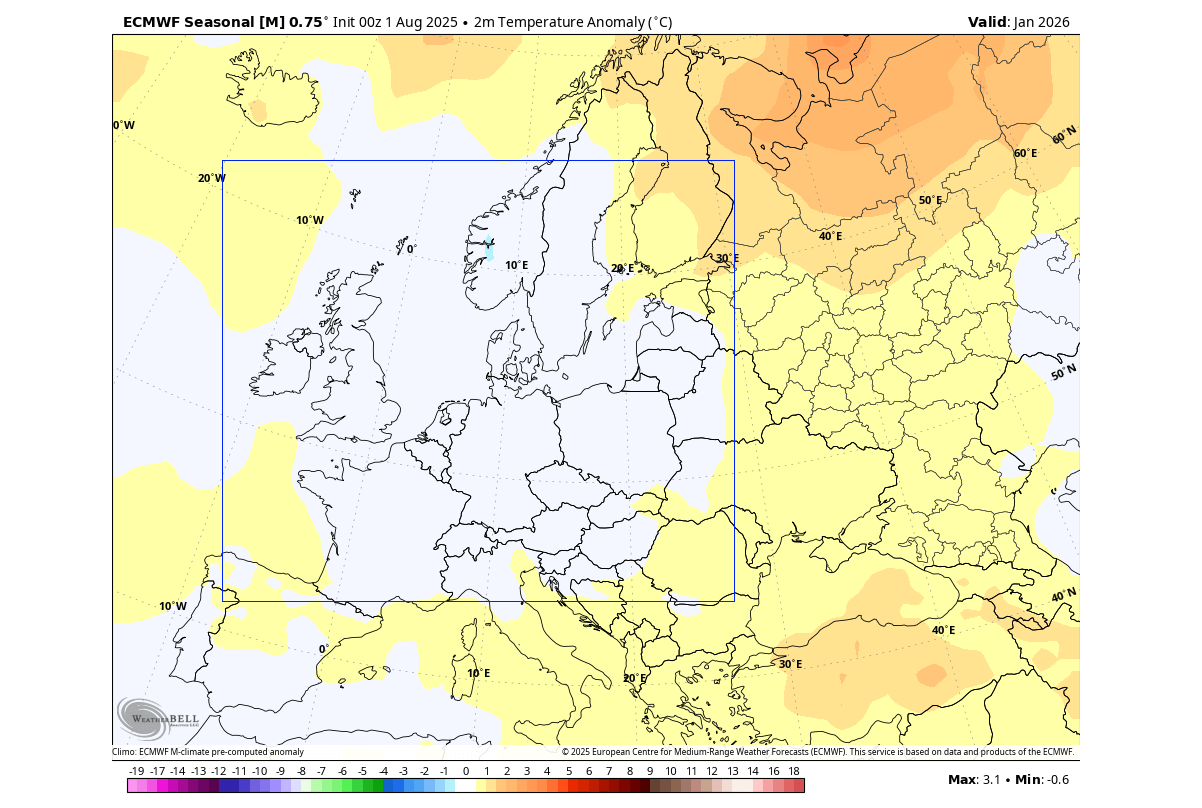
Looking at the surface temperature forecast over Europe, we see an expected pattern based on the low-pressure anomaly in the Atlantic. Most of the continent is warmer than normal, under the influence of the southerly flow due to the low-pressure area, except for a central area. But more on that area later.
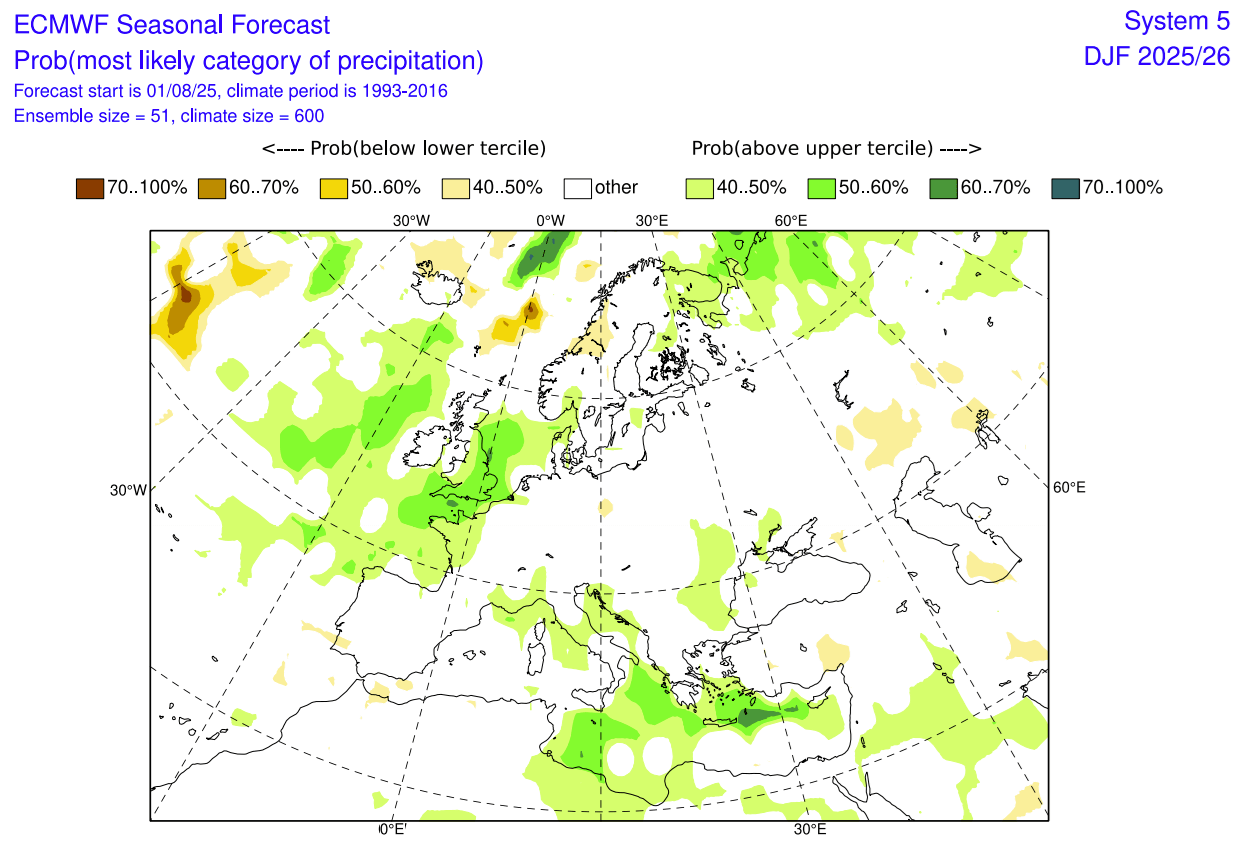
The precipitation forecast for Europe shows more precipitation over the northwest, due to the low-pressure area, and also over the south. The mainland is mostly forecast to have normal precipitation amounts.
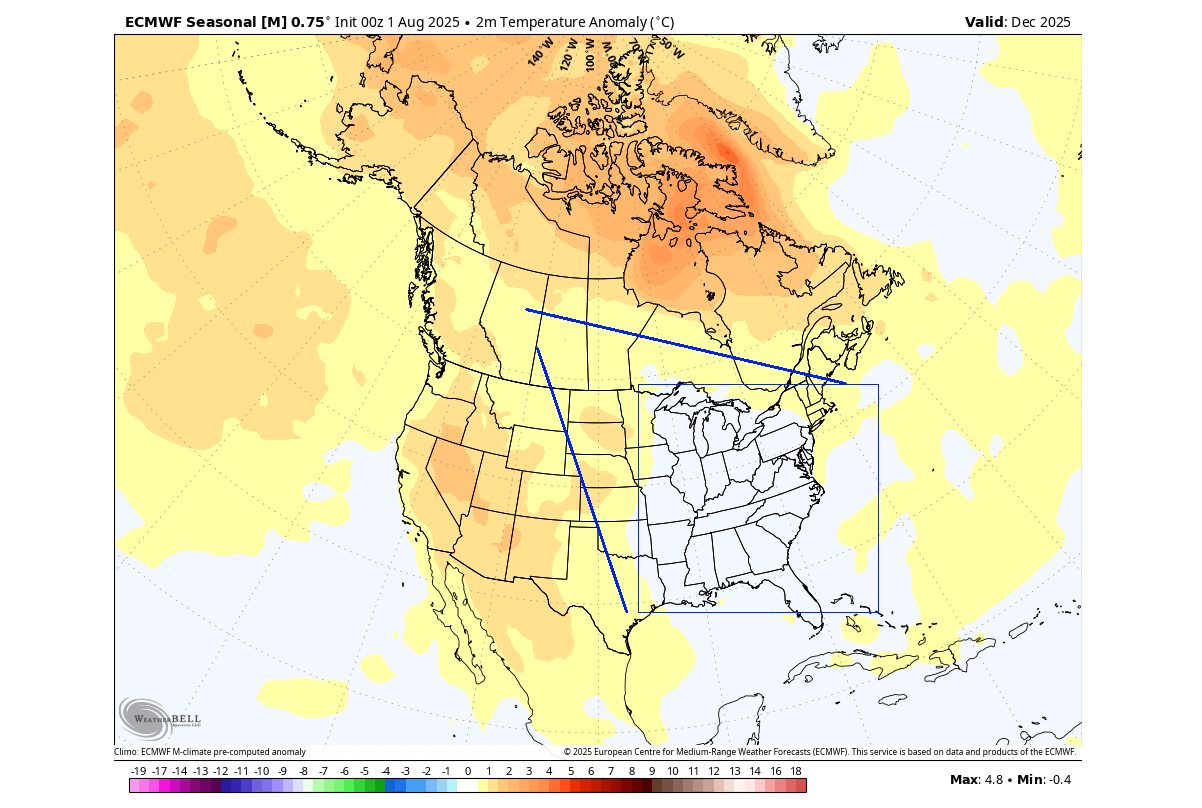
Over North America, the ECMWF winter forecast shows mostly warmer-than-normal temperatures over northern Canada, the southern and western United States. The warm anomaly gets weaker toward the eastern United States and southern Canada. But winter temperatures are usually always forecast too warm in August runs, so this is a good start for a potentially colder winter pattern.
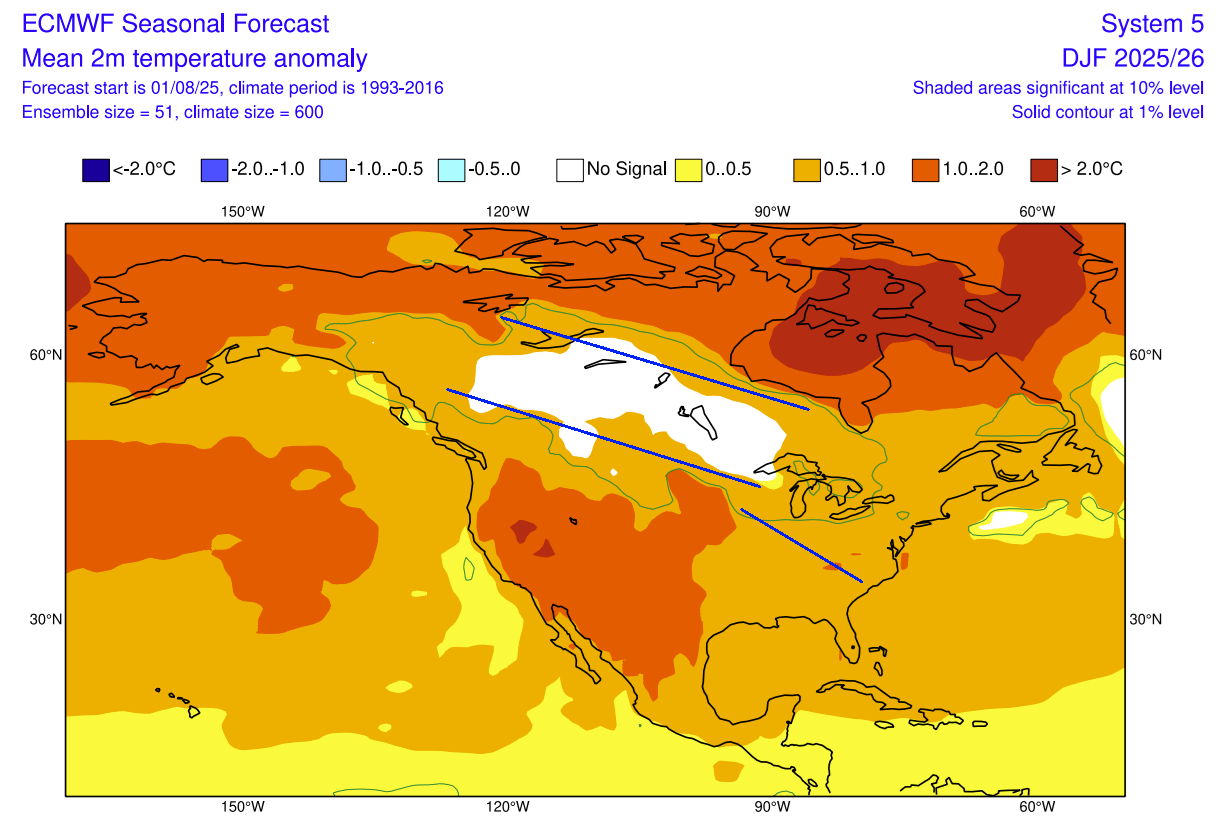
The blue lines show a beak in the warm anomalies, and based on the pressure pattern, it is the most likely path of colder air from the southern Canada cold pool into the central and eastern United States.
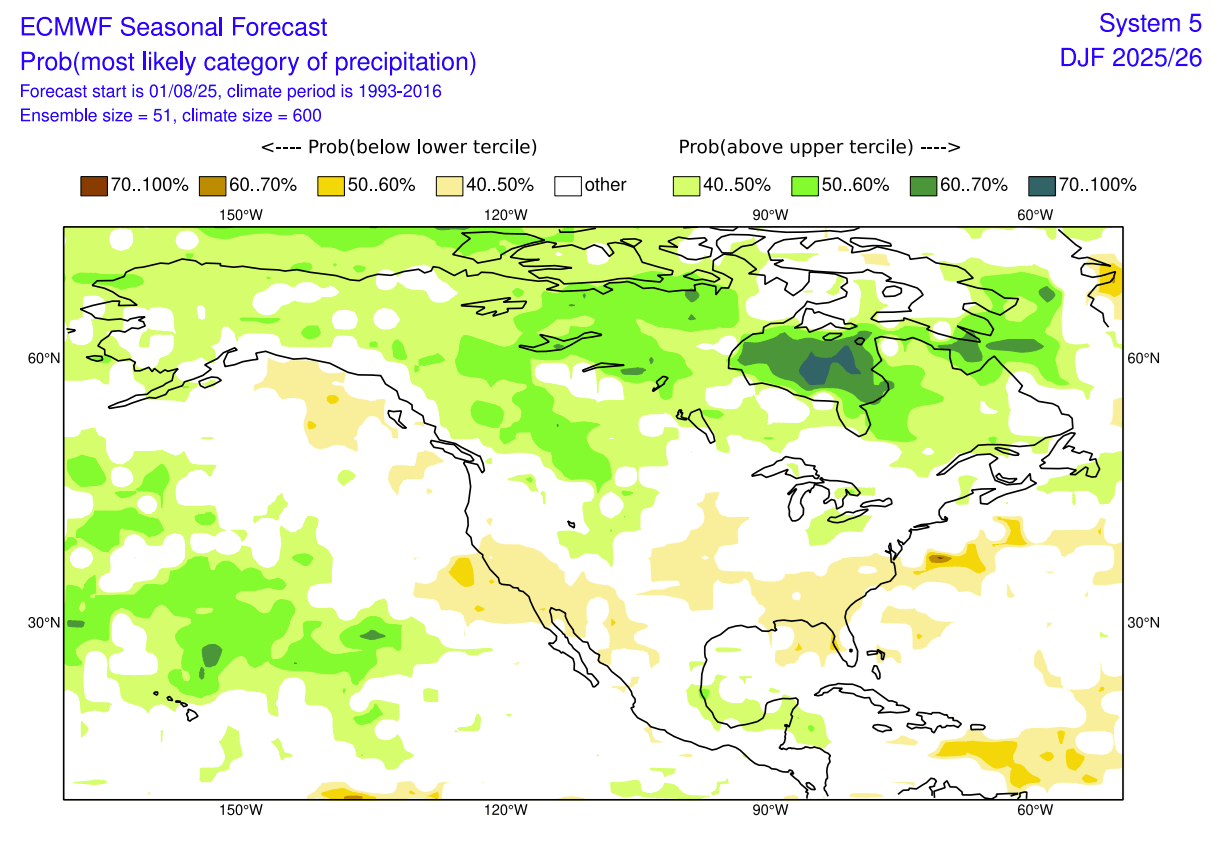
The latest precipitation anomaly forecast again shows a La Niña-type pattern over North America. More precipitation is forecast over Canada and the northwestern and northeastern United States. Less precipitation is forecast over the southern United States, as is usually seen in a La Niña winter.
Because the precipitation forecast doesn’t tell us everything, we also produced snowfall forecasts from the seasonal forecast data.
WINTER 2025/2026 FIRST SNOWFALL FORECAST
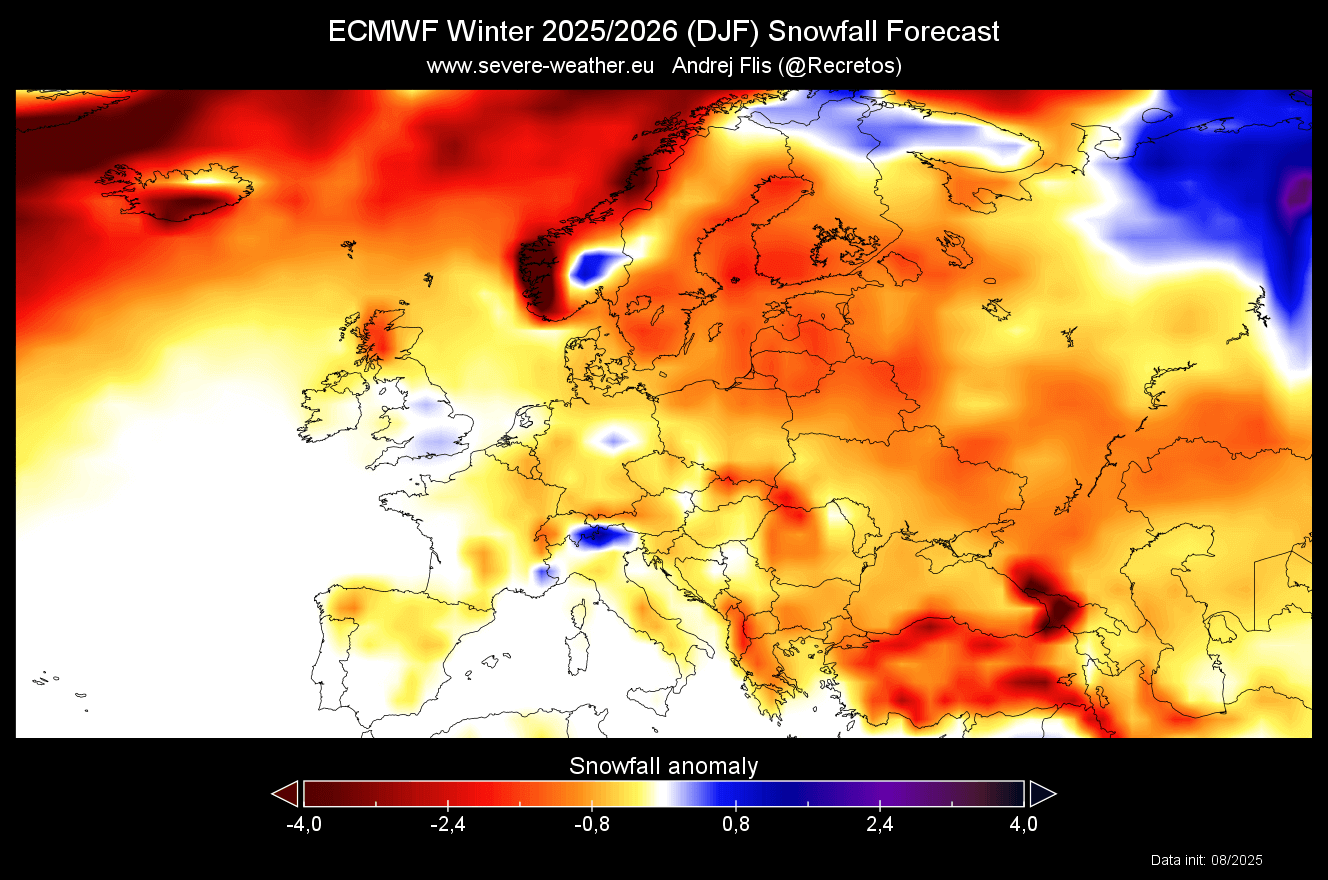
Below is a special snowfall forecast from the latest ECMWF data, which shows the winter snowfall anomaly. The actual values are not of much importance, as we are just looking at areas of more (or less) snowfall compared to a long-term average.
Looking over Europe, we see below-average snowfall. More snowfall than normal is forecast over some parts of Scandinavia. There are some breaks in the snowfall deficit over the central parts, but interestingly, more snowfall is forecast over the southern UK area.
We see an interesting forecast for North America. A lot of the United States is forecast to have below-average snowfall. This is perhaps a bit surprising, especially for the Midwest and the Northeast, which can get more snow in a weak La Niña winter.
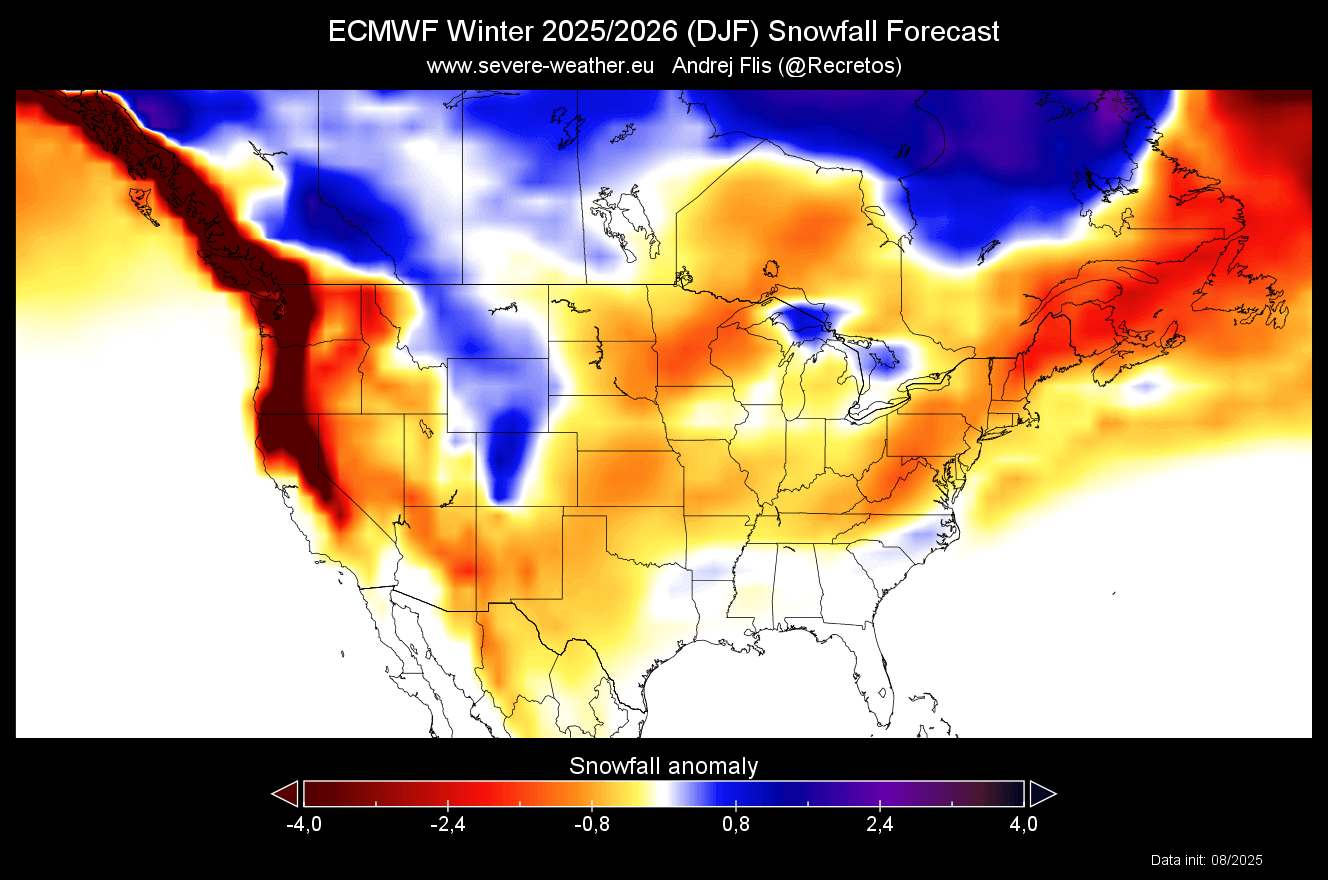
More snowfall is forecast for the states east of the Rockies and around the Great Lakes. More snowfall is also forecast over southwestern and north-central Canada.
Less snow over the United States can be a side-effect of usually too warm winter forecasts starting in August. Especially as the pressure pattern overall does allow for more snowfall over the Midwest and parts of the east-central United States.
We will soon release a special article dedicated to snowfall predictions. There, we will look at the snowfall potential in more detail and provide a month-by-month breakdown.
COLD WINTER MONTHS AHEAD?
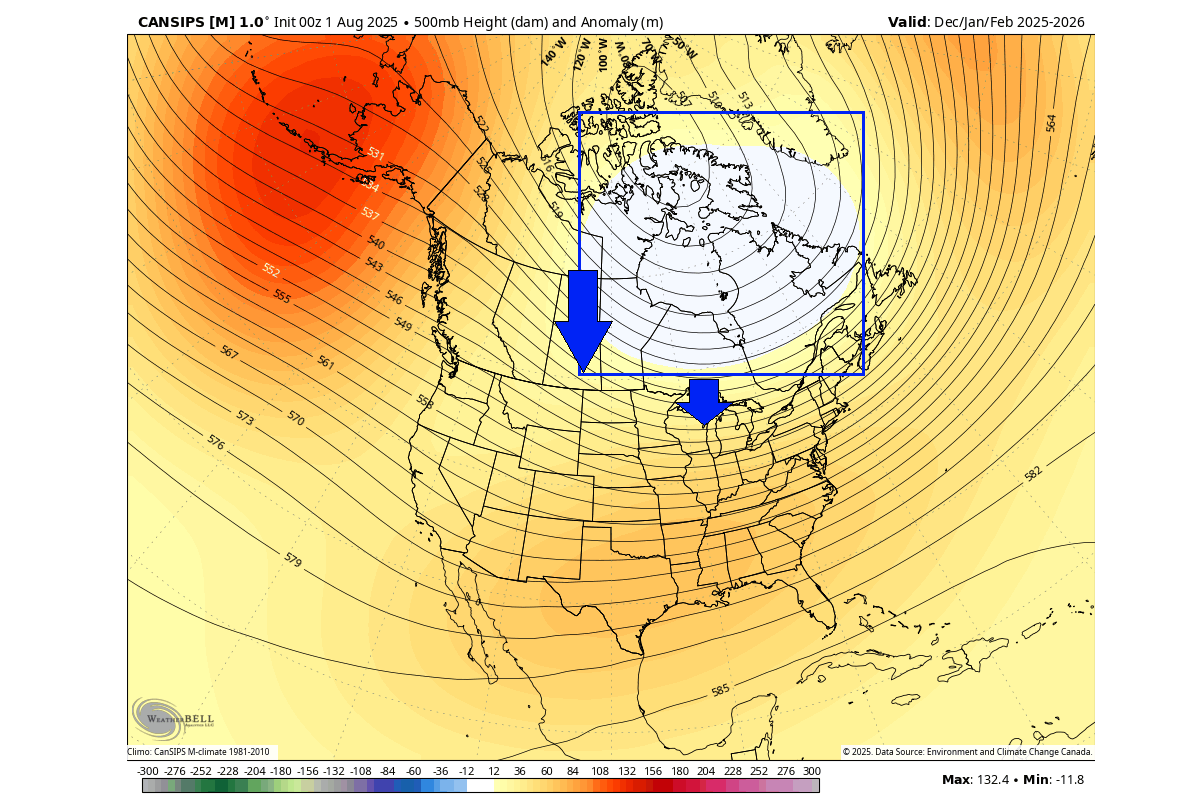
Looking at 3-month average forecasts can only tell us so much. There is a lot of variety within that period for each month. Below is the monthly forecast data, and it shows some really exciting results. First, we have the December 2025 pressure forecast for North America. You can see the high-pressure anomalies over the polar regions, a sign of a weaker Polar Vortex.
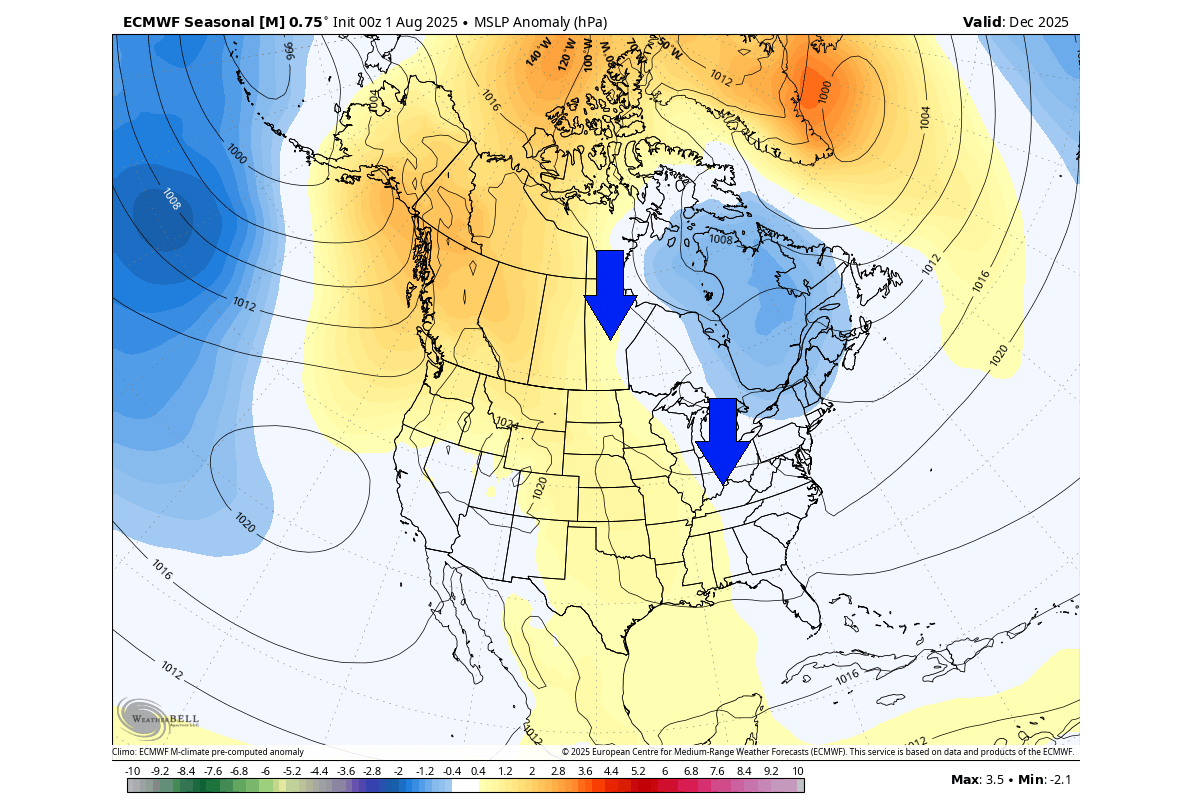
A low-pressure anomaly is forecast over eastern Canada, creating a northerly flow as it spins counterclockwise. If the airmass over Canada is cold enough, this can bring some colder days and snowfall into the central and eastern United States this December.
The temperature forecast does not show a clear, broad cold anomaly, but we can see the typical pattern of a cold corridor, which is supported by the pressure pattern. You can see that the eastern United States shows no warm anomaly, which is an indication in itself. This indicates a northerly flow, resulting from the low-pressure area over eastern Canada.
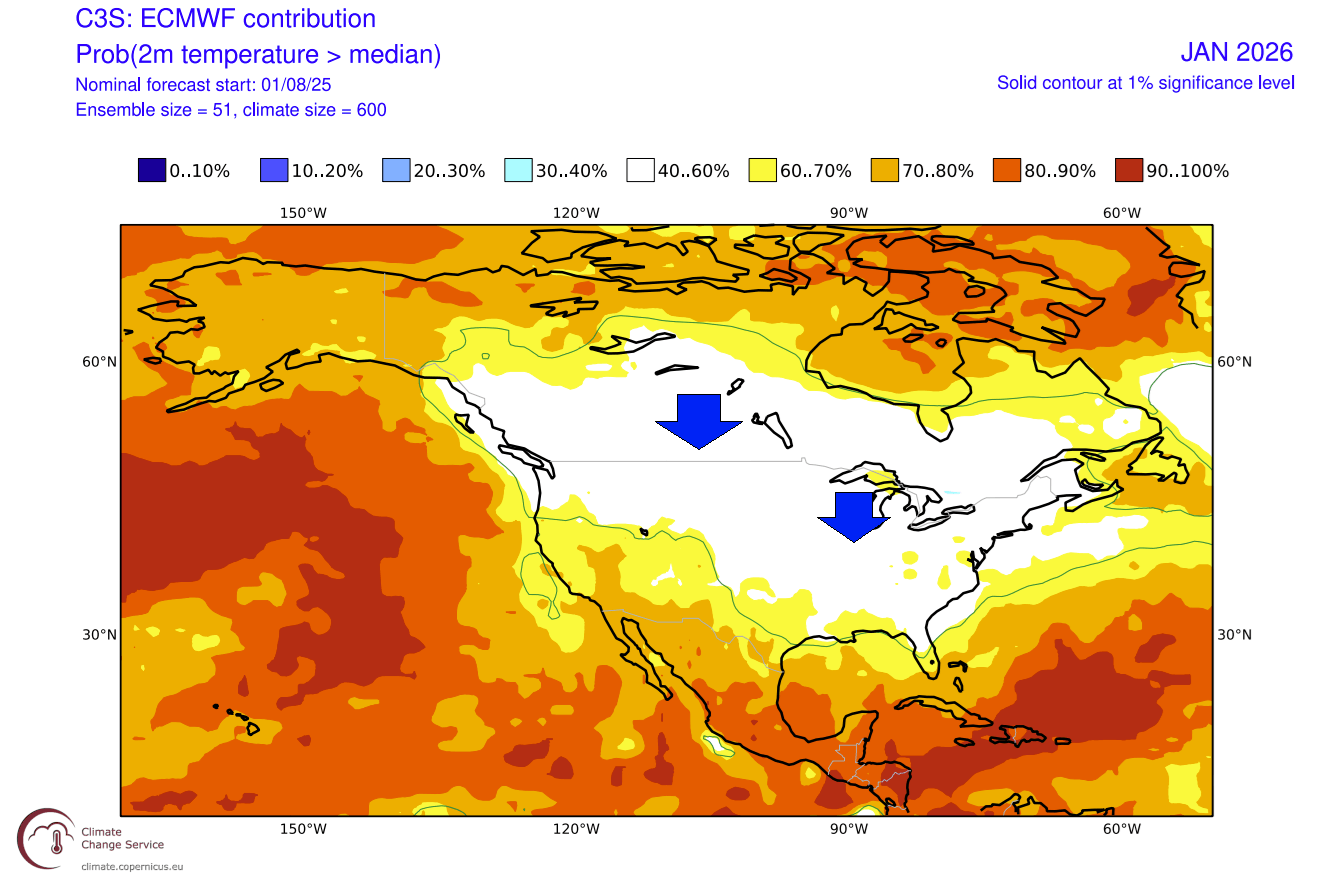
Below is a single-month forecast for January 2025, and it shows much less warm anomaly areas both over the United States and southern Canada. This indicates further expansion of the northerly flow, bringing the potential for some colder winter days to a large part of the United States.
Looking at Europe, the most interesting month in the winter forecast is January 2026. Below is the pressure forecast, which shows a broad high-pressure blocking pattern over the north. As an anticyclone spins clockwise, this means a colder northerly to northeasterly flow across the continent, transporting a colder airmass.
We can see this on the temperature forecast below, which shows normal to colder temperatures over a large part of northern, central, and western Europe. The forecasts usually underestimate cold anomalies this far out, so it’s safe to assume such a pressure pattern would bring broad colder weather over the marked area.
The high-pressure blocking over the polar regions is a clear sign of a weak or disrupted circulation and a weaker Polar Vortex, as the forecast indicates.
A weaker Polar Vortex is usually much more prone to a full-scale collapse due to increased pressure and temperature in the stratosphere, as shown earlier above. This can be a main event of the Winter season down the line, bringing or extending cold days and snowfall across several weeks into Spring.
CANSIPS WINTER FORECAST
As you can never trust a single forecast model, we often use the Canadian CanSIPS model as its forecast extends far ahead to cover the whole winter season, allowing an early winter outlook.
This December-February forecast shows a weak La Niña pattern, which we have already seen in the previous model forecast. A high-pressure zone sits over the North Pacific and the Aleutians, with a low-pressure area indicated over eastern Canada, driving a northerly flow into the United States.
With a strong pair of high and low-pressure zones in the North Pacific and over eastern Canada, this helps to recurve the jet stream and drive colder air down into the United States.
You can see that over North America, as the forecast shows above-normal temperatures across the southern half of the United States. But it shows a large area of colder temperatures across southern Canada and extending into the northern United States.
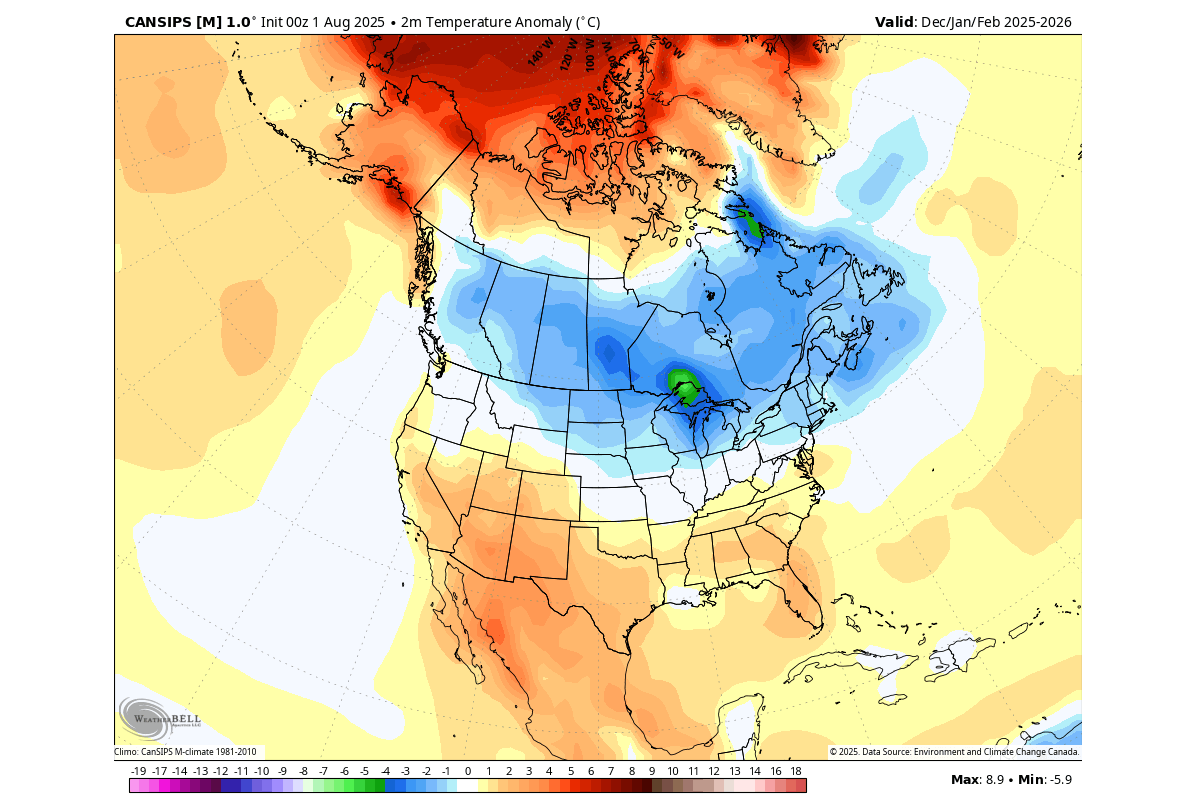
This is the direct result of an amplified northerly flow from Canada, driven by the strong pressure difference between the North Pacific and Canada, disrupting the jet stream pattern.
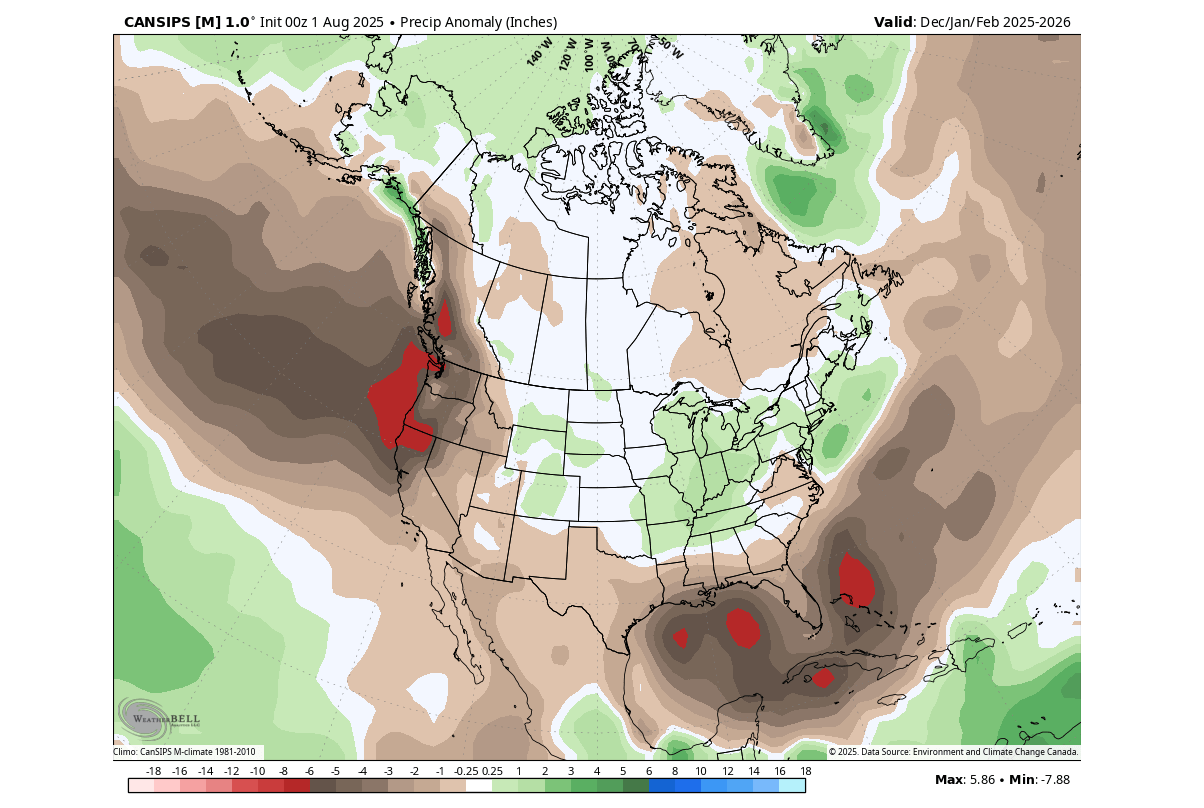
The precipitation forecast shows less precipitation over the western and far southern United States and Canada, while more precipitation is forecast for the central and eastern United States.
With the colder air being transported into the northern United States, this model forecasts an abnormal snowfall potential over the northern Plains, the Midwest, and the northeastern United States.
WINTER 2025/2026 OFFICIAL OUTLOOK
Below is the NOAA/CPC official Winter 2025/2026 temperature forecast for the United States. It shows the winter temperature probability, with colder chances in the northern United States. The southwestern part of the country and the east coast have a higher probability of warmer-than-normal weather.
But take note of the trough of “equal” temperatures extending down low into the Midwest and central states. That can be interpreted as a potential route of winter cold air outbreaks from the north into the east-central United States, confirming that a more northerly flow is expected over the winter.
The official precipitation forecast also shows a classical La Niña pattern. We see an equal-to-high probability of more precipitation (and snowfall) over the northern half of the United States. The southern United States is forecast to have a drier-than-normal winter season.
In a typical La Niña winter, we can often observe persistent drought conditions in the south and southwest.
We will keep you updated on the developing weather trends in the coming seasons, so make sure to bookmark our page. Also, if you have seen this article in the Google App (Discover) feed, click the like button (♥) or add us to preferred sources there to see more of our forecasts and our latest articles on weather and nature in general.
Don’t miss:
Large-scale Stratospheric wind shift could trigger a Colder, Snowier Winter 2025/2026