A strong oceanic anomaly is spreading across the North Pacific, bringing warmer ocean temperatures all the way to the west coast of the United States. This is a large anomaly area, which has occurred a few times before, and it typically indicates that a colder winter is coming for the United States, Canada, and sometimes Europe.
The ocean anomaly area is larger this year than in a very long time, which raises questions, if perhaps a stronger Winter 2025/2026 could be developing?
First, we will quickly look at the anomaly in the North Pacific and how it’s evolving over time. Then we will look at some colder winters with similar ocean conditions, and find hints for the upcoming Winter 2025/2026.
AN OCEAN-ATMOSPHERE BRIDGE
The heatwaves in the ocean are better known as marine heatwaves. These marine heatwaves are defined when temperatures are much warmer than normal for an extended period of time. They can have significant impacts on marine ecosystems and also on the medium and long-range weather development.
These events typically form strong ocean contrasts, created by what is known as an “Atmospheric Bridge.” You can see this in the image below, which reveals the connection between the tropics and the North Pacific. It is opposite to what we have now, but the principle is the same. Pressure and wind patterns change, affecting the circulation and anomalies.

The map below shows the typical global areas where these ocean anomalies can occur. We will focus on the North Pacific today, as it is developing a new strong oceanic anomaly, and it has a known past role in shaping the seasonal winter weather across the United States, Canada, and down the line also in Europe.
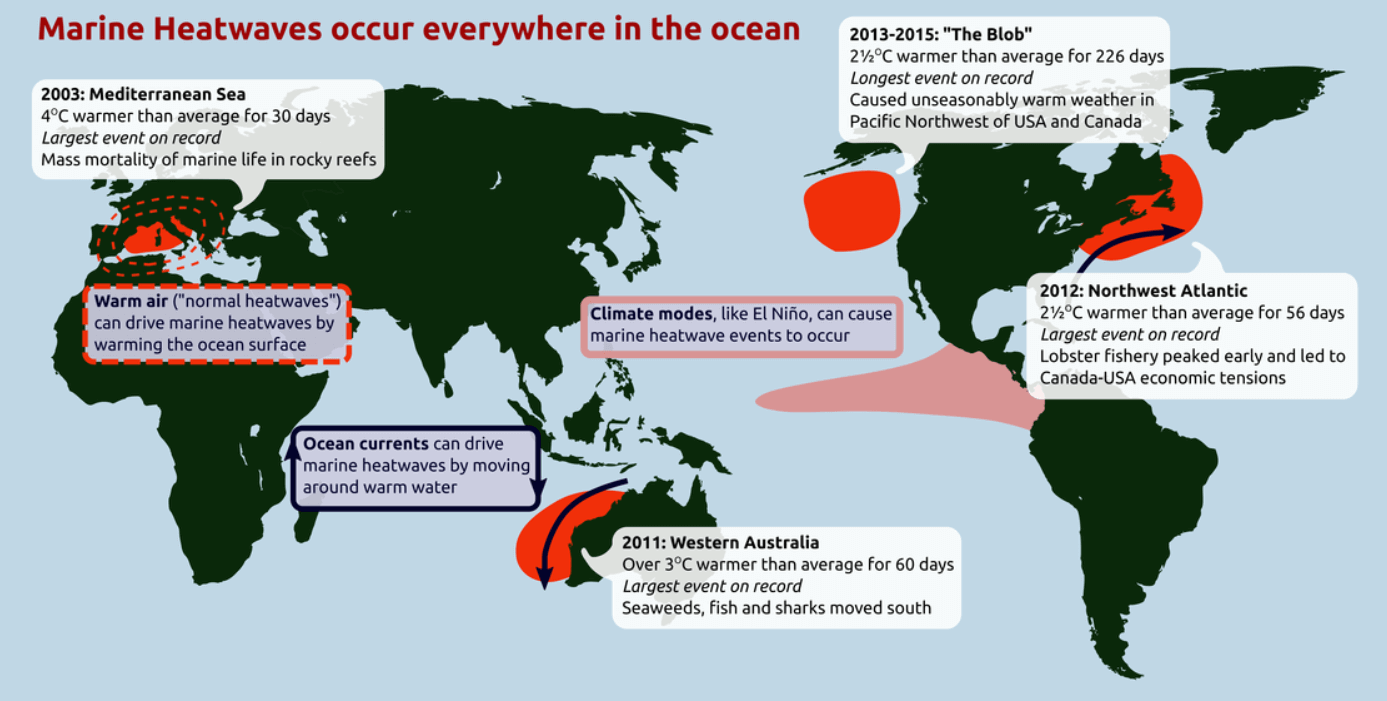
As you can see, the North Pacific’s strong warm anomaly from 2013 to 2015 was the longest such event to date. It also caused unseasonably warm weather in the Pacific Northwest of the United States and Canada, but also contributed to great cold and snow in the central and eastern United States.
Ocean anomalies can disrupt the movement of the pressure systems that drive temperature patterns and weather changes. Pairs of pressure systems are also known as Rossby Waves. The image below, by NOAA, shows an example of Rossby waves and how they are all connected and function with the jet stream.
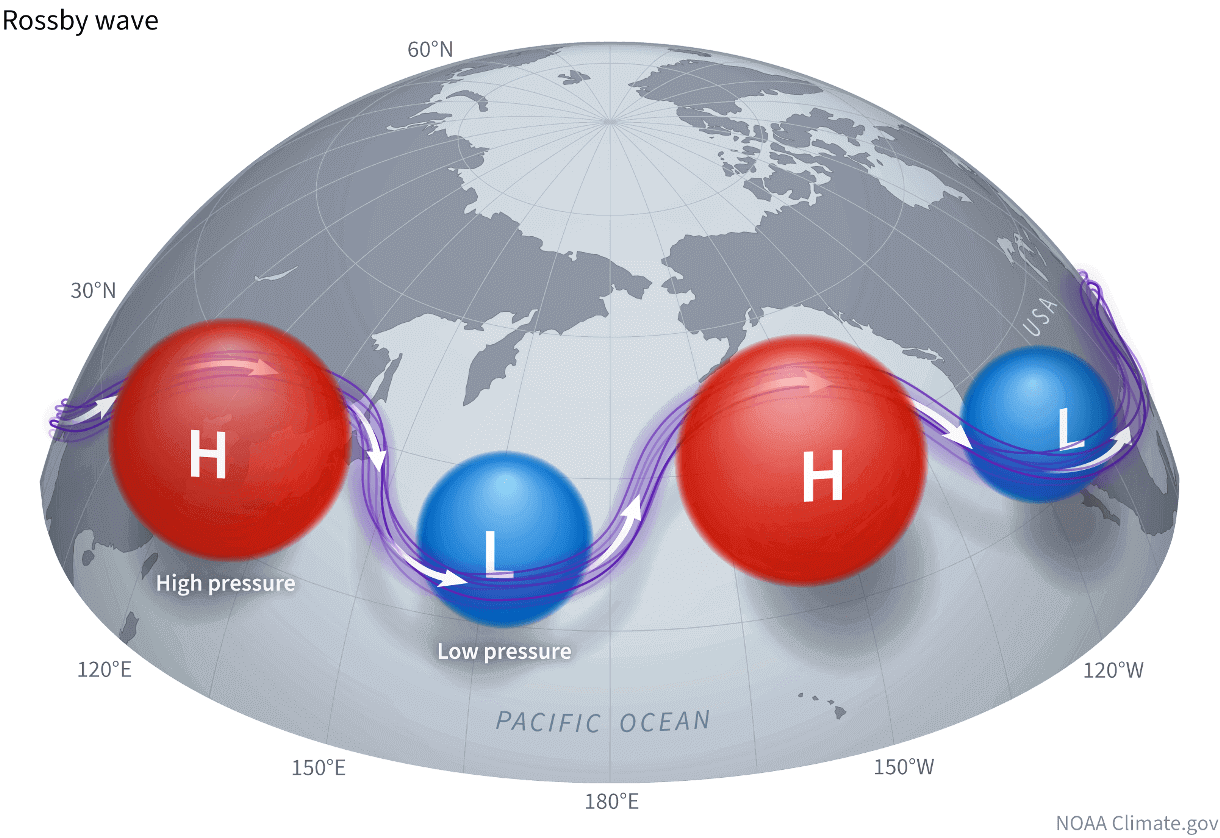
The purple line connecting these pressure systems is called the jet stream. This rapid stream of air is found at altitudes of 9 to 14 kilometers (6 to 9 miles) and helps shape the daily weather, also bringing disruptions from large ocean anomalies.
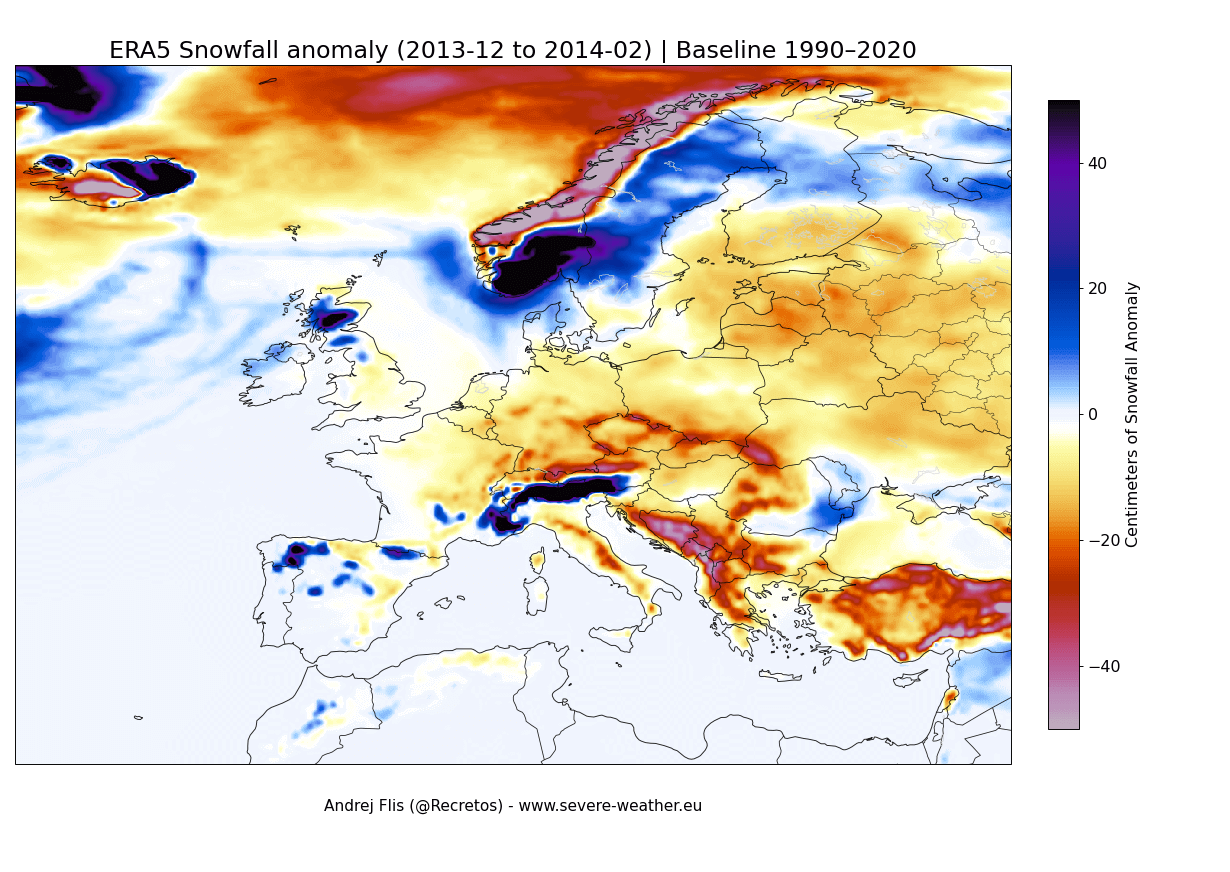
The image below shows the snowfall anomaly analysis for Winter 2013/2014 over the United States and Canada, during the North Pacific “warm blob”. You can see strong above-normal snow amounts that Winter, over the northern, central, eastern, and even southern United States. Above-normal snowfall was also observed over the Midwest and towards the northeast.
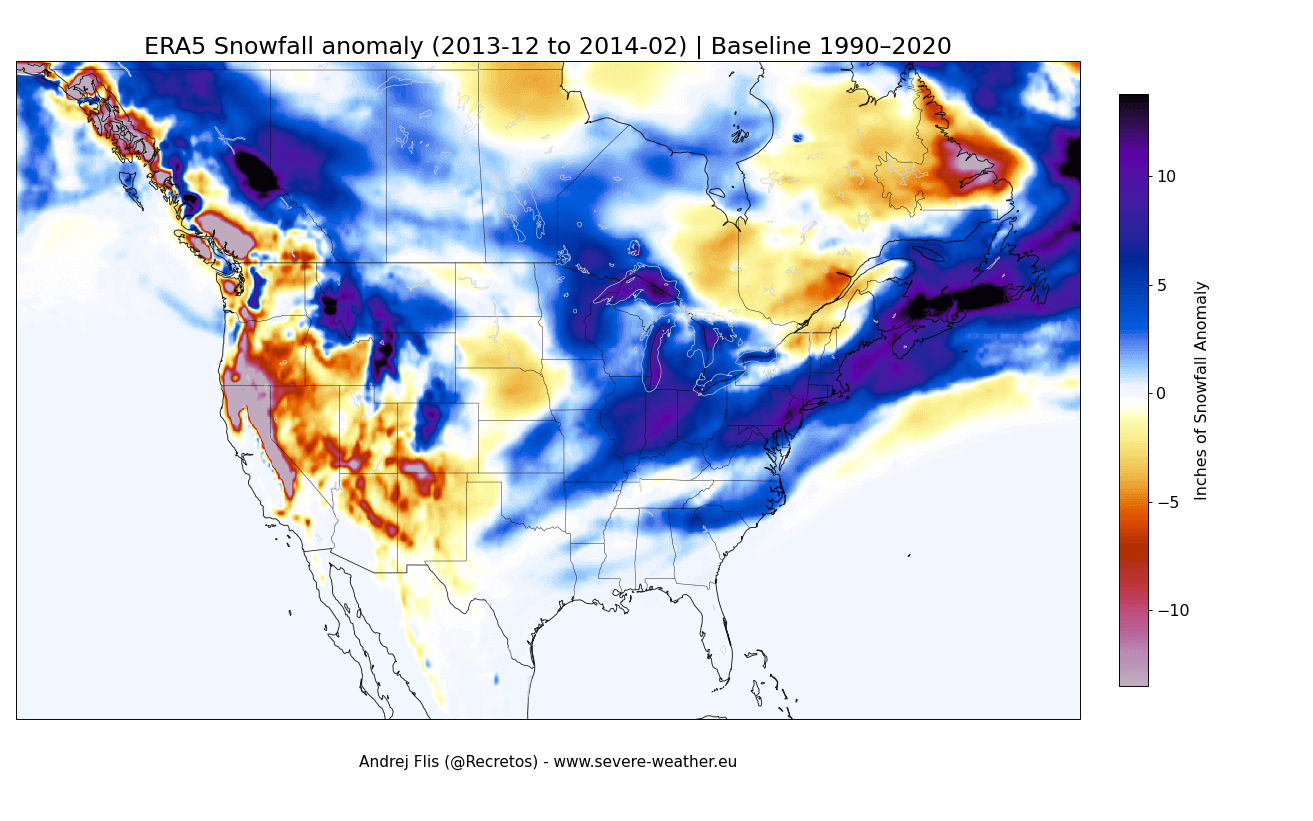
This was enabled by a change in the jet stream, also aided by North Pacific ocean anomalies, which pushed the jet stream further south than usual and brought a colder airmass in its wake. But of course, these changes work in both directions, bringing cold on one side, and pulling up warmer air downstream.
Over Europe, there was less snow over the continent that winter, with the exception of higher elevations. This is due to the abundant moisture and warmer air available from the Atlantic, but not enough cold air to lower the snowfall level, keeping plenty of snow in higher elevations.
But this is just a single winter example. We will now look at the current state and extent of the North Pacific Ocean anomaly, and then compare it to several past winters with similar conditions, and find clues for Winter 2025/2026, with a higher year count.
NORTH PACIFIC OCEAN ANOMALY
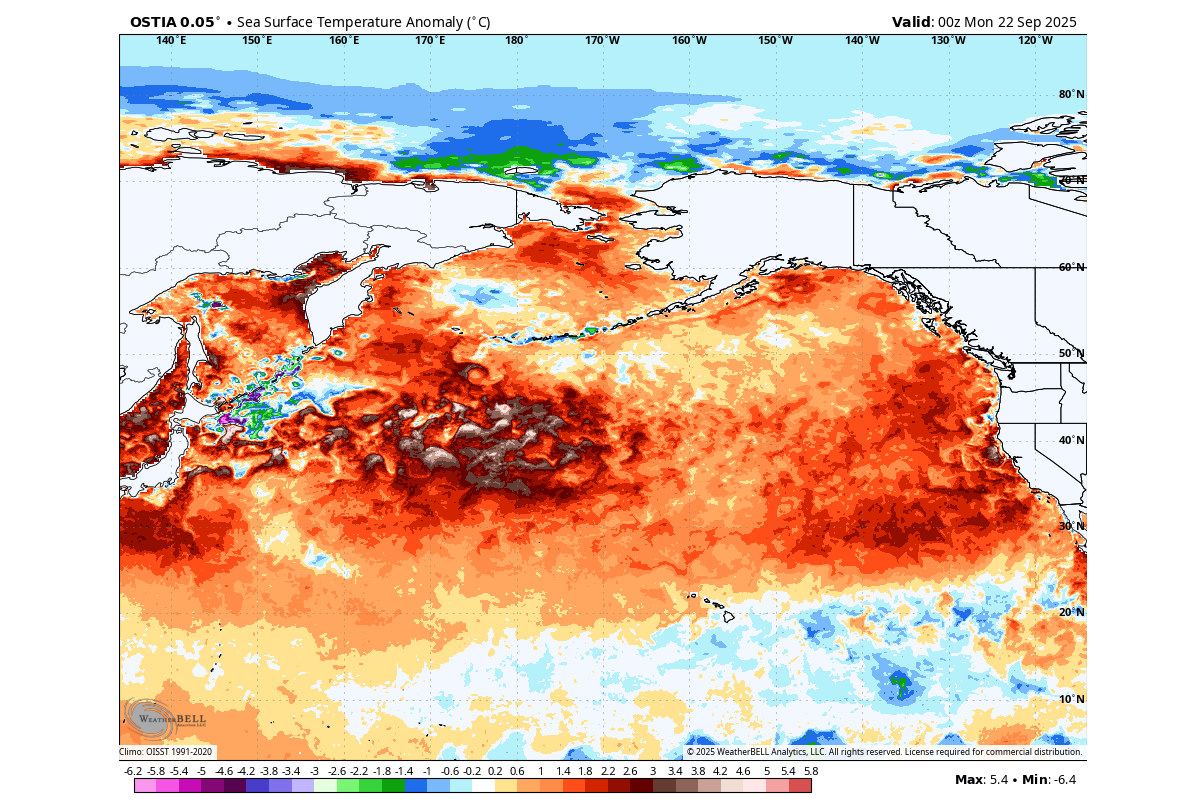
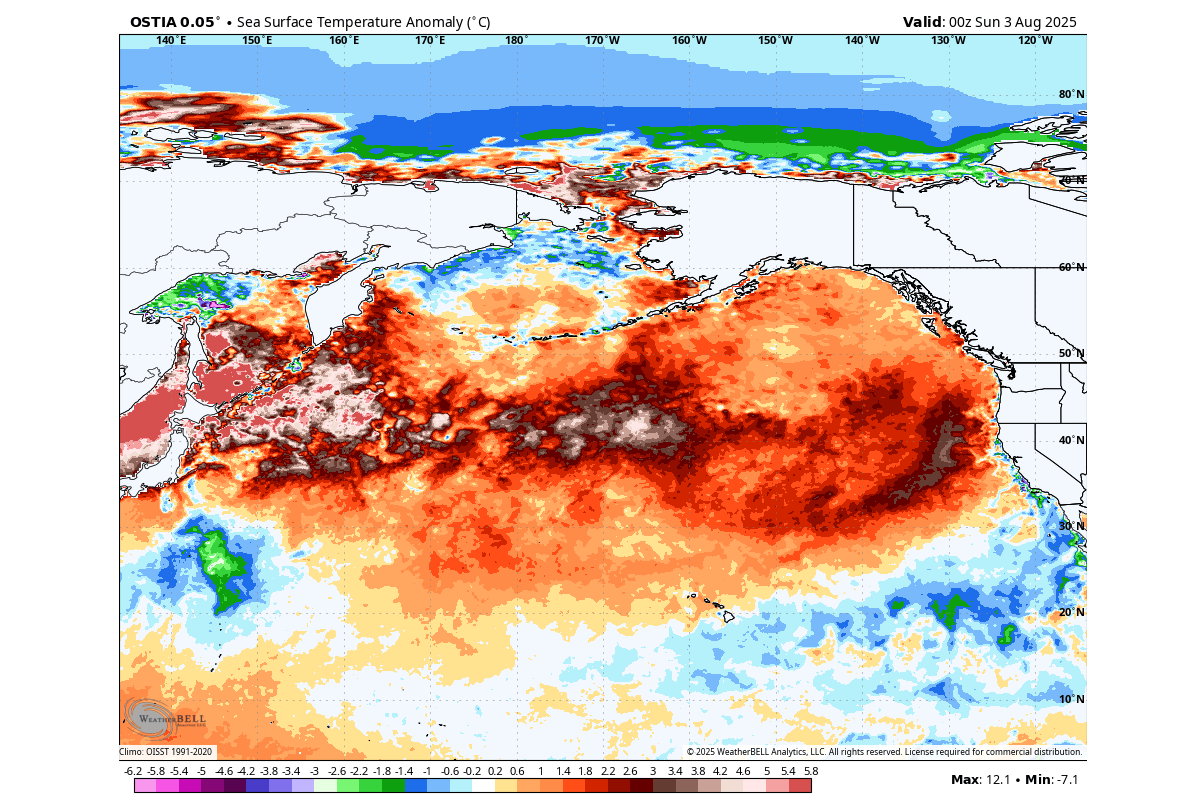
Looking first at the North Pacific ocean temperature anomaly, you can very nicely see the strong anomalies spreading across the whole region. Of interest are the anomalies closer to the west coast of the United States and the northeastern Pacific. This is the area of interest for potential winter impacts.
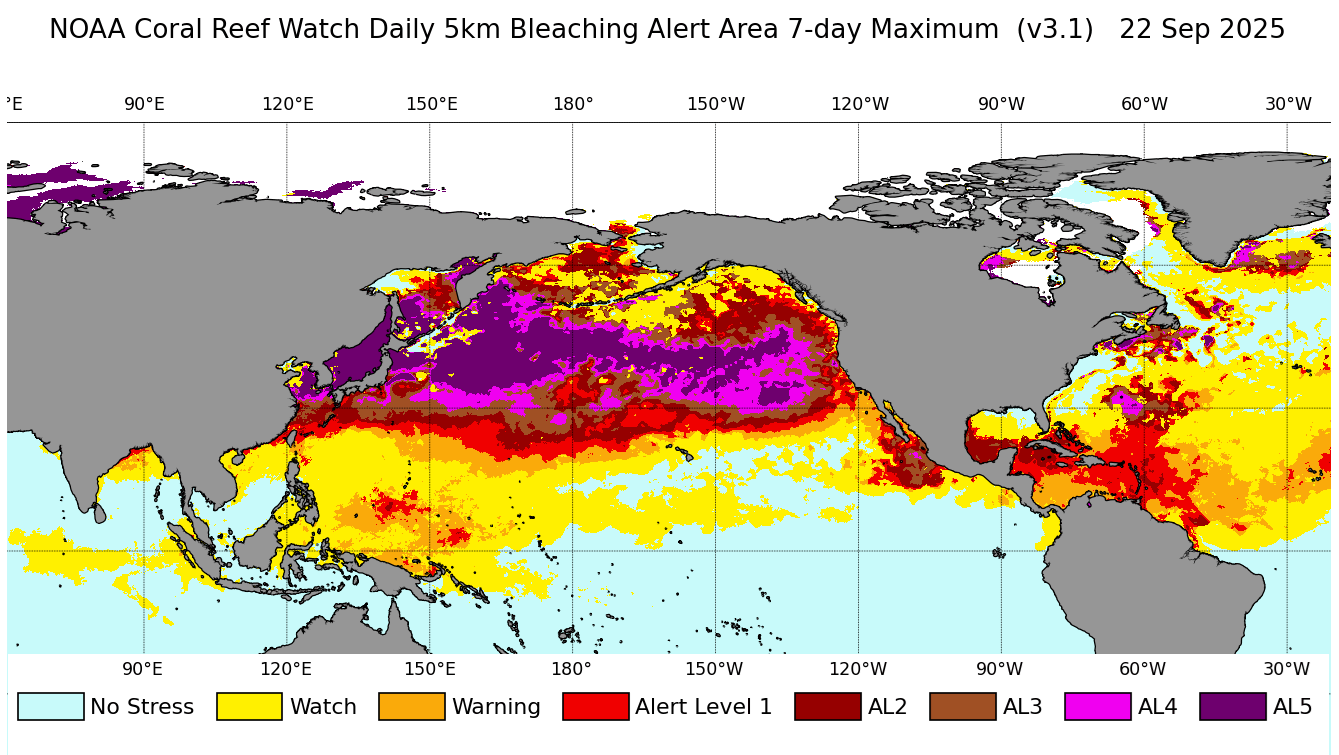
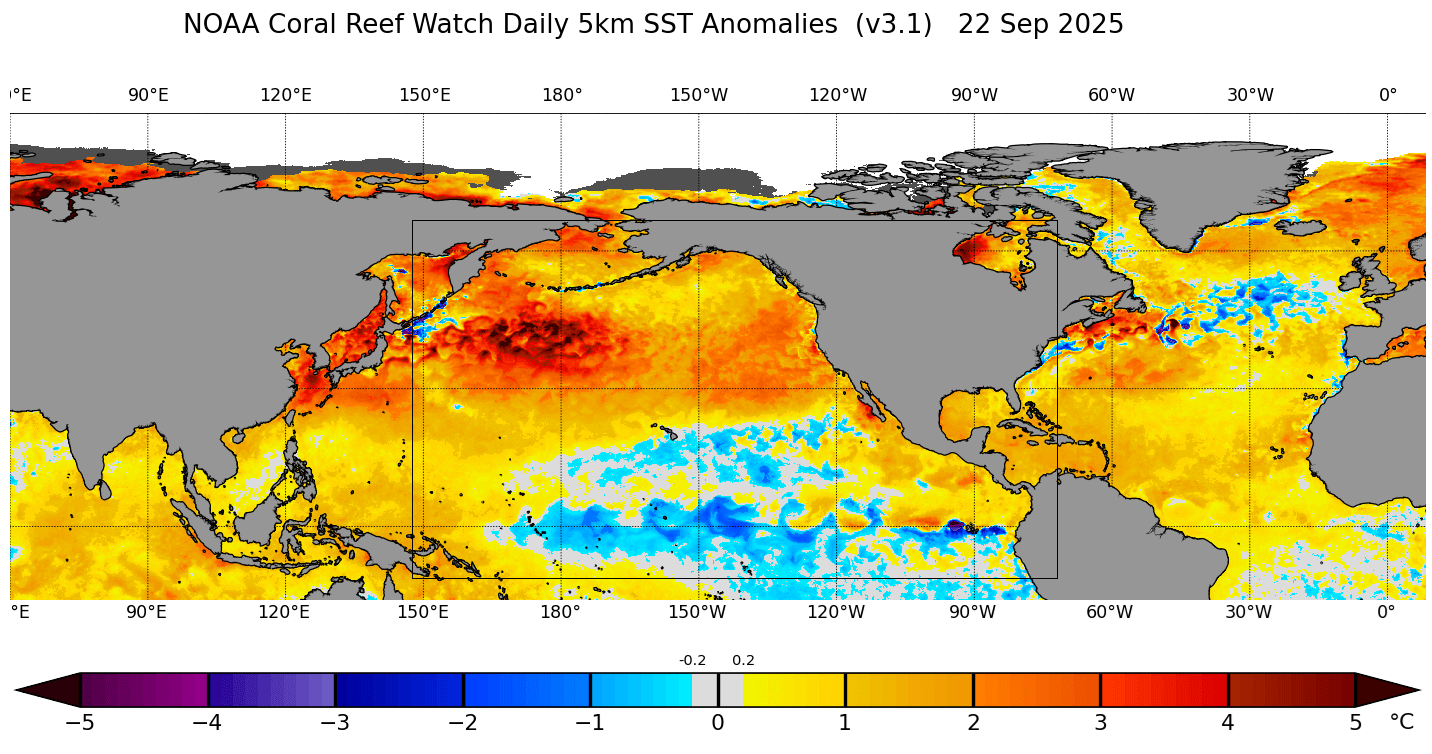
The coral bleaching alert system has also detected this North Pacific heatwave at the warning level for coral bleaching. But this is not a concern as the water there is deep, with no corals at the surface level. But it does highlight just how significant this anomaly truly is, covering the entire North Pacific.
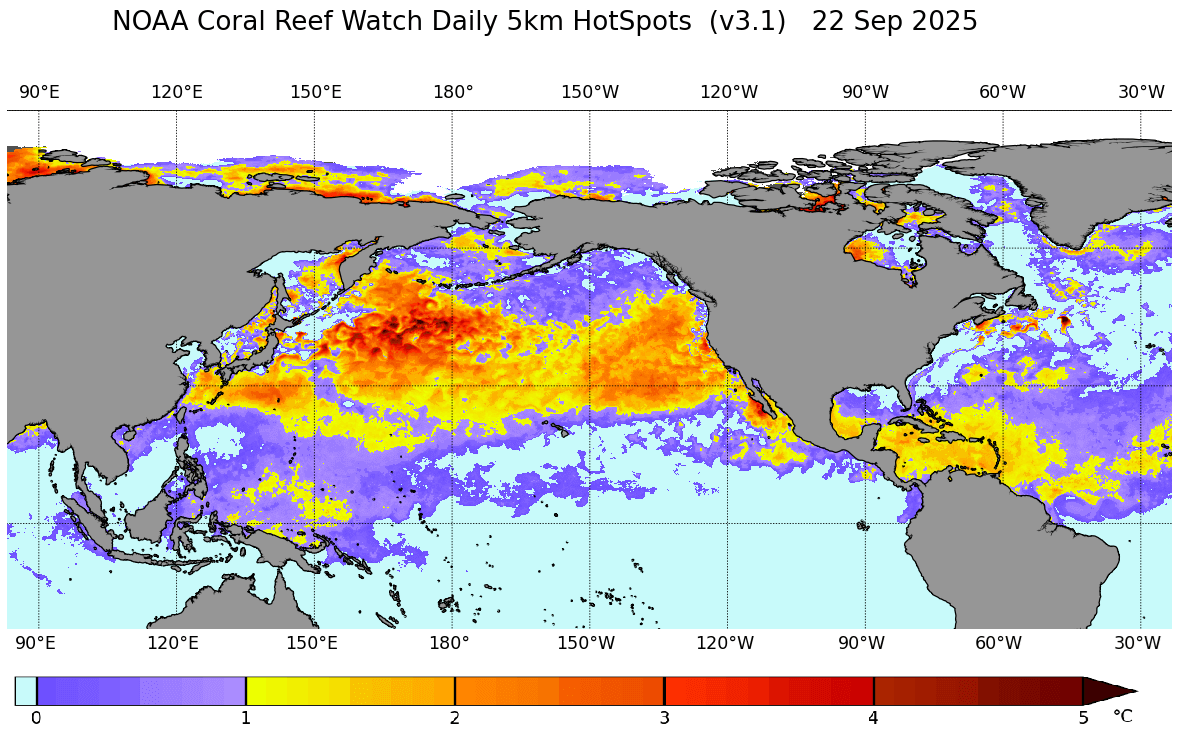
Below is another special product from NOAA Coral Watch, showing the daily hotspots. You can see just how large an anomaly the entire North Pacific is, which, at this point in early Fall, brings seasonal weather significance for the entire Northern Hemisphere, especially for the Winter 2025/2026 season.
This anomaly has been quite widespread over the north-central and northwestern Pacific for some time now. But the northeastern part of this “warm blob” began developing in August, reaching strong values and pushing the warm ocean wave all the way to the west coast of the United States.
Below is a video animation that shows just how rapidly this anomaly expanded across the North Pacific, all the way to the west coast of the United States and Canada. It now covers the whole of the North Pacific, which is a rather rare and significant event.
In the global picture, you can see a strong contrast between the North Atlantic and the tropics, where a weak La Niña event is trying to emerge. This is a nice example of an atmospheric bridge, with the seasonal setup starting to build for the upcoming cold weather season.
And speaking of the upcoming weather seasons, we can use this ocean anomaly pattern to look at some past years with the same anomaly, and how those winters turned out.
LONG-RANGE FORECAST
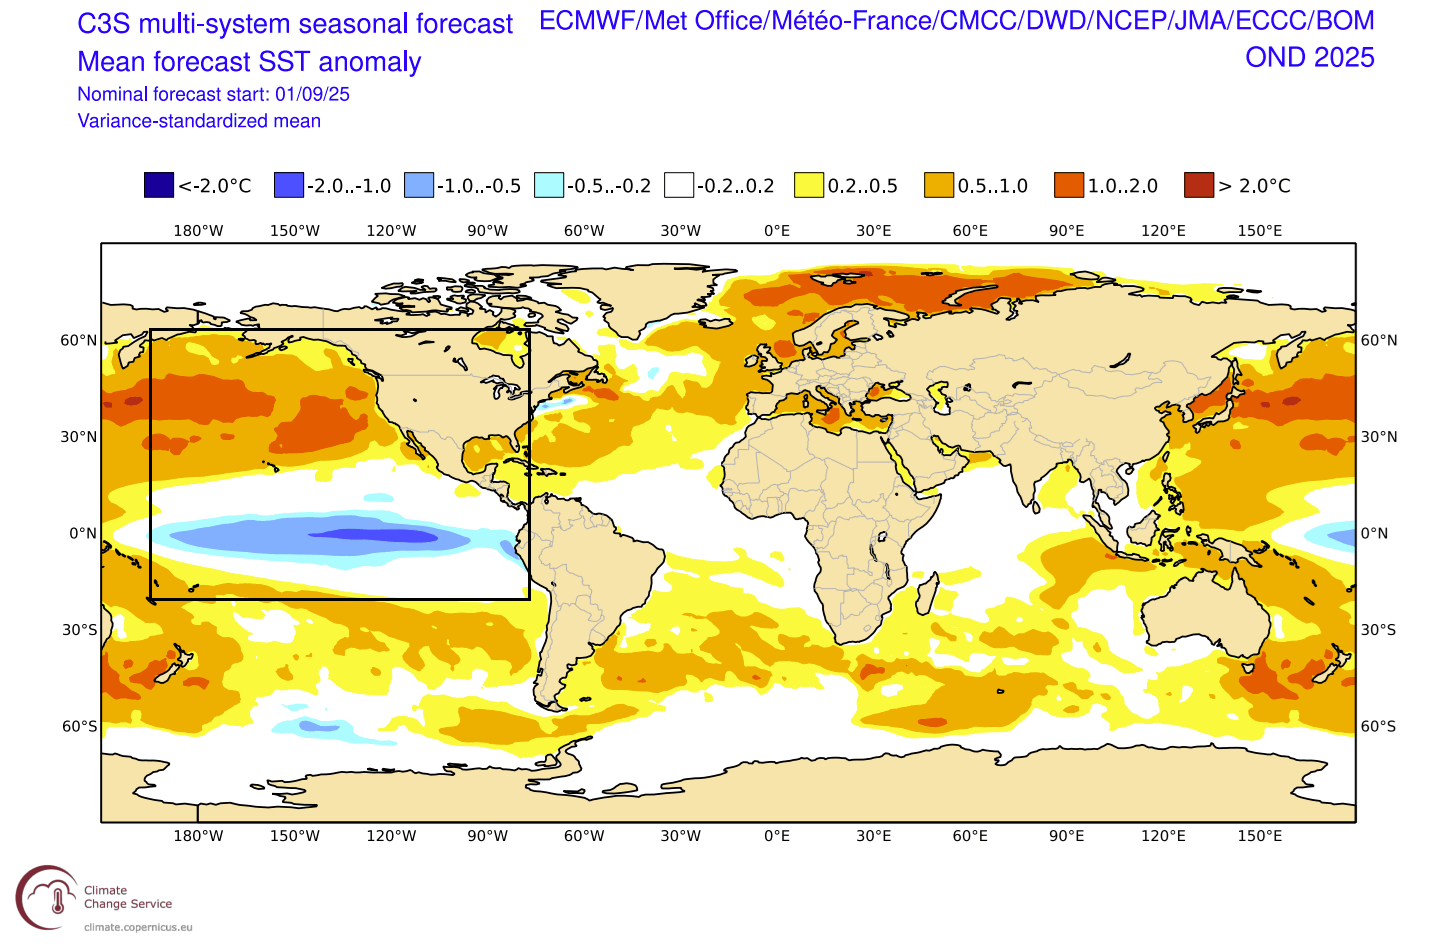
Before we can find past similar seasons, we have to first look at the long-range forecast to see what conditions and anomalies are expected on a global scale. Below is the C3S multi-model forecast, and it shows a continuation of this atmospheric bridge contrast, with warm anomalies in the North Pacific, and a weak La Niña underneath.
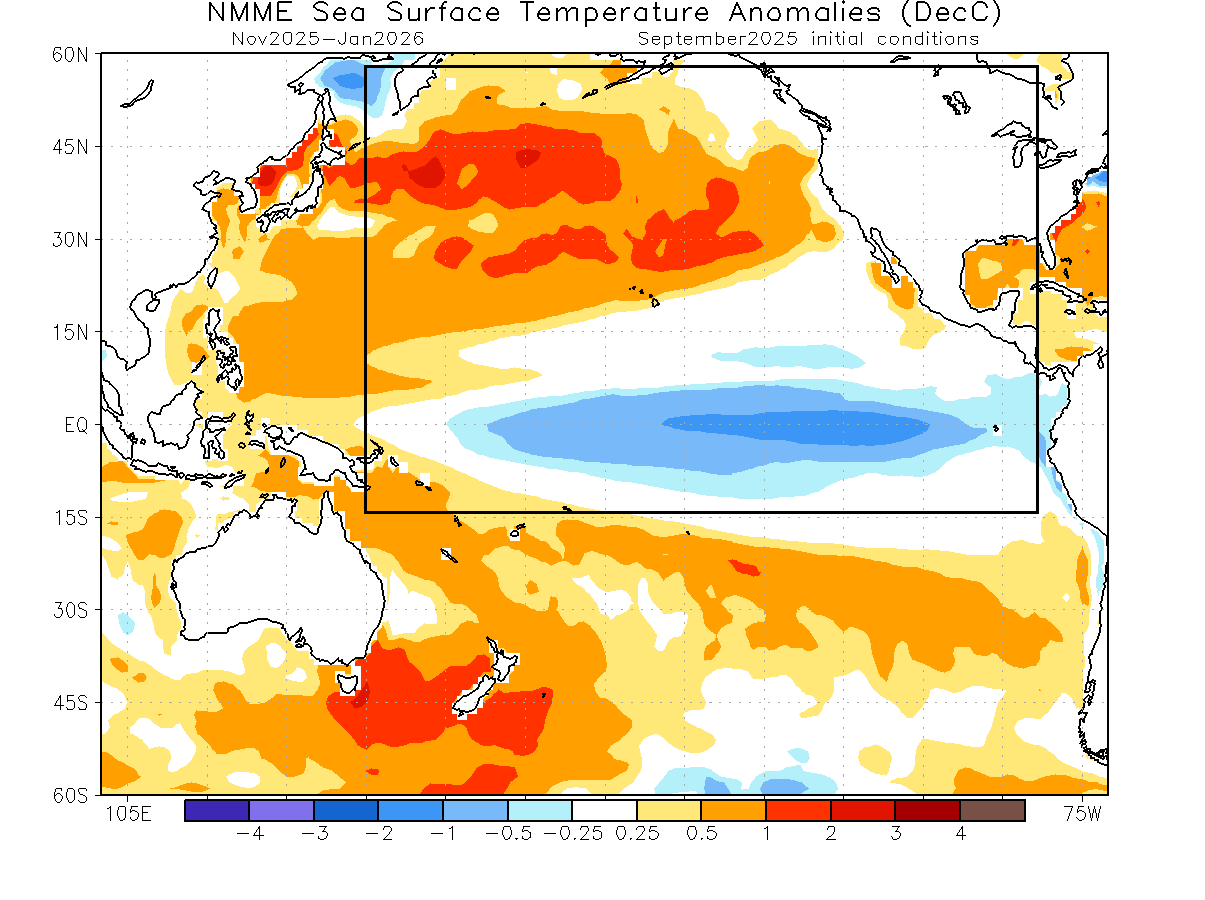
The NCEP NMME is another multi-model forecast, and it also shows the same anomaly contrast to continue into late Fall and early Winter. This gives us good confidence in this scenario, as both forecasts are created from multiple individual forecasts, which are then combined into a “super-forecast”.
This now allows us to look into the recent past and find some years with similar conditions in the Pacific Ocean. And we have found 4 Fall seasons that combined show a very similar ocean anomaly pattern to the forecast, and can be seen below. A warm anomaly in the North Pacific and a weak La Niña event or cold-neutral tropics, looking really close to the forecast for 2025/2026.
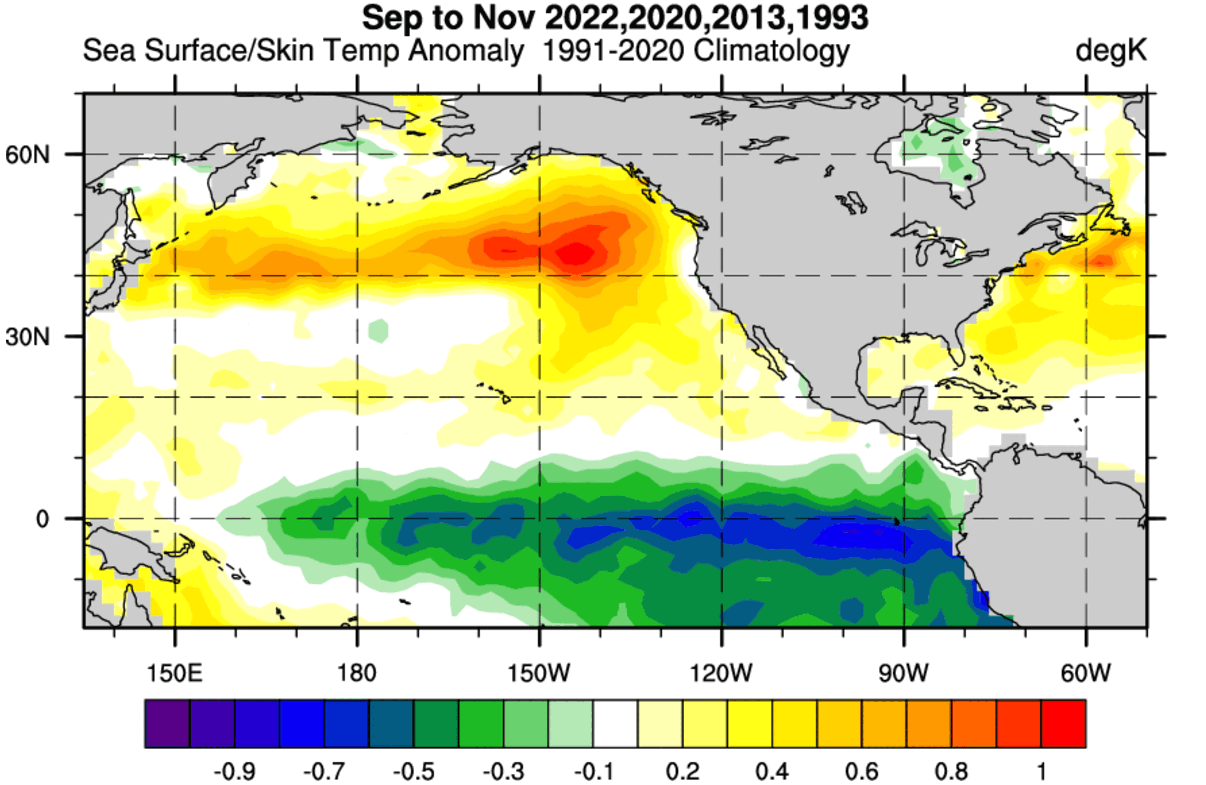
With this data, we can look at how the winters in these seasons developed, and where the majority of the cold and snowfall was, using it as guidance for the upcoming winter.
WINTER 2025/2026 COLD HINTS
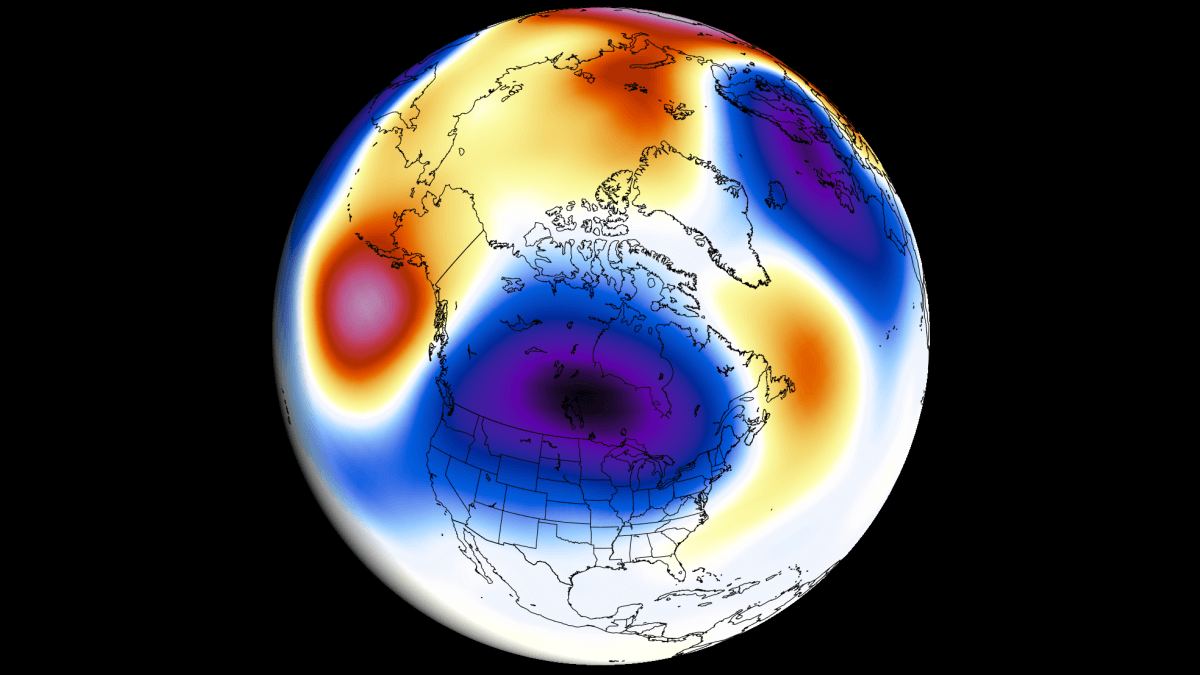
First, we can look at the Winter pressure anomalies in those years, following that specific ocean configuration. The analysis shows a broad low-pressure area over the United States and Canada, and a deep low-pressure system over the Northeast Atlantic and northwest Europe.
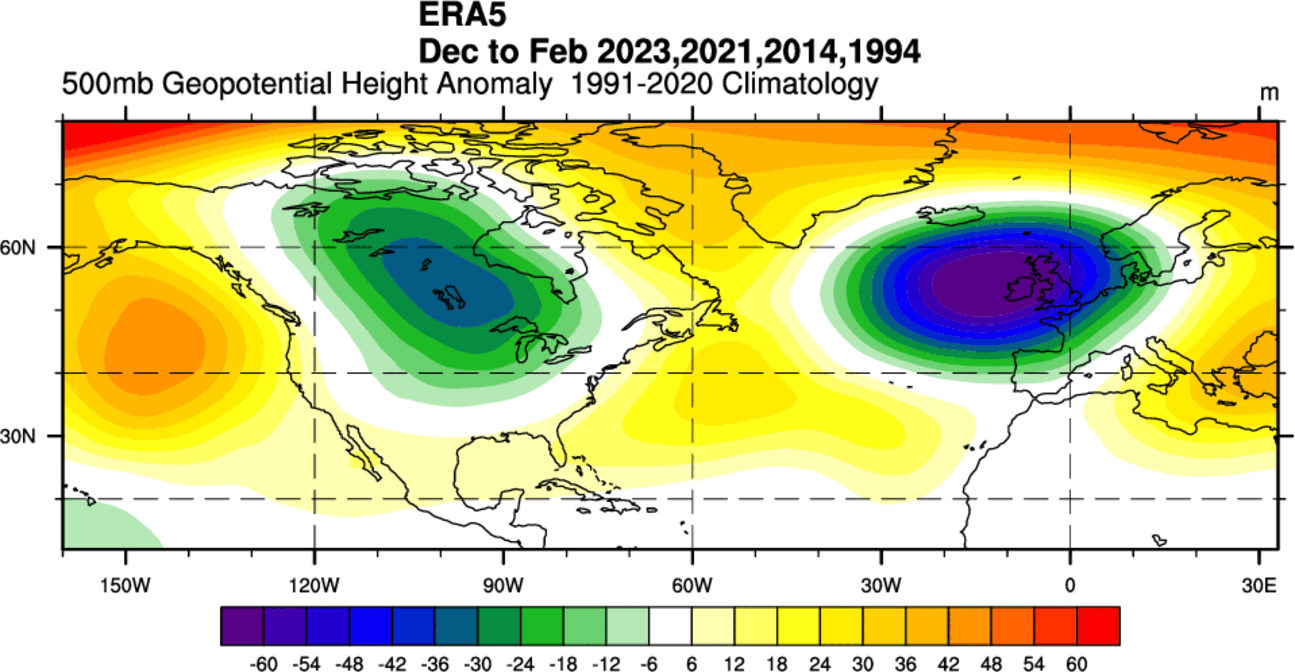
This pattern brings the polar jet stream deeper into the United States, while it amplifies the mild westerly flow into Europe.
We also made special custom images from ERA5 data for these years. Below is the temperature analysis for the same winters, and you can see a large cold air anomaly. This cold air is spreading from Canada down into the United States, as a cross-polar flow was established, bringing air down from the polar circle.
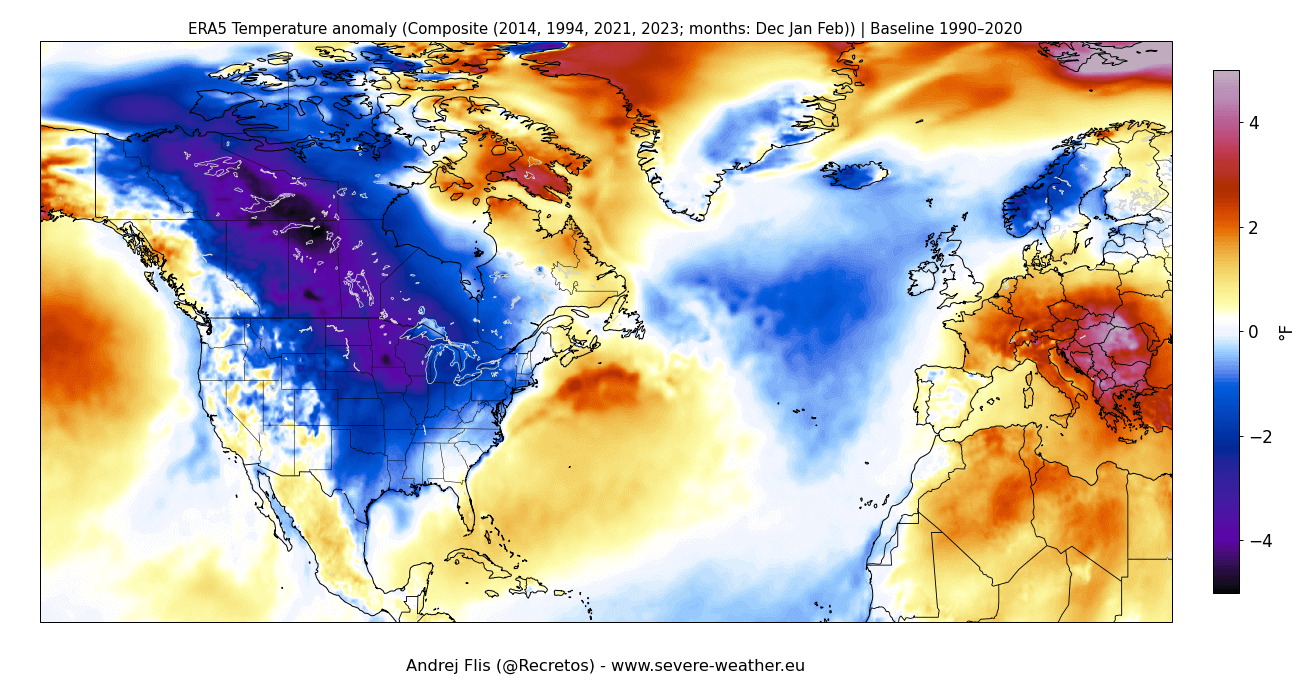
But over Europe, you can see the warm air anomaly, brought in by the westerly and southerly winds from the strong low-pressure area over the northwest. The best cold or snow potential in this scenario is over parts of the north of the UK and Ireland after a passage of a Low in its northerly wake.
Looking at the snowfall analysis for the same seasons, you can see a large spread of above-normal snowfall over the northern, eastern, and also south-central United States, and parts of western and central Canada. This is enabled by the cold air from the north, keeping the snow levels in low altitude.
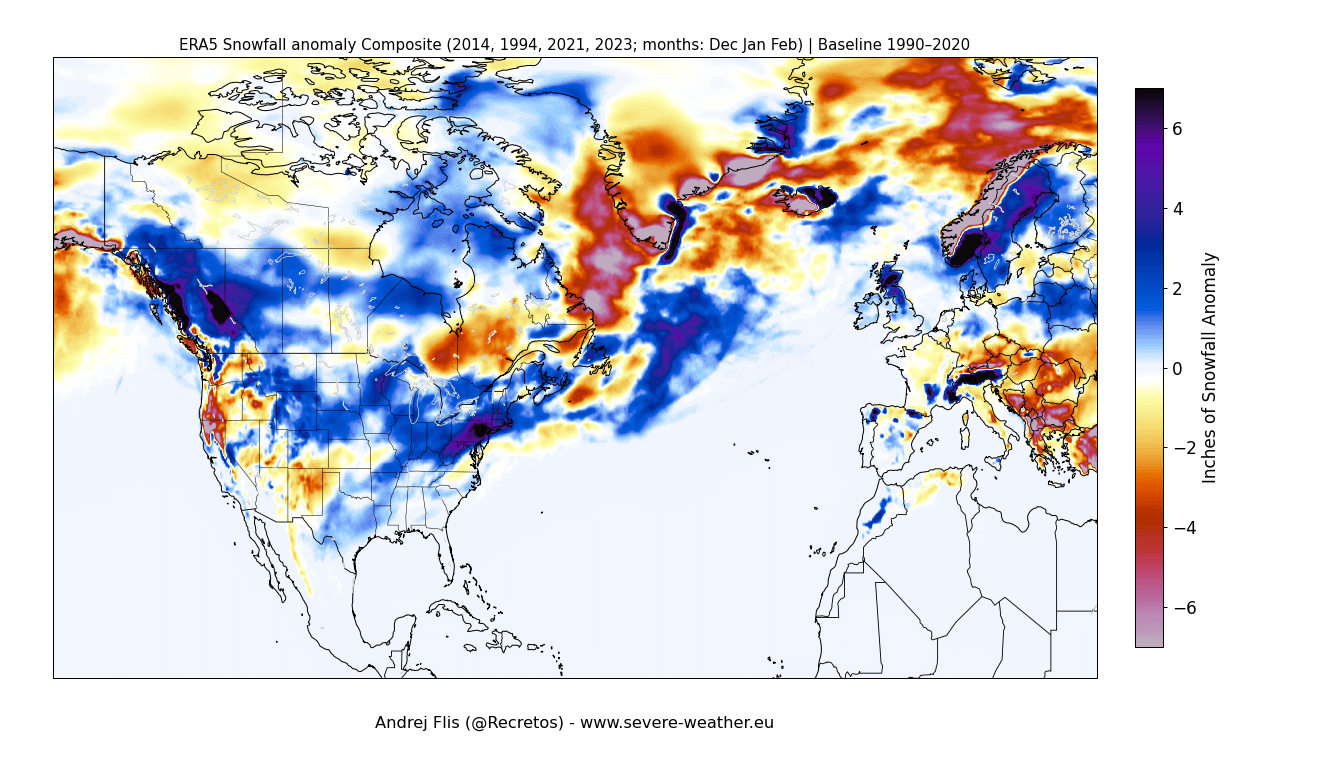
Over Europe, the main snowfall potential is across higher elevations and towards the north, where temperatures are lower. There is also good coverage of above-normal snow anomalies over the UK and Ireland, giving a favourable sign for a normal to good winter there.
Of course, this is not exactly how every such Winter season will look with the North Pacific anomaly. But this allows us to have some guidance or an idea, what usually happens in Winters with similar conditions.
If we look at the pressure forecast for January 2026 from the ECMWF, we can see a hint of a high-pressure system in the north Pacific, as expected. Additionally, you can see a broad low-pressure area over Canada, similar to the one in the multi-year analysis image. The low is too far west for now, but we will monitor the data for new updates.
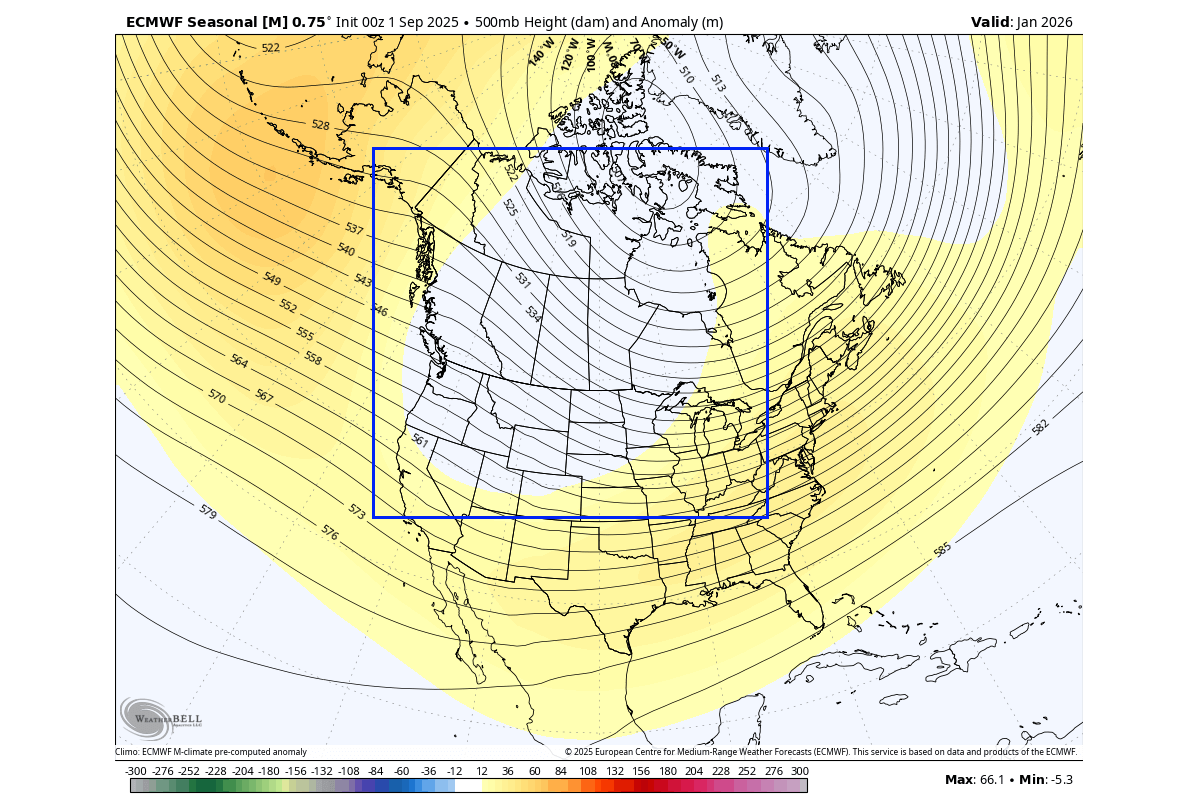
What matters for now is that the idea seems to be in the right place, while the position of the low-pressure area can vary with each forecast from west to east.
The pressure pattern forecast from the Canadian CanSIPS model also shows a low-pressure area over Canada, and a large high-pressure anomaly over the North Pacific. This is also a very nice example of what we can expect in such Winters. And this is a 3-month mean, so there is much more hidden within this simple average.
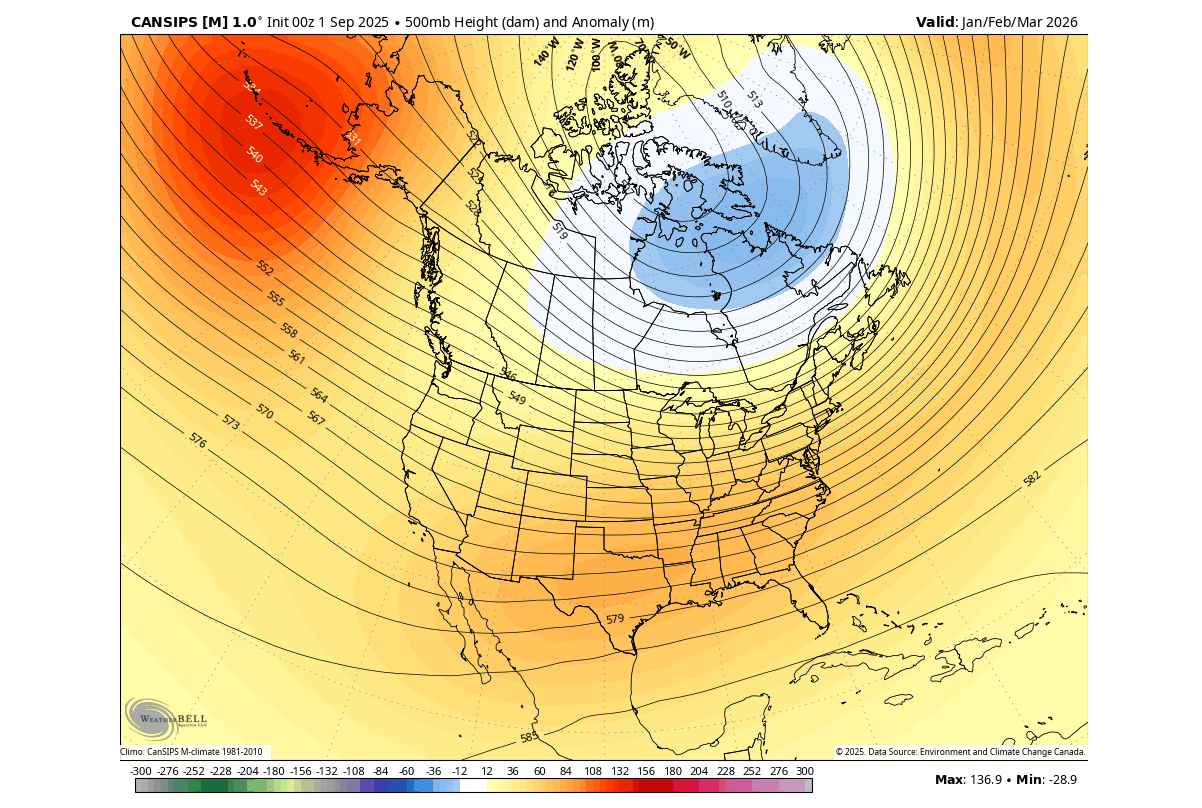
This is just another confirmation that the long-range model calculations are all aligning to a similar overall Winter pattern. We will also look at the winter temperature forecast when new data is available, so stay tuned.
Another important factor for the upcoming Winter 2025/2026: A New Polar Vortex is Now Emerging over the North Pole and will bring Weather Impacts on Winter 2025/2026
We will keep you updated on the developing weather trends in the coming seasons, so make sure to bookmark our page. Also, if you have seen this article in the Google App (Discover) feed, click the like button (♥) or add us to preferred sources there to see more of our forecasts and our latest articles on weather and nature in general.