A massive global weather shift is now underway as the multi-year La Niña officially collapses, making way for a rapidly developing El Niño. Latest ocean analysis reveals a significant subsurface warming in the tropical Pacific, signaling a strong event is likely to emerge, likely reaching Super El Niño status by the end of 2026.
This upcoming event is driven by powerful westerly wind bursts and a massive oceanic Kelvin wave currently surfacing in the eastern Pacific. Such an intense warming of the tropical Pacific can fundamentally alter the global jet stream and trigger a domino effect that extends across North America, Europe, and the rest of the globe.
In this article, we will look at the latest oceanic and atmospheric data showing the rise of this new warm ENSO phase. Also, we will analyze the first impacts on Summer 2026, the potential U.S. “shield” during the Atlantic Hurricane season, and the early outlook for Winter 2026/2027 as this major climate driver emerges from the oceans.
ENSO Cycle: Driving the Global Weather System
We love to share weather and forecast information with our readers. But we also try to share knowledge and explain complex weather phenomena in a simple way, as we feel that everyone can understand how the global weather system works.
ENSO is short for “El Niño Southern Oscillation”. This is a region of the equatorial Pacific Ocean that changes between warm and cold phases in about every 1-3 years.
These ocean temperature anomalies don’t just bring the main “impact” for global weather, but can also act as the “indicator light”, indicating the changes in the global weather system as this ocean area changes from a cold to a warm phase, for example.
The image below shows the ENSO regions across the tropical Pacific. The main area covers the central part, shown in the image as the Niño 3.4 region. In this region, we determine the ENSO phases by looking at the sea-surface temperature anomalies (warmer/colder).
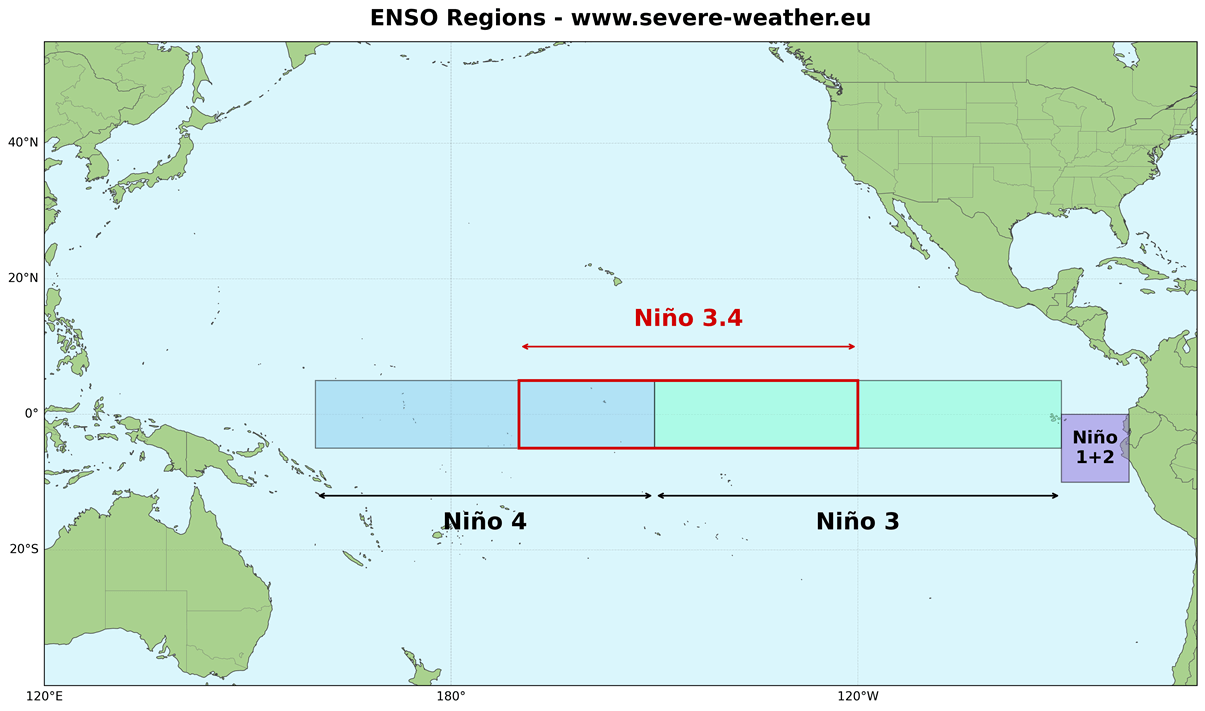
The cold ENSO phase is called La Niña, and the warm phase is called El Niño. Each ENSO phase has a major influence on the complex ocean-atmosphere feedback system. These changes gradually affect global circulation, altering weather patterns worldwide.
A specific phase usually develops between late summer and early fall and typically lasts until next summer. But some events can last even up to two years, called “double”, or can be really strong, like a “Super El Niño”.
In the image below, you can see a direct comparison between ocean temperature anomalies for each of the ENSO phases. Both examples show realistic data from the 10 strongest events for each anomaly, revealing the obvious ocean signature of the ENSO event.
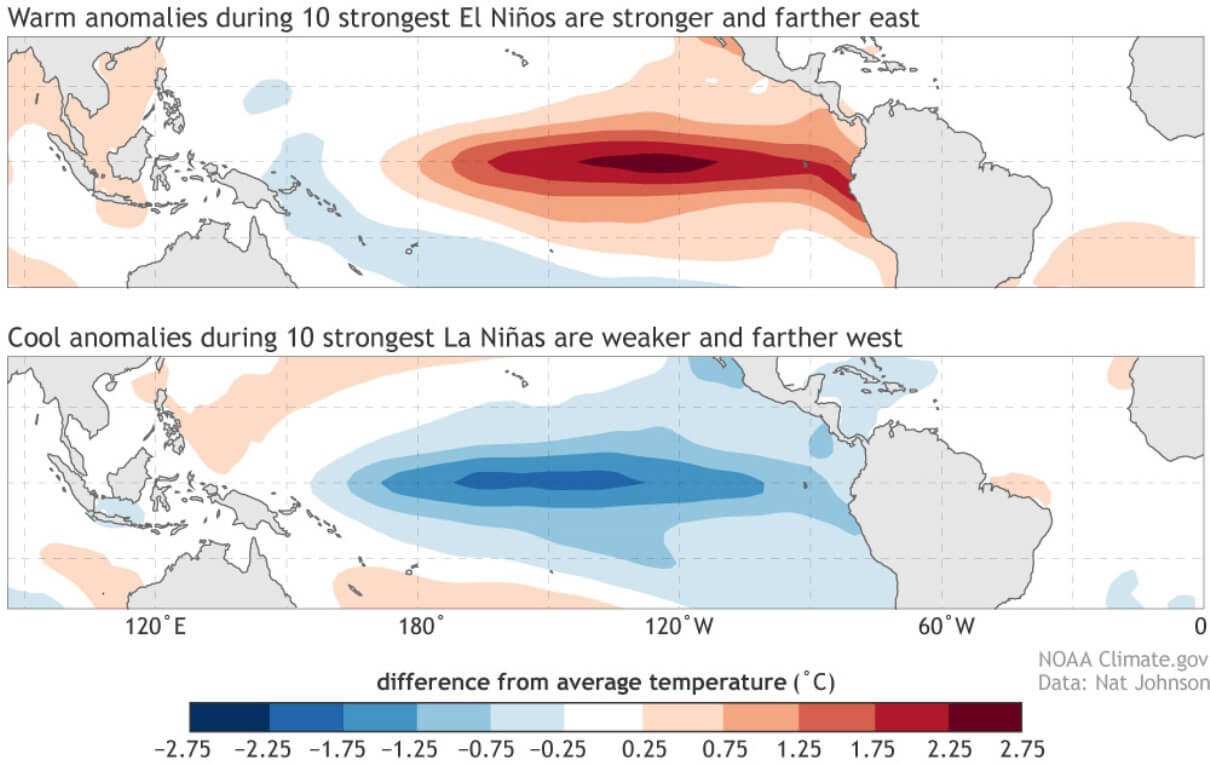
Each phase has a different pressure and rainfall impact on the tropics, which, down the line, results in a very different impact on the global weather circulation.
But how exactly does the ENSO shift between these phases? The answer is that the tropical trade winds can start or stop a certain phase by mixing the ocean surface layers and altering the ocean currents, and thus the ocean temperature.
The trade winds are steady and persistent, blowing towards (and along) the Equator in both Hemispheres.
Below is our latest map, which shows the prevailing near-surface winds, based on actual ECMWF data from the past 4 decades. You can nicely see the easterly trade winds in the Atlantic Ocean and in the Pacific Ocean, which help to drive the warming and cooling in the main ENSO regions.
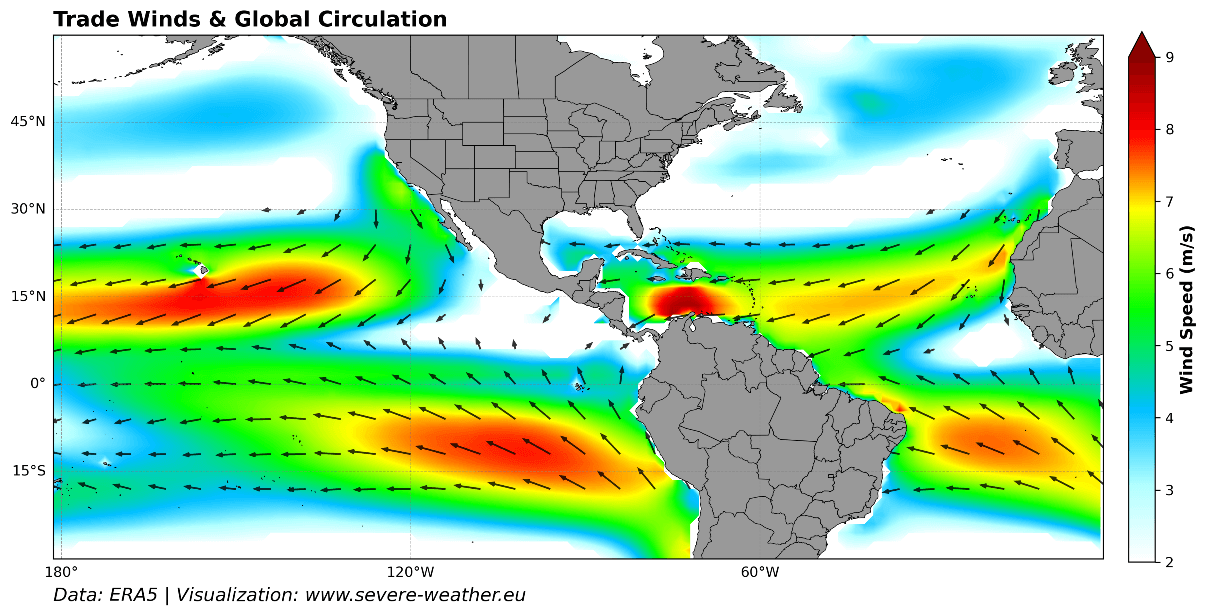
When these easterly winds get stronger, they change the ocean surface currents and start pushing the water from east to west. This moves warm surface water towards the west, bringing up deeper (colder) water closer to the surface to replace it, starting a La Niña. This event is called upwelling.
But when these trade winds get weak or reversed, the more westerly flow promotes warmer ocean temperatures on the surface, reversing the ocean cooling and starting a warm El Niño event.
Recently, we have seen several of these westerly wind burst anomalies, which have dissolved the cold La Niña anomaly in the Pacific. And with a new westerly wind burst now forecast, the whole region is getting ready for an El Niño to emerge.
The Great Transition: La Niña Collapses as a New El Niño Emerges
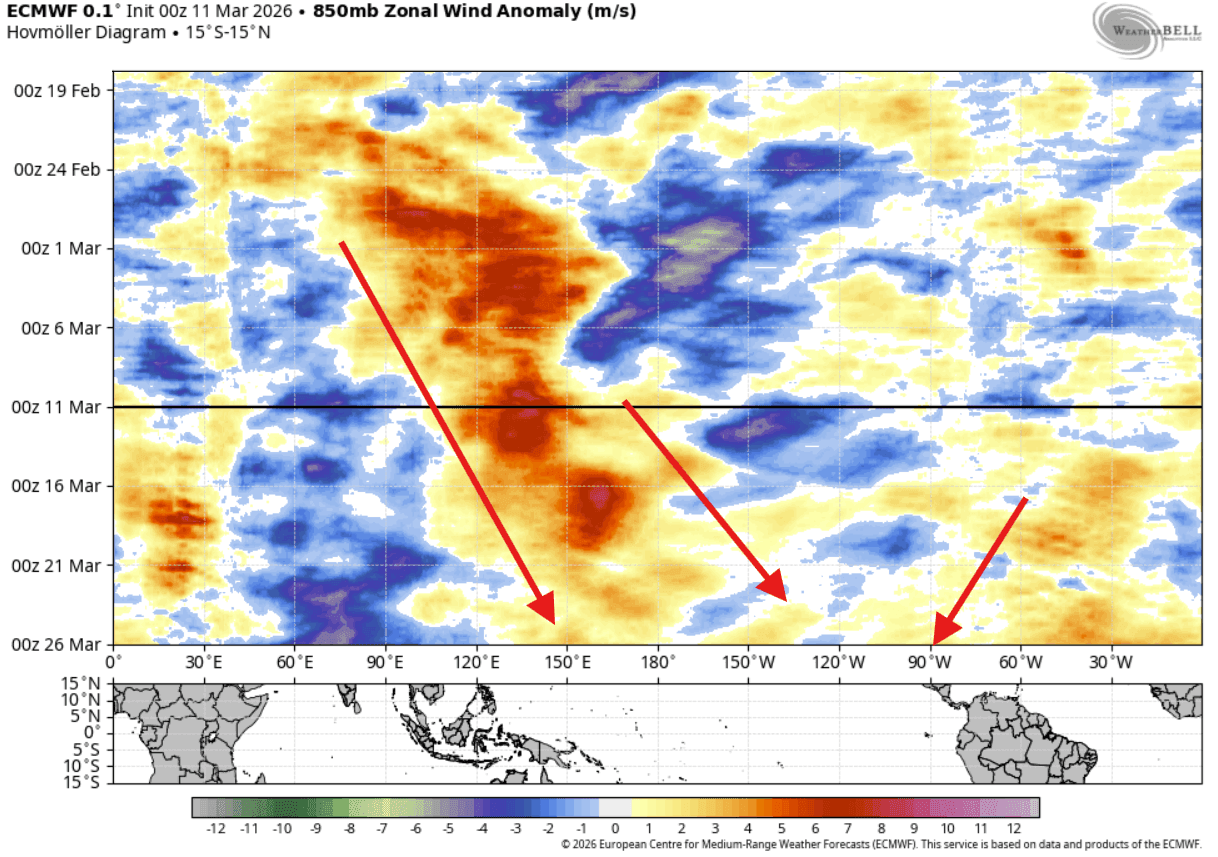
Below is the latest trade wind analysis and forecast, which shows an unusually strong westerly wind burst across the Pacific in recent weeks. In the forecast part, you can also see the continued trend for more westerly trade wind anomalies spreading into the ENSO regions, fully charging the ocean for an El Niño to emerge.
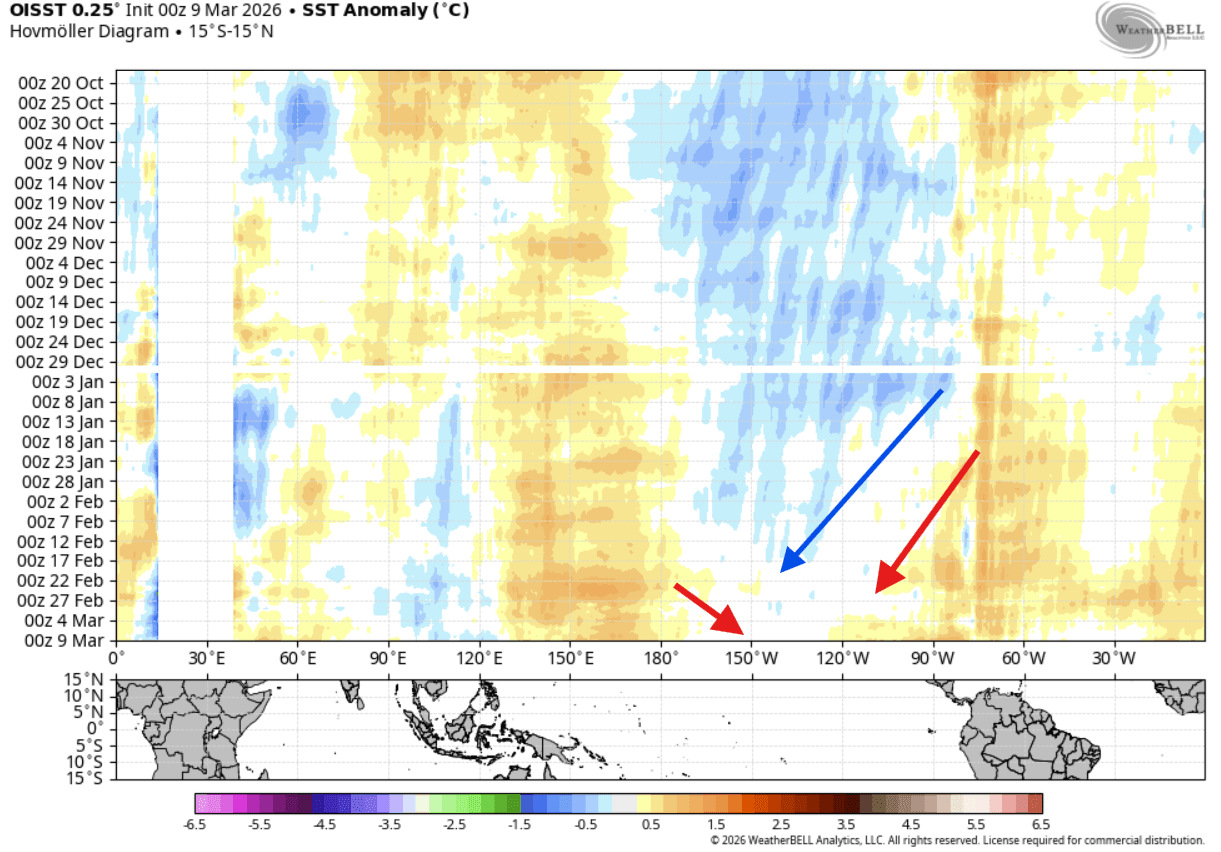
We can see the ocean response in the special graphic below, which shows the changing ocean surface temperature in recent months across the tropics. You can see the cold La Niña event peak in December and then rapidly dissolve, with the warm anomalies already starting to spread in from both the west and the east.
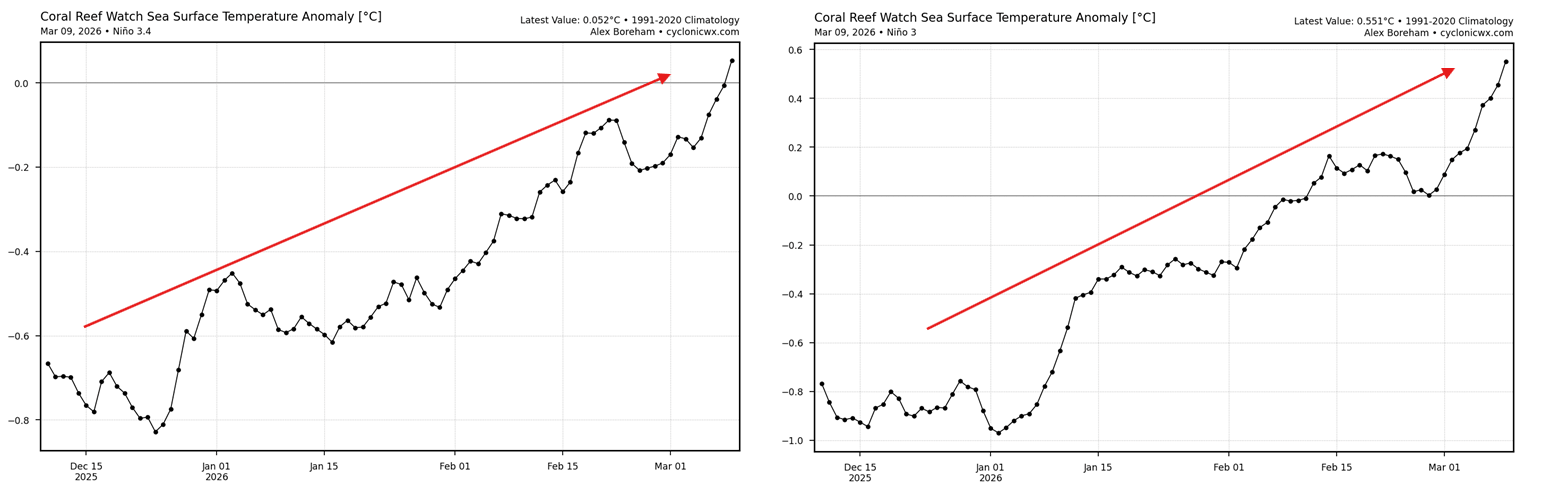
We can also confirm these changes by looking at the analysis graphs below, which show the anomaly data for the past 3 months in the main region (left) and in the eastern region (right). You can see a rapid temperature anomaly rise since mid-December, now already reaching into positive values, removing the cold anomalies from the ENSO region.
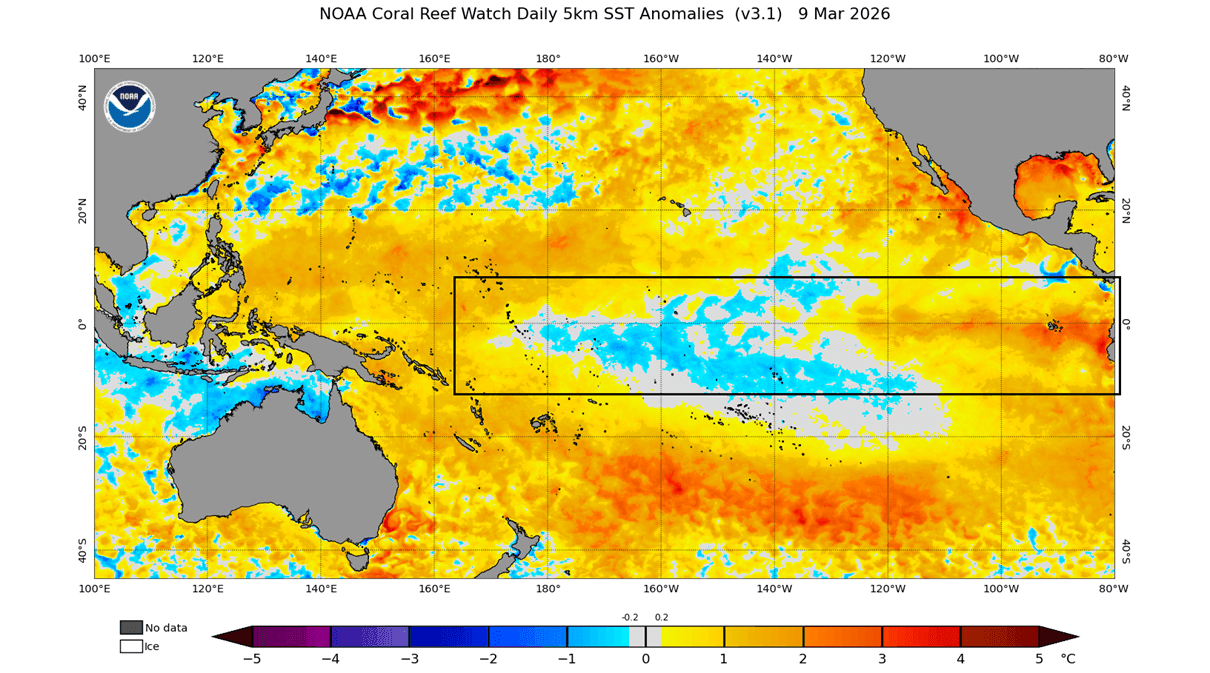
The latest ocean analysis below shows the main ENSO region with some leftover cool patches, but the overall average anomaly for the region is already in positive values. The largest expansion of warm anomalies has so far been in the eastern region, which is already seen below with temperatures 2 degrees above the normal values.
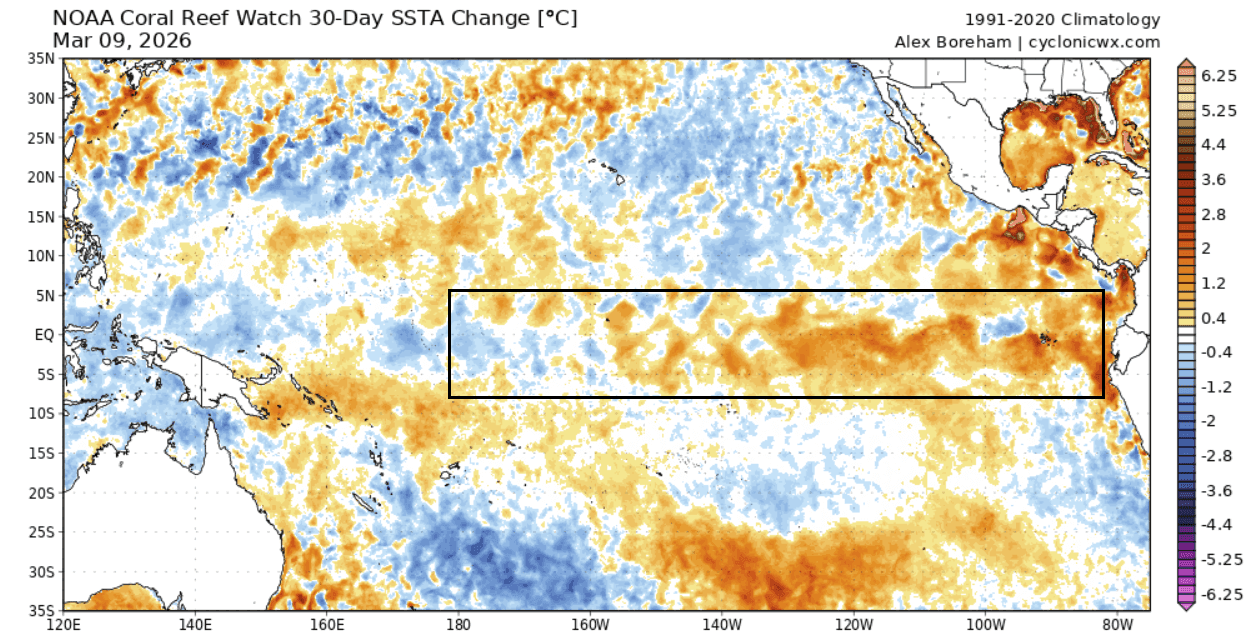
This change is nicely reflected below in the latest 30-day ocean temperature change map. Here we can see the warming trend across the whole ENSO region. First, we observed a warming trend in the eastern parts, but it has now spread across the whole region as westerly winds began eroding the cold across the region.
All this is driven also by strong temperature changes deep beneath the ocean surface. The image below shows the latest subsurface ocean temperature anomalies across the tropical Pacific. A massive subsurface warm pool has developed in the west, at around 100-250m (300-800ft) depth. This is called an oceanic Kelvin wave, and is making its way east, fully eroding the subsurface cold and emerging on the surface as the warm anomalies.
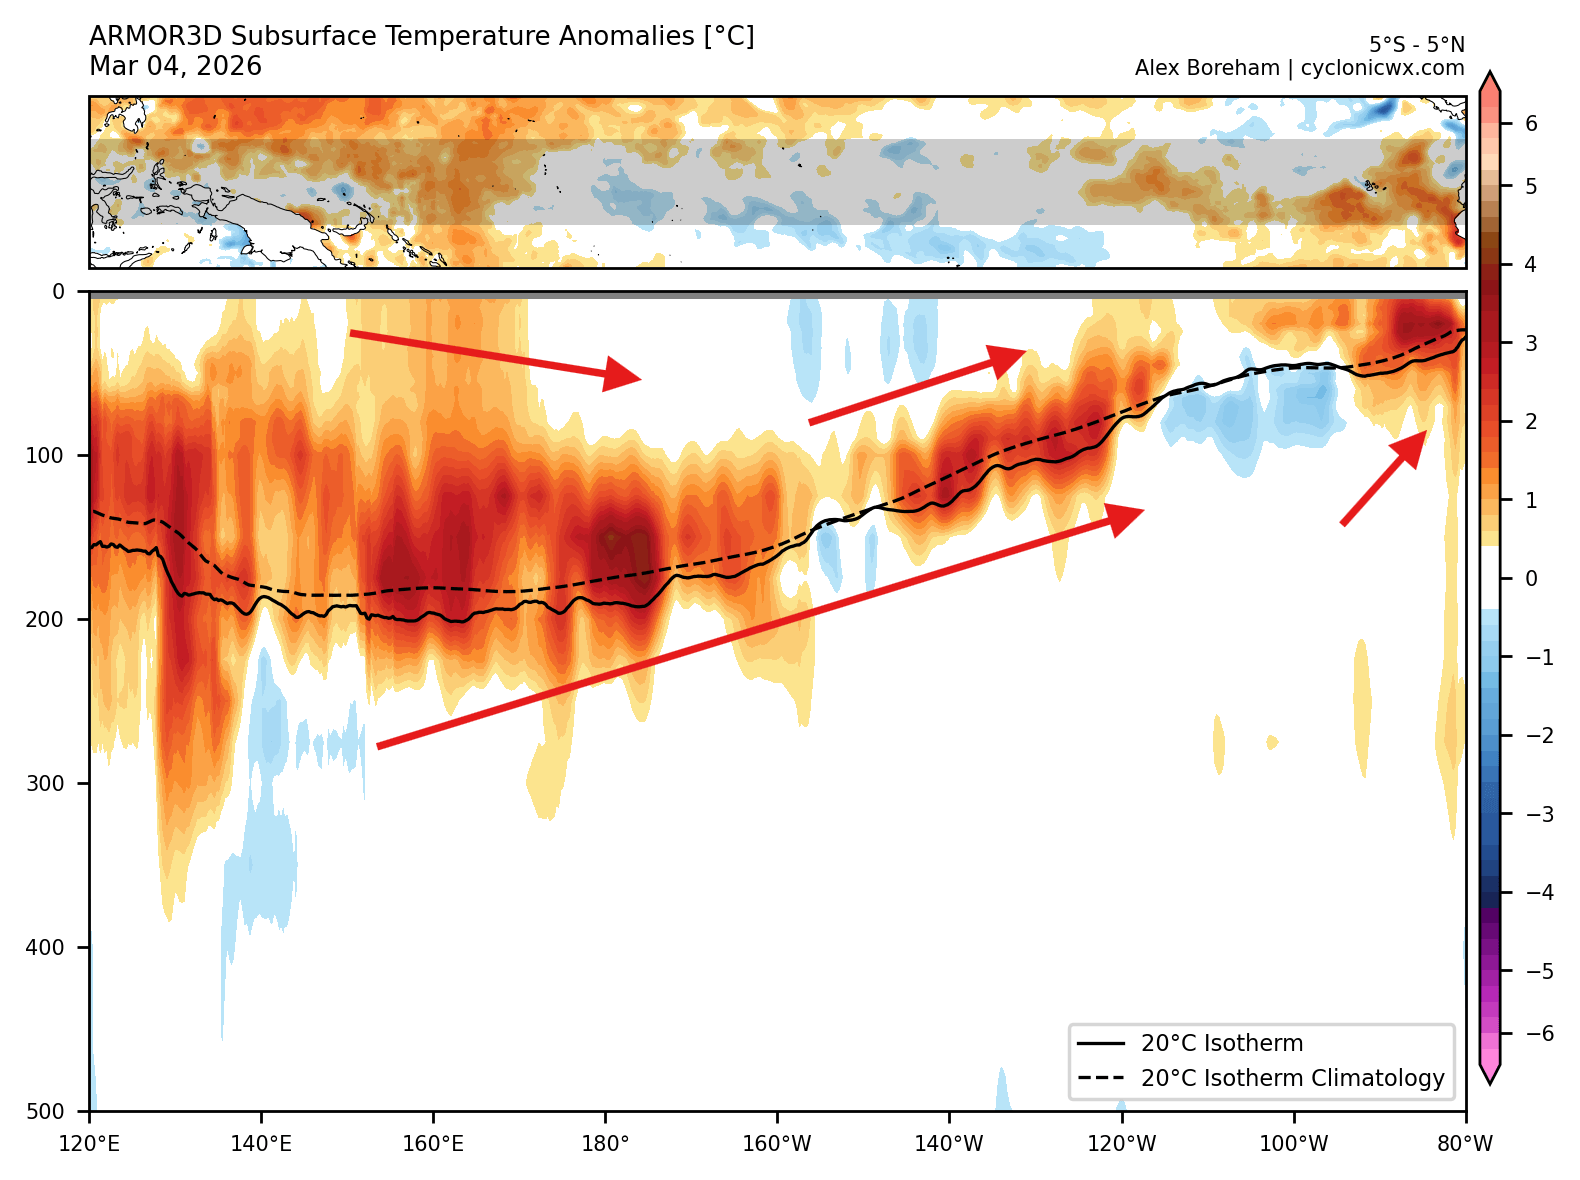
These subsurface Kelvin waves are driven by the westerly wind bursts we saw above, so it all comes full circle, showing how connected and driven this system is.
This is much better seen in the video below, which shows the last few months of subsurface ocean temperature changes in the ENSO region. You can see a healthy La Niña event below the surface and how the warm Kelvin has made its way across the ocean, fully eroding the cold pool of the La Niña.
The long-range forecast systems also have this information in their dataset. Knowing the development below the ocean surface, and the wind changes above, they are starting to show a massive push for an El Niño, which is already looking likely to reach into a Super event territory.
2026 Ocean Forecast: Is a Super El Niño Developing in the Pacific?
Looking ahead, we can see a clear indication of a rapid rise of the new El Niño event. All the available forecast data show the next El Niño event, but its strength still varies, showing everything from a weak event to a Super El Niño. This is normal for this time of year.
Below is the latest ENSO multi-model forecast for the next few months from the C3S system. On the left is the forecast for the main ENSO region, and on the right is the forecast for the eastern (ENSO 3) region. This is a combined forecast from multiple long-range models and shows a rapid shift into an El Niño.
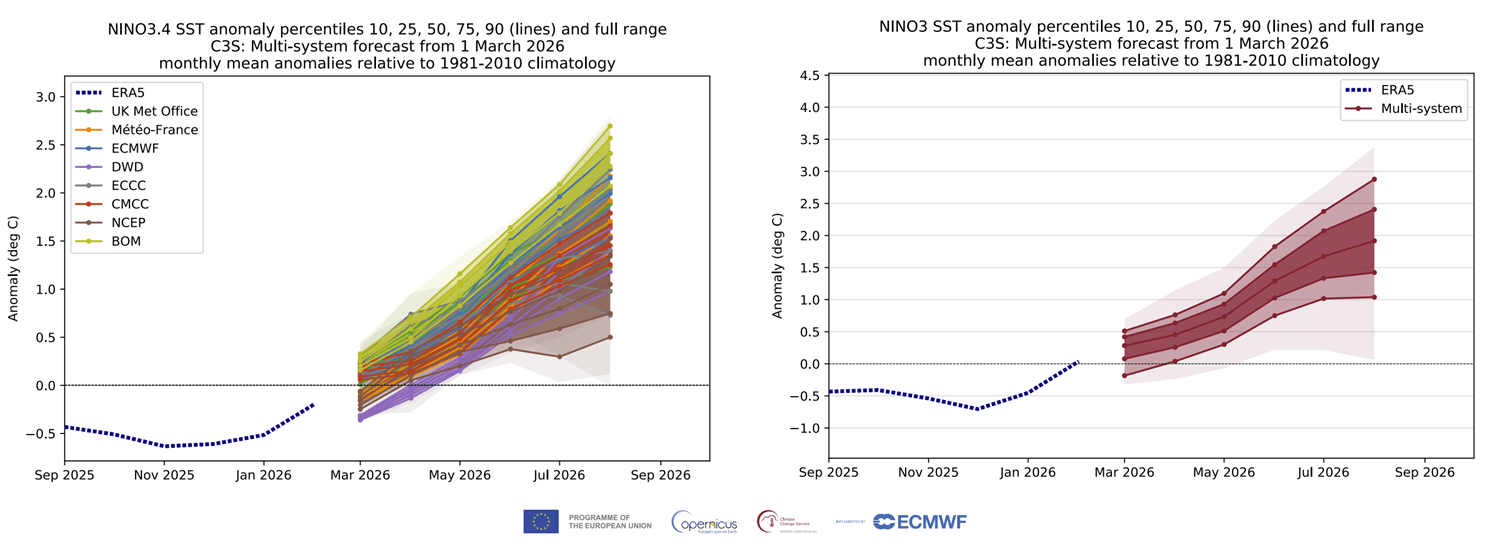
The average value of the forecast to the upper end shows an increasing likelihood for a Super El Niño to develop, which needs the seasonal average to be sustained at or above +2 degrees. Given the usual peak of this event and the strong anomalies building as we saw in the latest analysis above, it’s becoming more likely that the 2026 El Niño event will be a “Super” event.
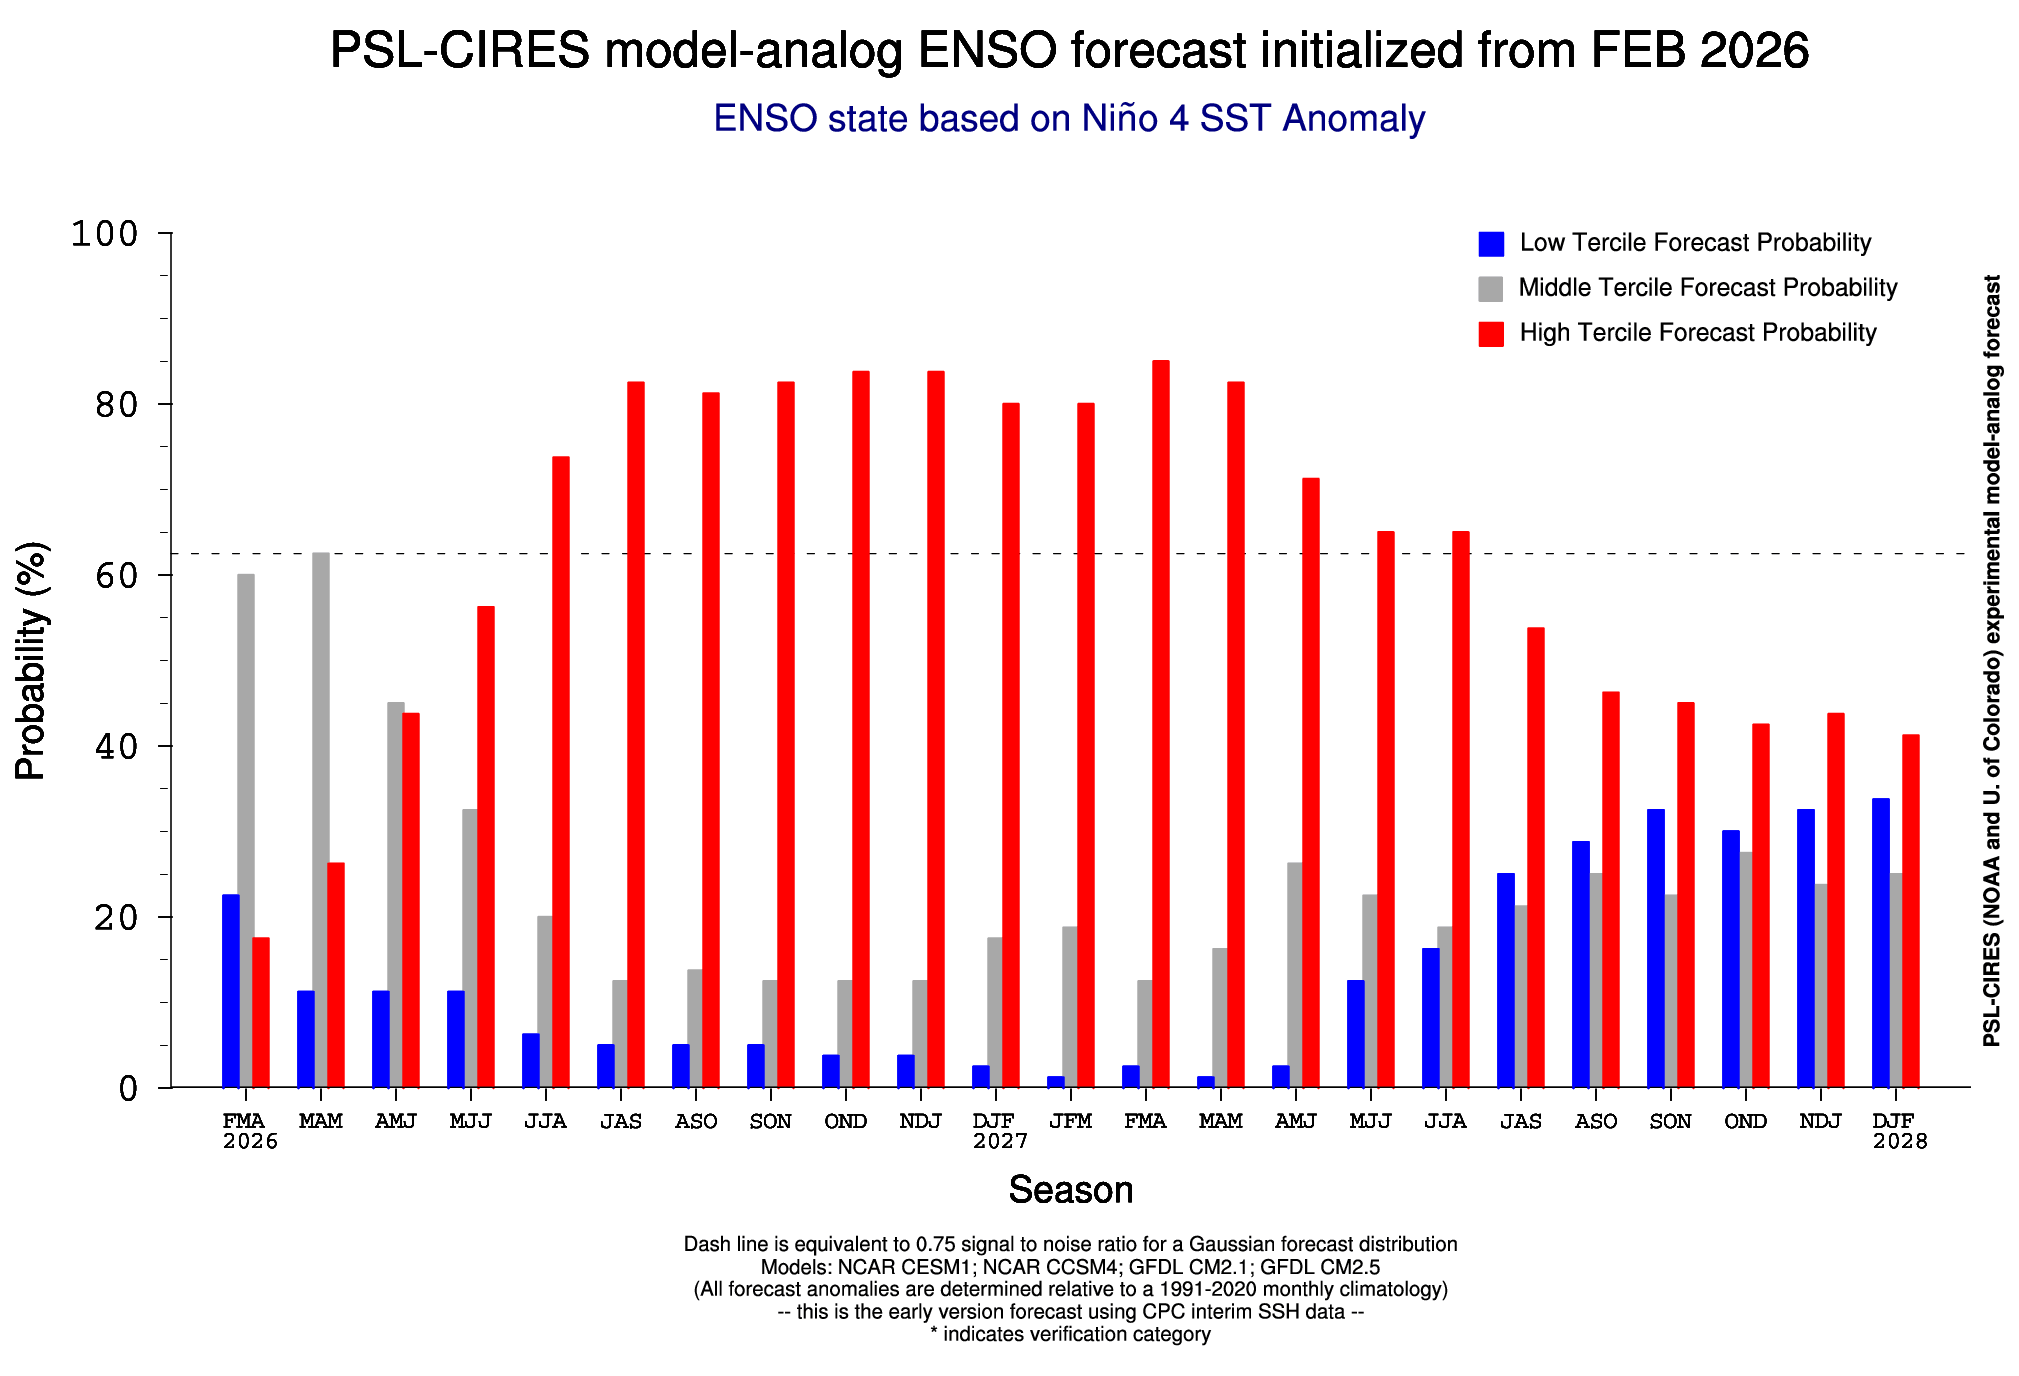
The NOAA PSL probabilistic ENSO forecast indicates a rapid emergence of El Niño towards Summer. This means that El Niño is likely to peak during Winter, bringing its main impact during the 2026/2027 Winter season across the United States, Canada, and also Europe.
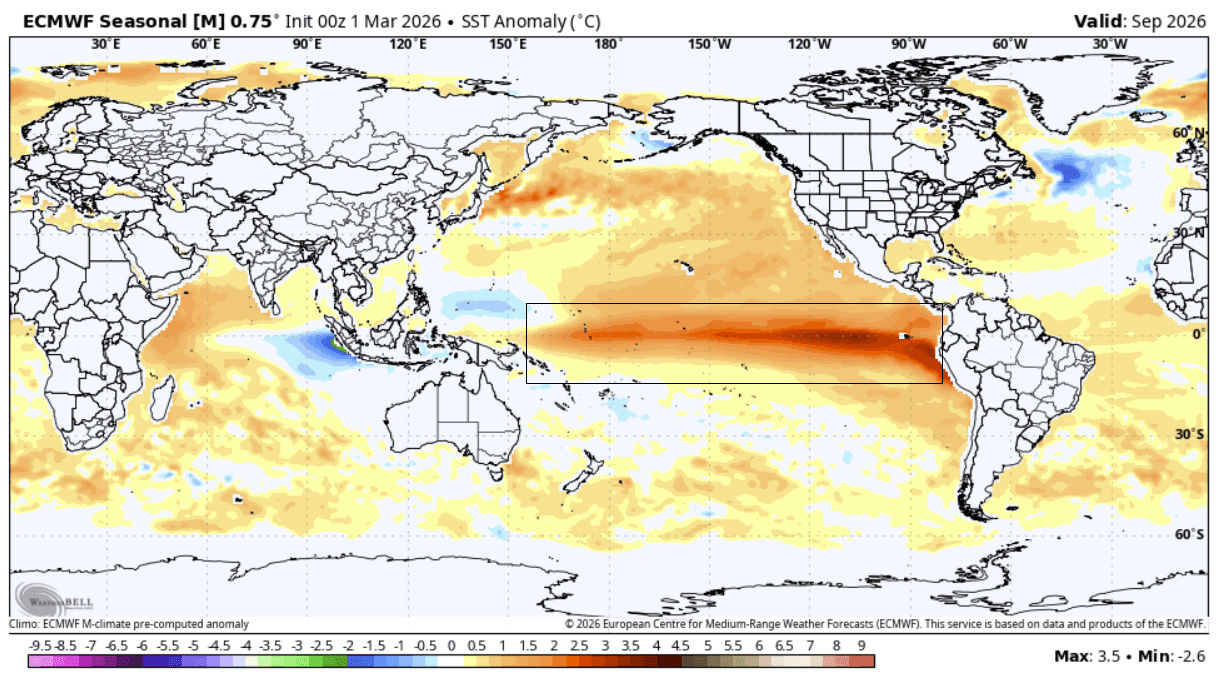
Below is the latest ECMWF forecast for September, and it already shows a clear El Niño anomaly across the tropical Pacific. The peak values are found in the eastern region, consistent with the strength usually seen in a Super El Niño event.
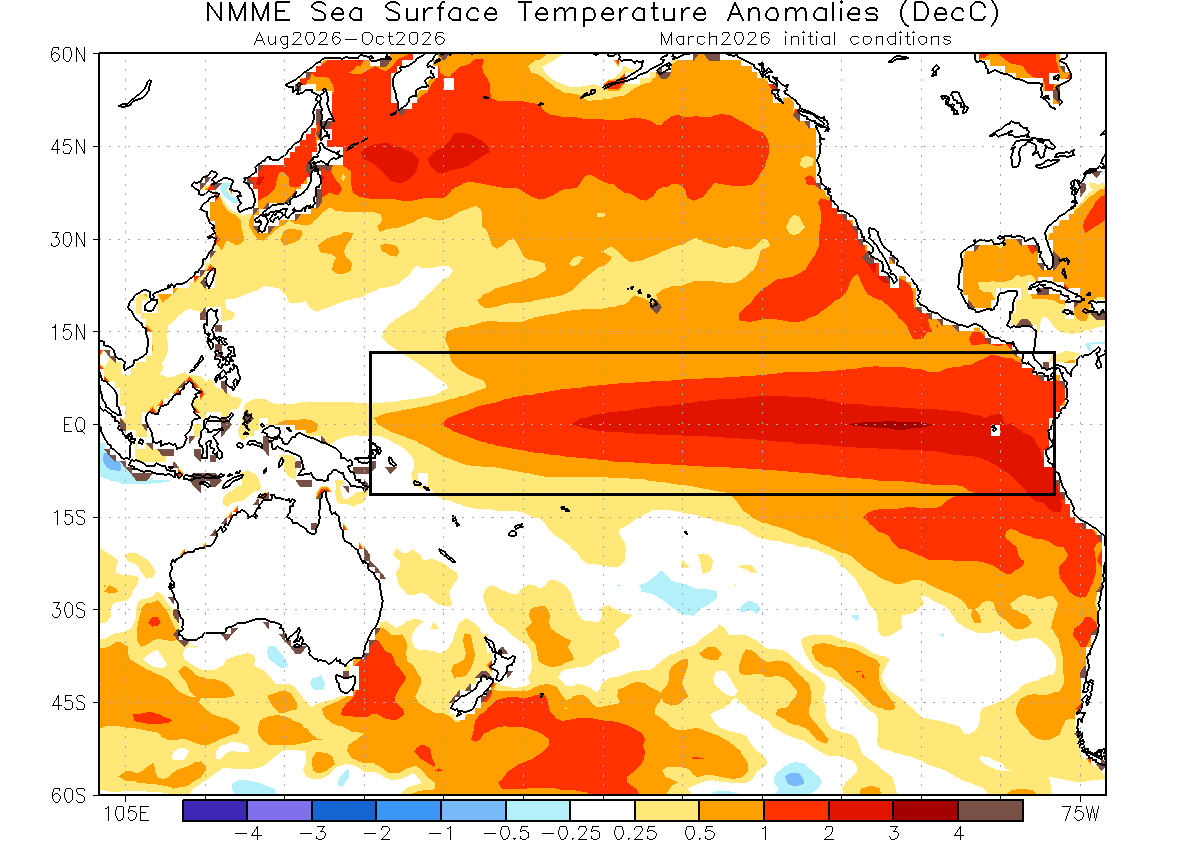
Looking also at the latest NMME multi-model forecast for late Summer and Fall, you can already see a clear El Niño warm anomaly in the Pacific. This also shows the strength of peak anomalies to reach or exceed the threshold for a Super El Niño event in 2026/2027.
A Super El Niño differs from a normal event because the warming in the Pacific becomes more intense, resulting in an even stronger impact on global weather. This can lead to much more extreme weather shifts, turning typical seasonal changes into high-impact events like massive flooding, severe droughts, and significantly altered storm tracks that can affect the entire planet.
We can see that the latest forecast does show a high potential for a Super El Niño, but we will have to wait for further forecast updates to see its full development into late 2026. But it is already evident that we are in for a strong global weather shift in 2026.
We decided to look at some past data to find years with a similar shift from a weak cold ENSO phase into an El Niño, as is forecast for 2026, and find some hints for the upcoming Summer season development.
Summer 2026: The First Atmospheric Impacts of a New Phase
The El Niño is likely to emerge by Summer, but its impact is usually not immediate. But given the rapid nature of the upcoming event, the atmosphere is already expected to show El Niño-like patterns.
Below is the meteorological Summer reanalysis for the years with a rapid transition from La Niña to El Niño, plus a stratospheric wind change (QBO index). The reanalysis of past such years shows a tendency for a low-pressure area somewhere over the eastern United States or eastern Canada, and over western Europe or the eastern North Atlantic.
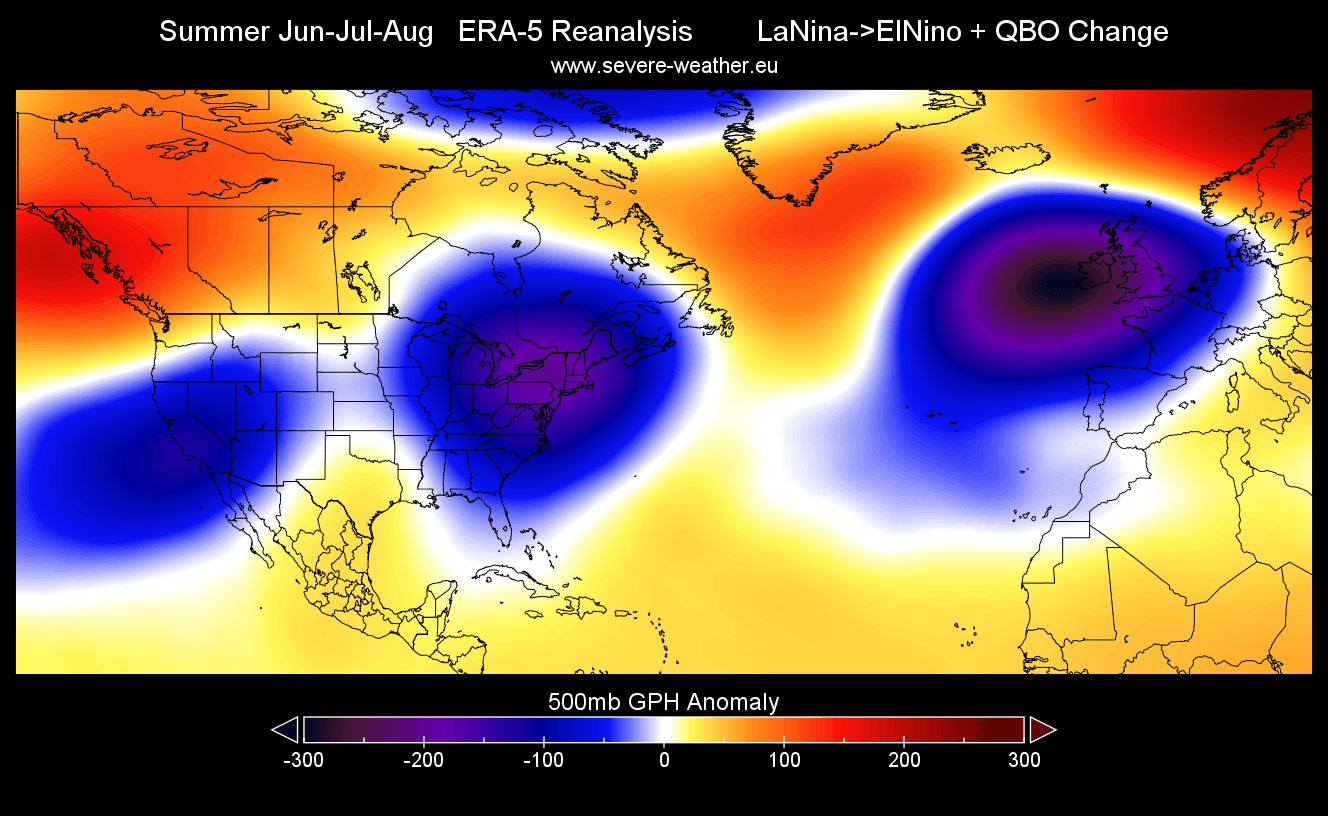
A low-pressure area over the eastern U.S. or eastern Canada supports a more northerly flow, keeping summer temperatures normal to below-normal over the northern and eastern United States. At the same time, the low-pressure position over the eastern North Atlantic can bring normal to below-normal summer temperatures to western Europe.
If we look at the latest long-range pressure forecast for Summer (June-August), you can actually see a very similar pressure pattern to that in the past years above. A low-pressure area is forecast over eastern Canada and over the Azores.
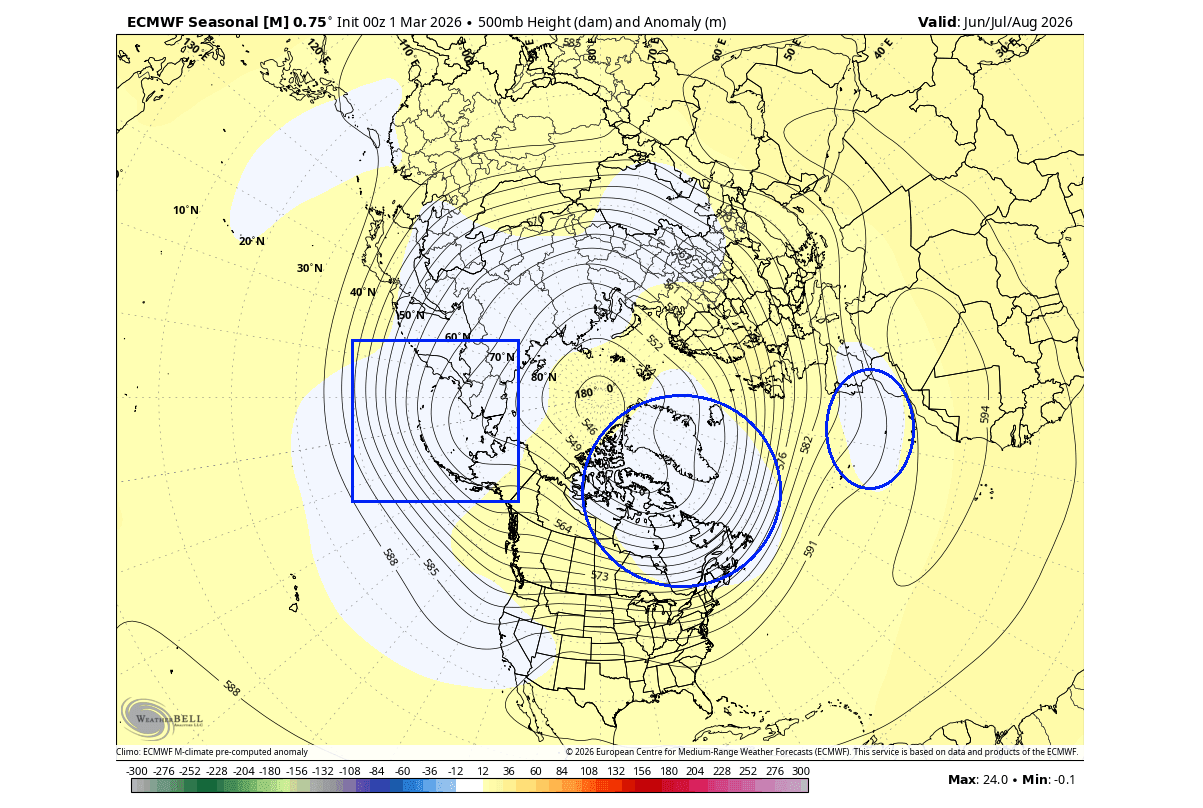
This indicates that the atmosphere is likely to undergo a similar development to that in past years. But, of course, each year has its own specific conditions, so we are just looking at large-scale trends.
Looking at temperatures from the reanalysis years, you can see a below-normal trend over the northern and eastern United States and eastern Canada. Warmer temperatures are found over the northwestern and southern United States, and over western Canada. But this is a composite from a selection of years, some from the past decades with a bit different global climate system.
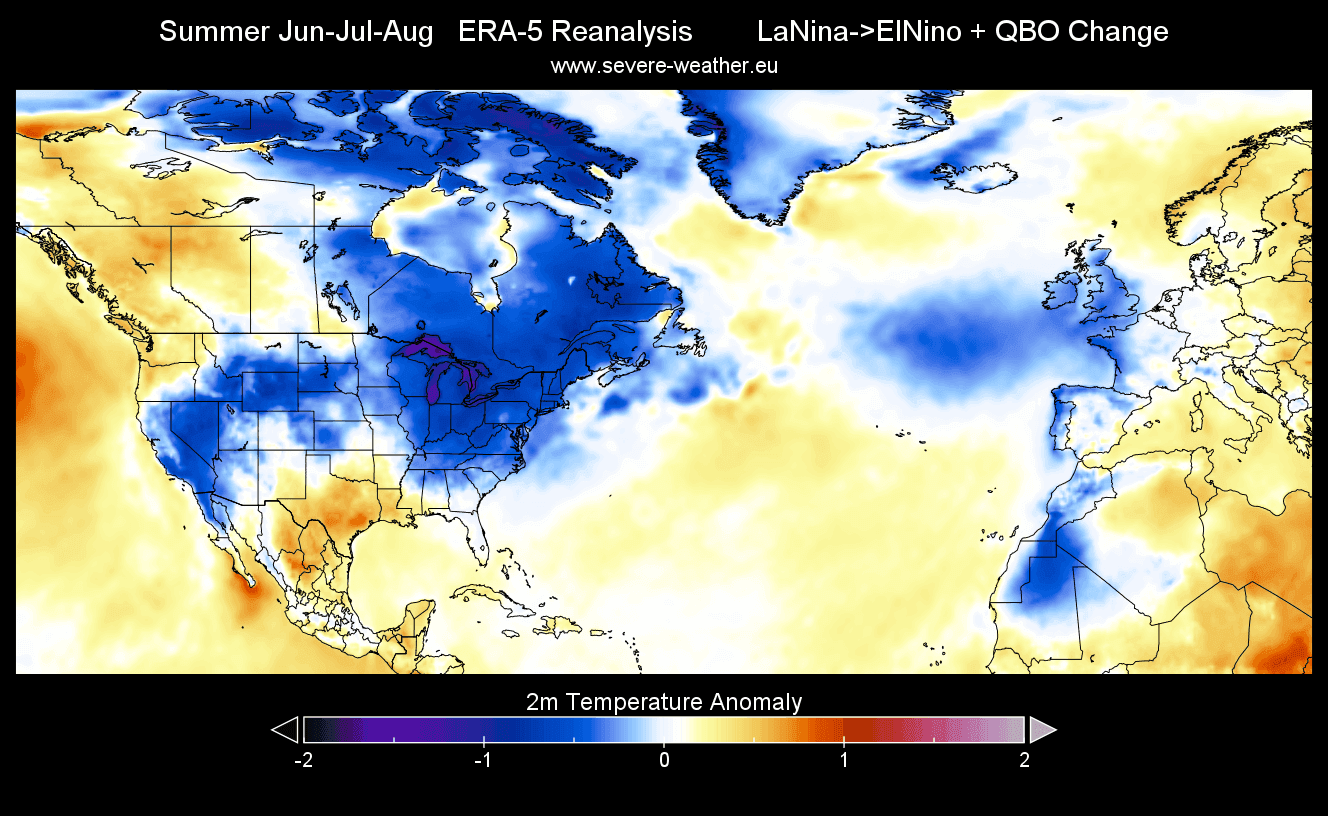
You can also see a below-normal trend in the western half of Europe, but warmer conditions in the central and eastern parts.
If we look at the long-range Summer temperature forecast for North America, we can actually see the normal temperature area over the northern and eastern United States, and over much of central and eastern Canada. This coincides with the trends of the past data, indicating the presence of the background (El Niño emergent) forcing.
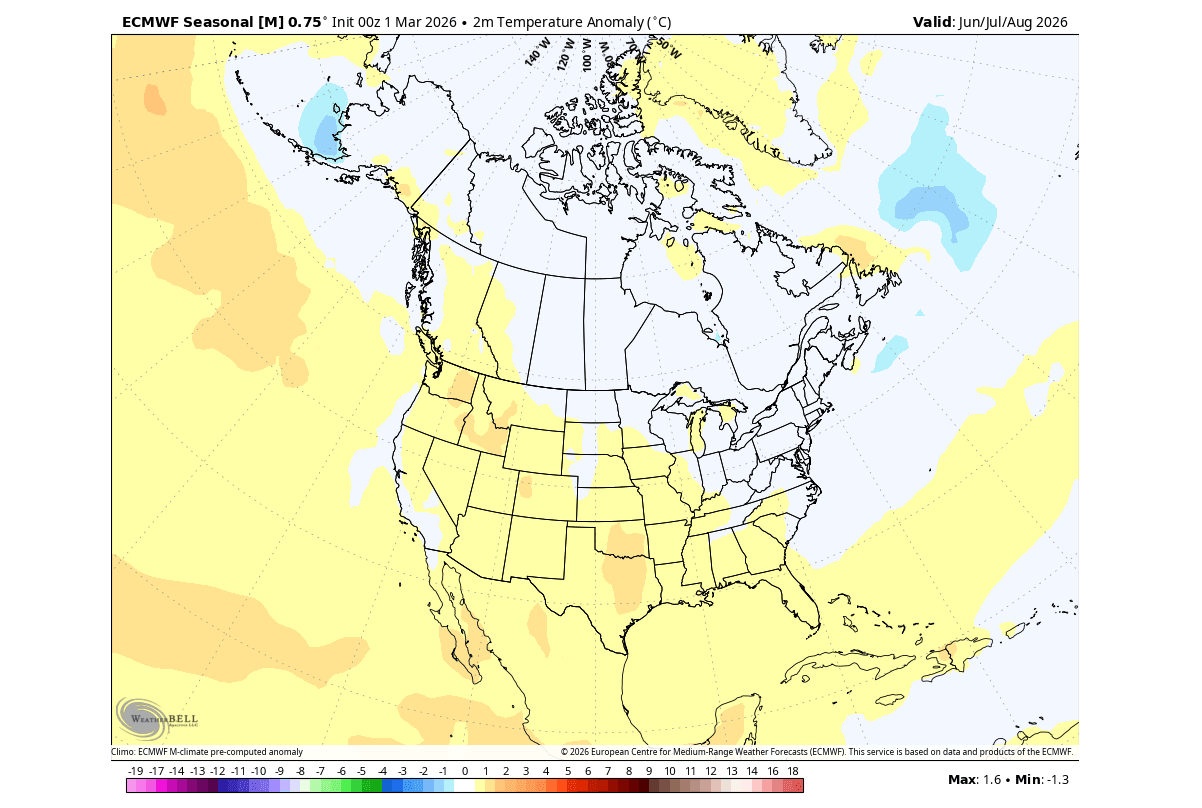
Above-normal temperatures are forecast for Summer 2026 over the northwestern and southern United States and far western Canada, very similar to the past reanalysis data.
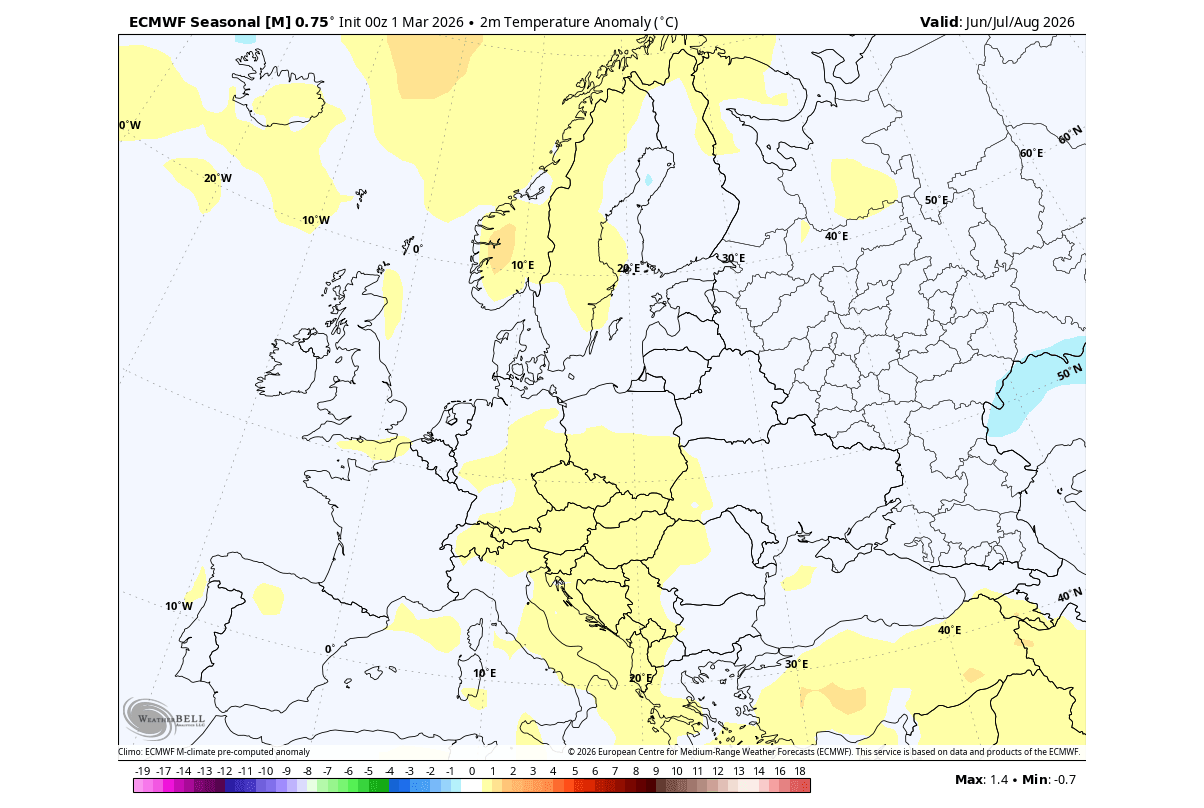
Over Europe, we are also observing a similar trend in the forecast as in the past reanalysis data. The main axis of above-normal temperatures is over central Europe and towards the north. But a normal temperature area covers the entire western half of the continent, similar to past data indications.
Overall, these images and data show us a very interesting, similar weather pattern in the past, present, and future, with connections across the oceans and different layers of the atmosphere.
Of course, we never see the exact same weather in 2 different years, despite similar events like the La Niña or El Niño. But what the data shows is that on average, these events can create (or emerge from) a specific state of the global weather system.
But another more clear impact of the El Niño is already expected for the upcoming 2026 Atlantic Hurricane season.
Atlantic Shield: How Will El Niño Impact the 2026 Hurricane Season for the U.S.?
Based on the available data, it is well known that an El Niño event reduces the number of Hurricanes and tropical systems overall in the Atlantic. The reason is that El Niño brings higher pressure to the Atlantic, stronger wind shear, and a more stable atmosphere, preventing the storms from organizing and powering up into large systems.
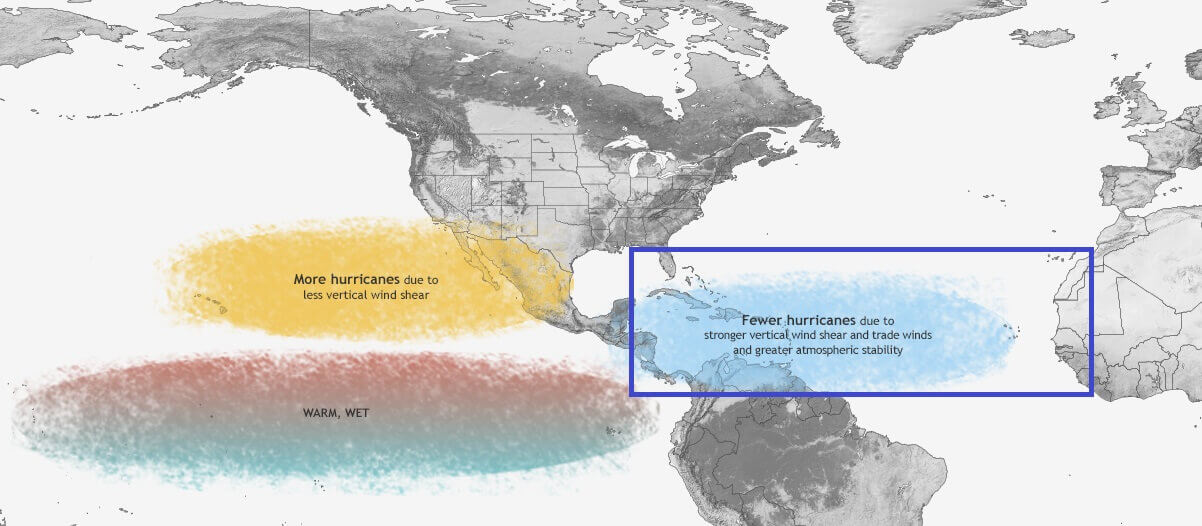
Looking at precipitation reanalysis data, you can see much less precipitation in the main development zone during an El Niño. The south coastal areas of the United States, the Caribbean, and most of the tropical Atlantic are drier than normal, indicating that El Niño is preventing major tropical development or hurricane landfalls.
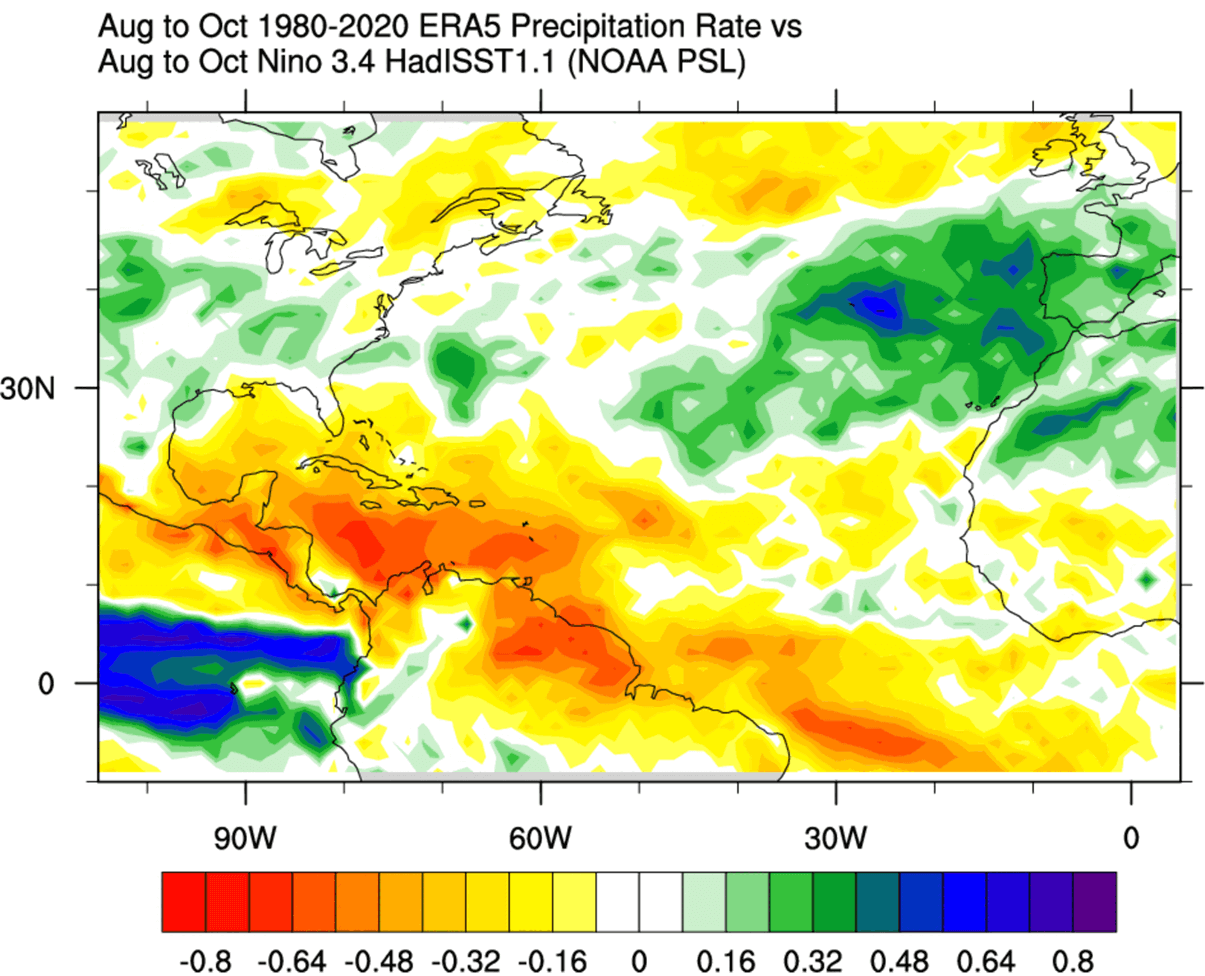
This is mostly due to higher pressure and more stable conditions across the tropical Atlantic. This means fewer tropical storms and/or weaker systems. So, an El Niño can greatly reduce the chance of strong hurricanes impacting the United States.
Below is the latest long-range precipitation forecast for a large part of the 2026 Hurricane season, and it shows well below-normal rainfall in the main development region. This indicates suppressed activity and a lower chance of a major hurricane making landfall on the coast of the United States.
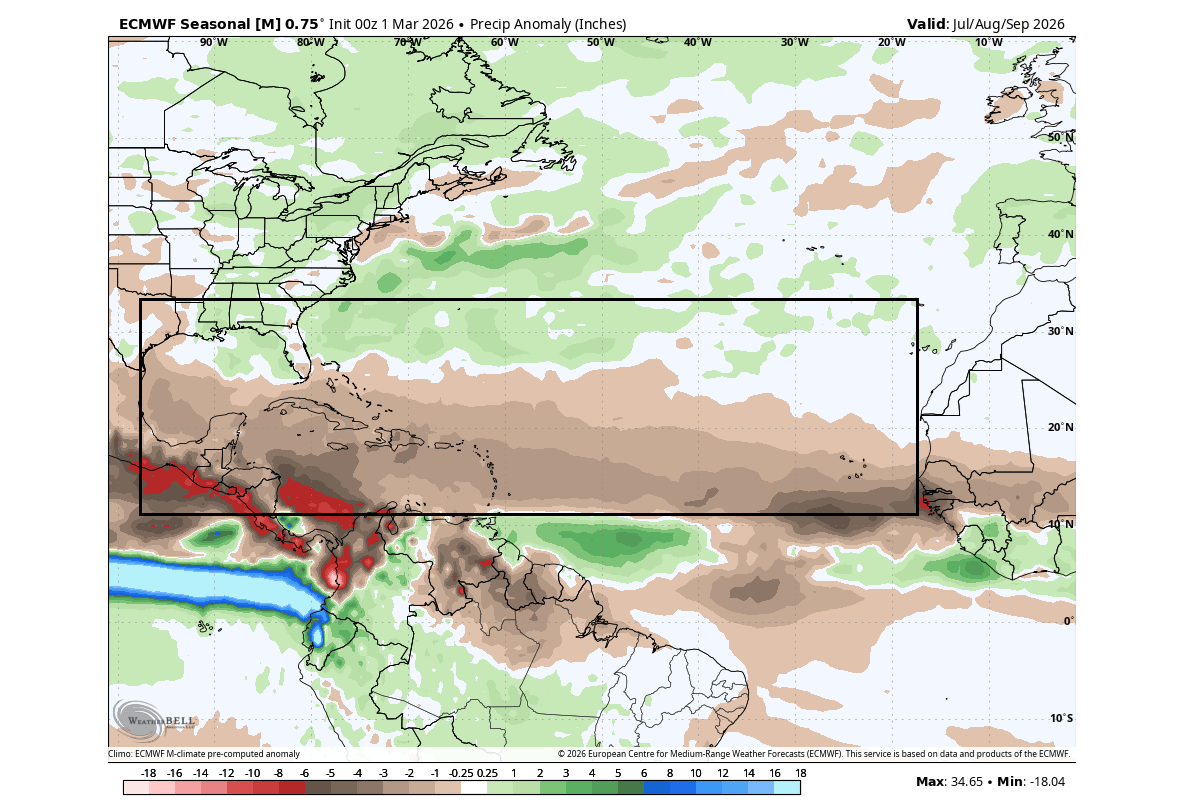
Here we have to add that a lower chance is still not a zero chance. El Niño just makes it harder for storms to organize properly and grow into large systems. Every year still sees at least some tropical storm activity, even during the strongest El Niños, and a single system can still sometimes manage to get through the atmospheric “cracks”. The El Niño just acts as a natural “shield” for the U.S. coasts.
But the main impact of El Niño usually occurs during the Winter season, when the pressure systems are strongest over the Northern Hemisphere, and there is much more atmospheric energy at play.
The Winter 2026/2027 Outlook: A El Niño Season in the Making
During the El Niño winter season, there is typically a strong and persistent low-pressure area in the North Pacific. That pushes the polar jet stream further north, bringing warmer-than-normal temperatures to the northern United States and western Canada.
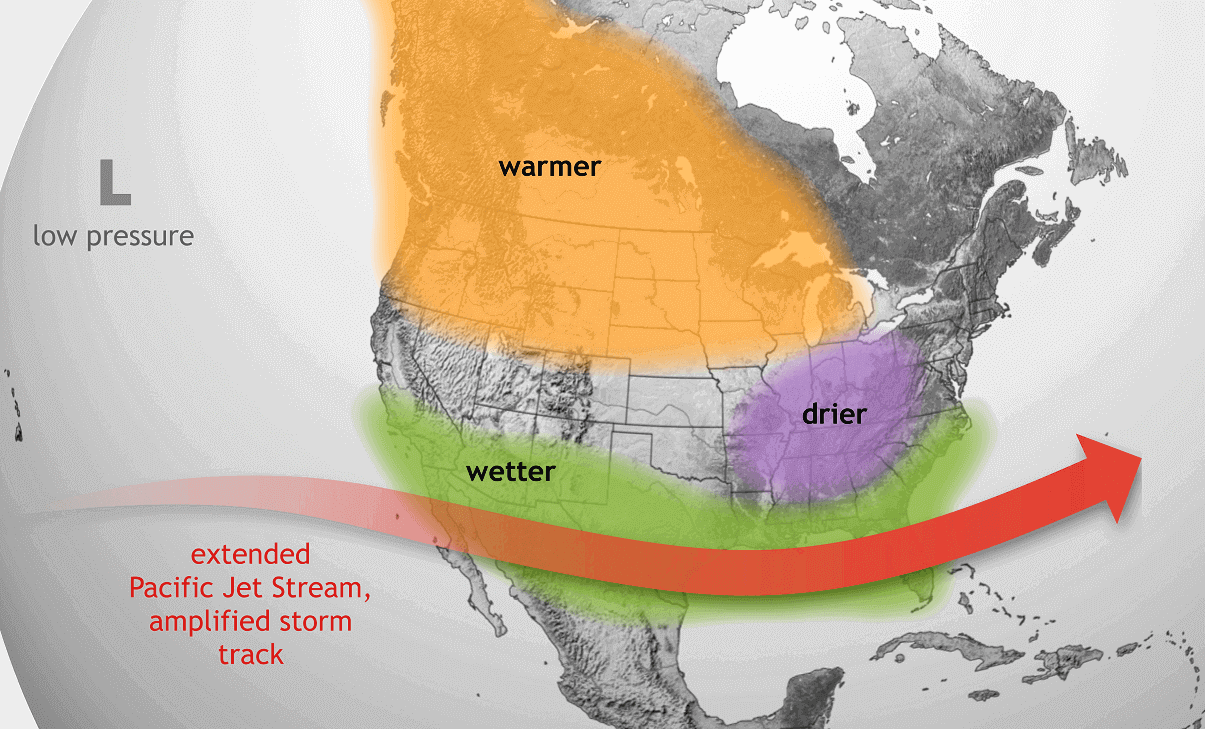
But the southerly Pacific jet stream gets amplified during an El Niño. That means more low-pressure systems and storms over the southern half of the United States, with lots of precipitation and cooler weather.
Below, we produced three images that show the El Niño winter anomalies in past years from the ECMWF ERA-5 dataset. We first used the same years as above for the Summer outlook, but now we can simply look at how all those years advanced into winter with an active El Niño.
The data shows that El Niño winters in similar years were warmer than usual across Canada and parts of the northern United States. At the same time, colder temperatures prevail over the western, southern, and eastern United States.
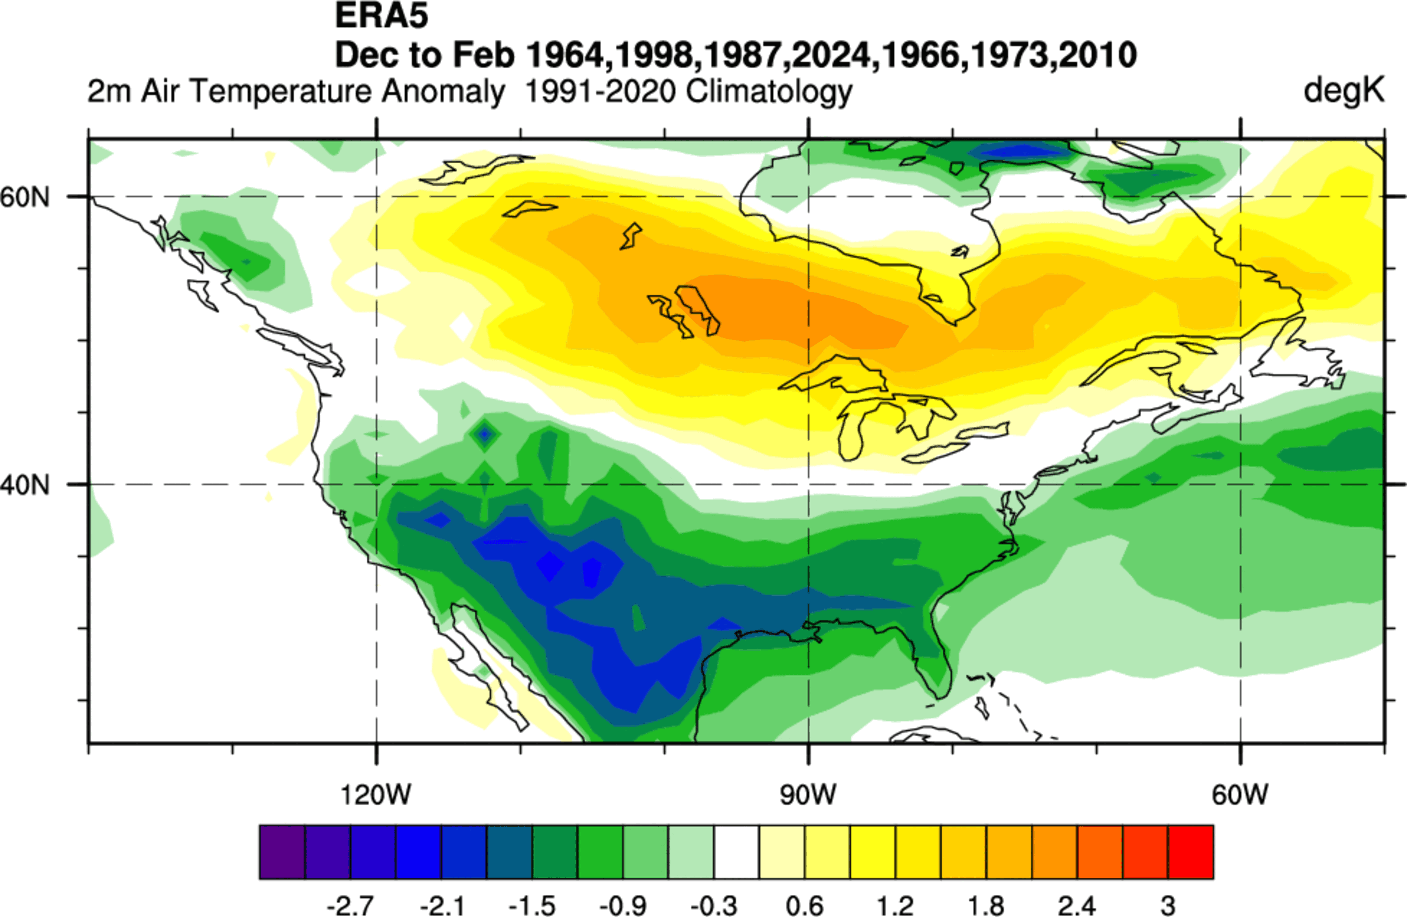
This appears to be a more typical El Niño winter pattern, with the difference that in these specific years the colder temperatures covered more of the western and eastern United States than in an average El Niño cold season. The strength of the upcoming El Niño will also play a major role in the winter temperature patterns.
An El Niño event also significantly alters snowfall patterns. The data shows less snowfall in the northern United States and the Midwest during an average El Niño winter. But we see snowfall over eastern Canada, in the central and southern United States, across the Plains, and also over the eastern United States and into the Northeast.
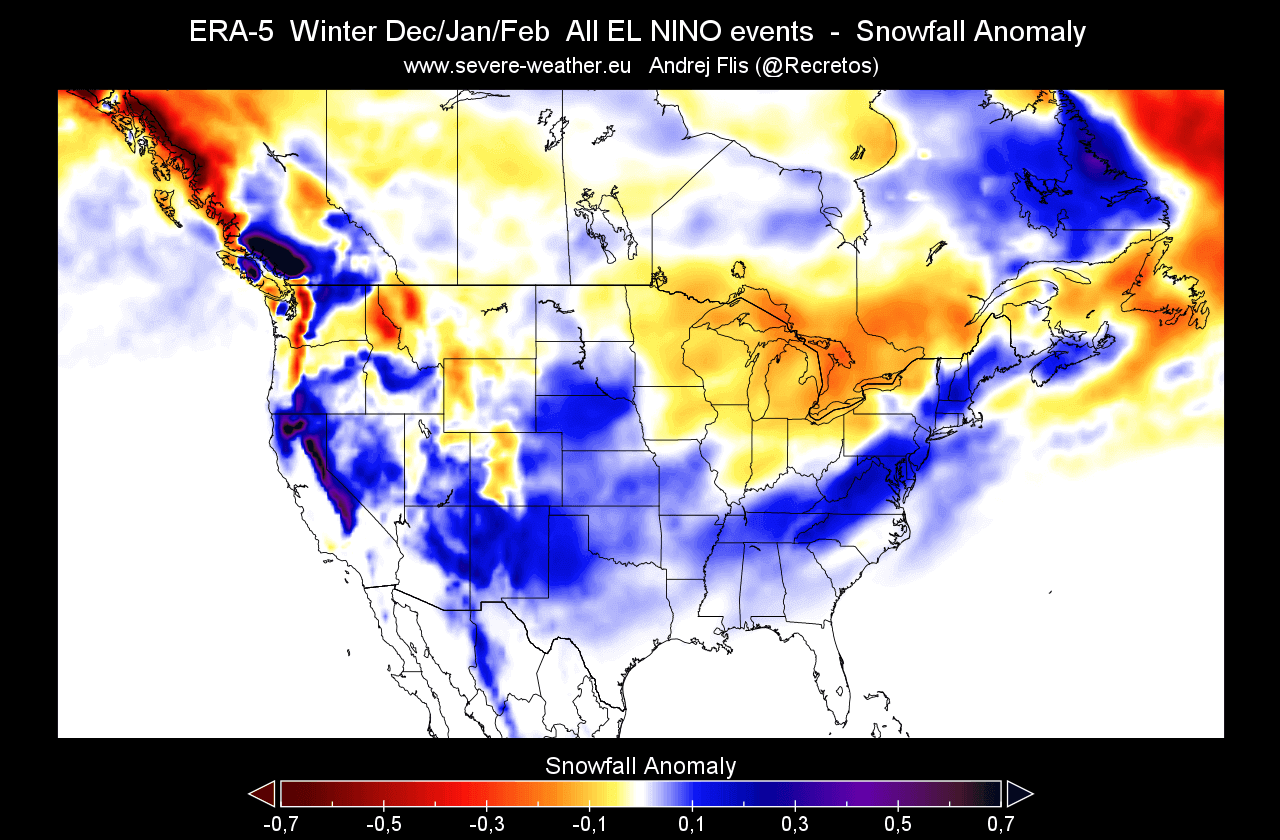
This is because low-pressure systems are trailing across the southern United States during an El Niño. With cooler air and moisture (if available), the chances of snowfall increase in the southern half of the country and towards the east. But a lot depends on the availability of the cold air from the north.
We can also see less snowfall over the Midwest, but that is likely associated with an overall drier pattern over this region, very typical for an El Niño winter.
Europe also feels the impact of an El Niño in winter. But the impact here is buffered through the North Atlantic pressure anomalies and patterns.
Looking at the temperature anomalies for Europe, the specific years show a cold winter trend over the northern parts of the continent, spreading occasionally down into the western and central parts. Keep in mind that there are some older and colder winters in this combination of years.
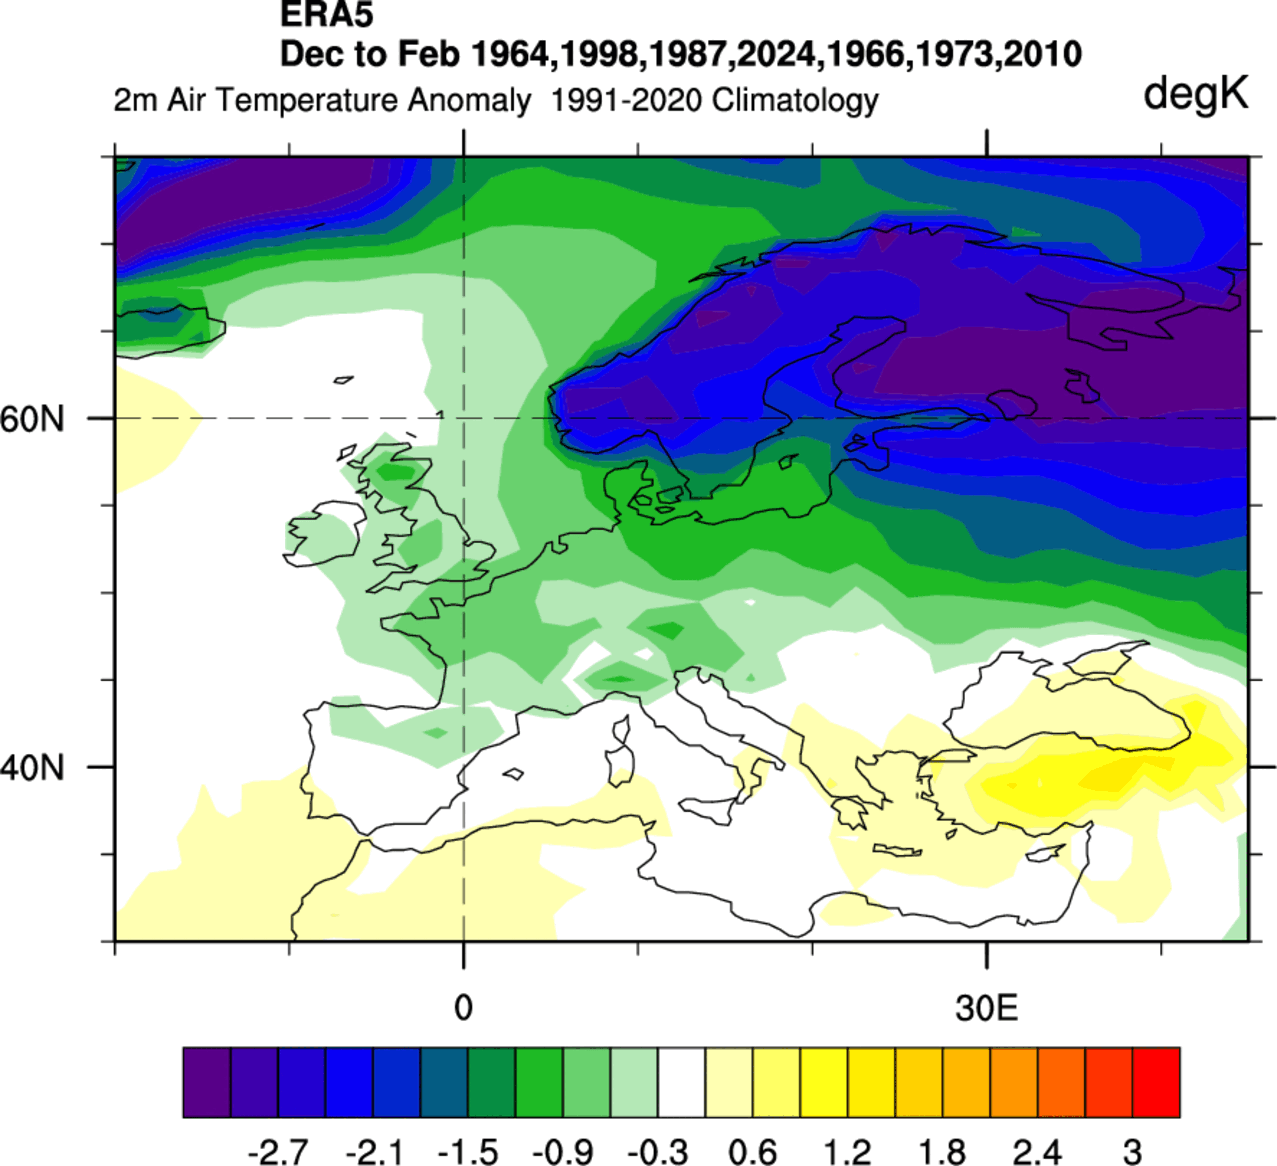
We do have to consider that Europe is usually not directly under El Niño’s influence, but can still feel global changes that affect weather patterns across the whole Northern Hemisphere.
Forecast images in this article are from cyclonicwx.com and WeatherBell, using a commercial license.
We will keep you updated on global weather development and long-range outlooks, so bookmark our page. Also, if you have seen this article in the Google App (Discover) feed, click the like (♥) button to see more of our forecasts and our latest articles on weather and nature in general.
Don’t miss: