A powerful ocean shift is currently unfolding in the Indian Ocean, driven by changing winds and pressure patterns. Despite being far away, this anomaly is connected into the global weather system, and could play an important role in shaping the Winter 2025/2026 outlooks over North America and the rest of the Northern Hemisphere.
Ocean anomalies are always closely monitored, especially as winter approaches. That is usually due to their known influence on atmospheric flow and pressure patterns.
We will look at the ocean anomaly in this area, how it connects to the global weather system, and how we can expect this event to also impact the Winter 2025/2026 forecasts and weather patterns.
THE IOD OCEAN EVENT
The new ocean anomaly is called the Indian Ocean Dipole (IOD). It occurs in the Indian Ocean and consists of two poles, hence the name “dipole.” The eastern part of this anomaly is located around Indonesia, and the western part covers the western Indian Ocean.
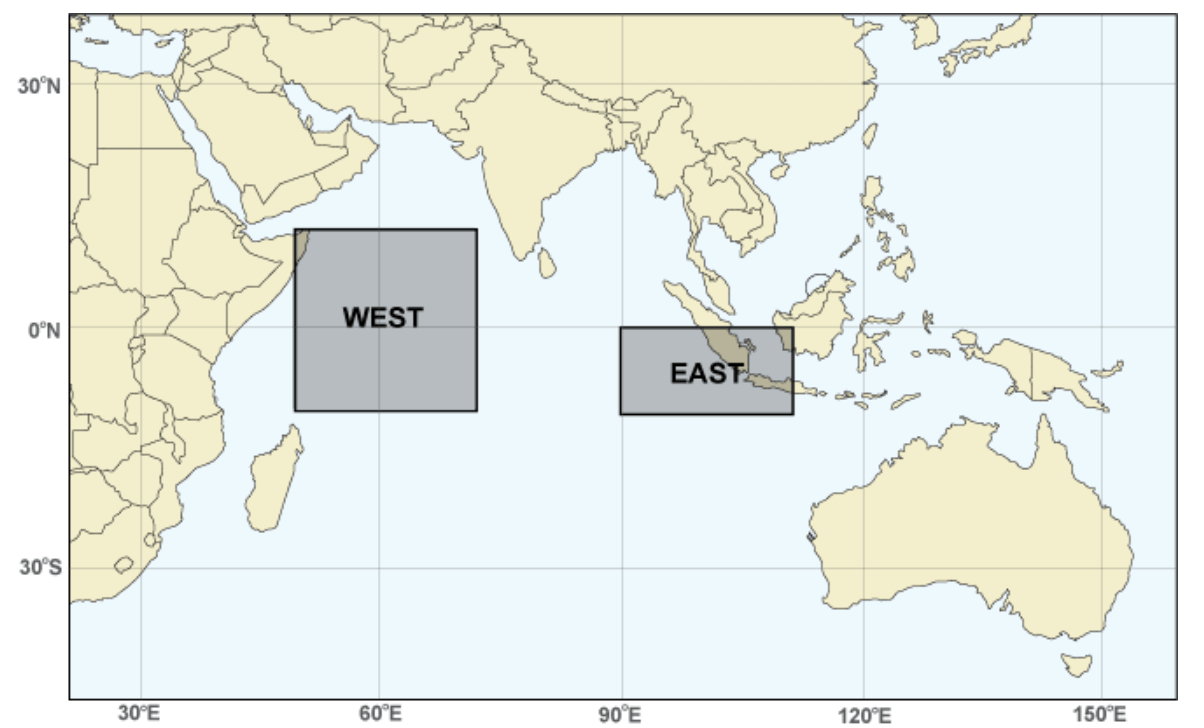
The IOD is basically an imbalance in ocean temperatures between the east and the west. Changes in ocean temperatures between the regions occur due to changes in trade wind patterns and tropical convection. As any other major ocean anomaly, the IOD also has two phases, positive and negative.
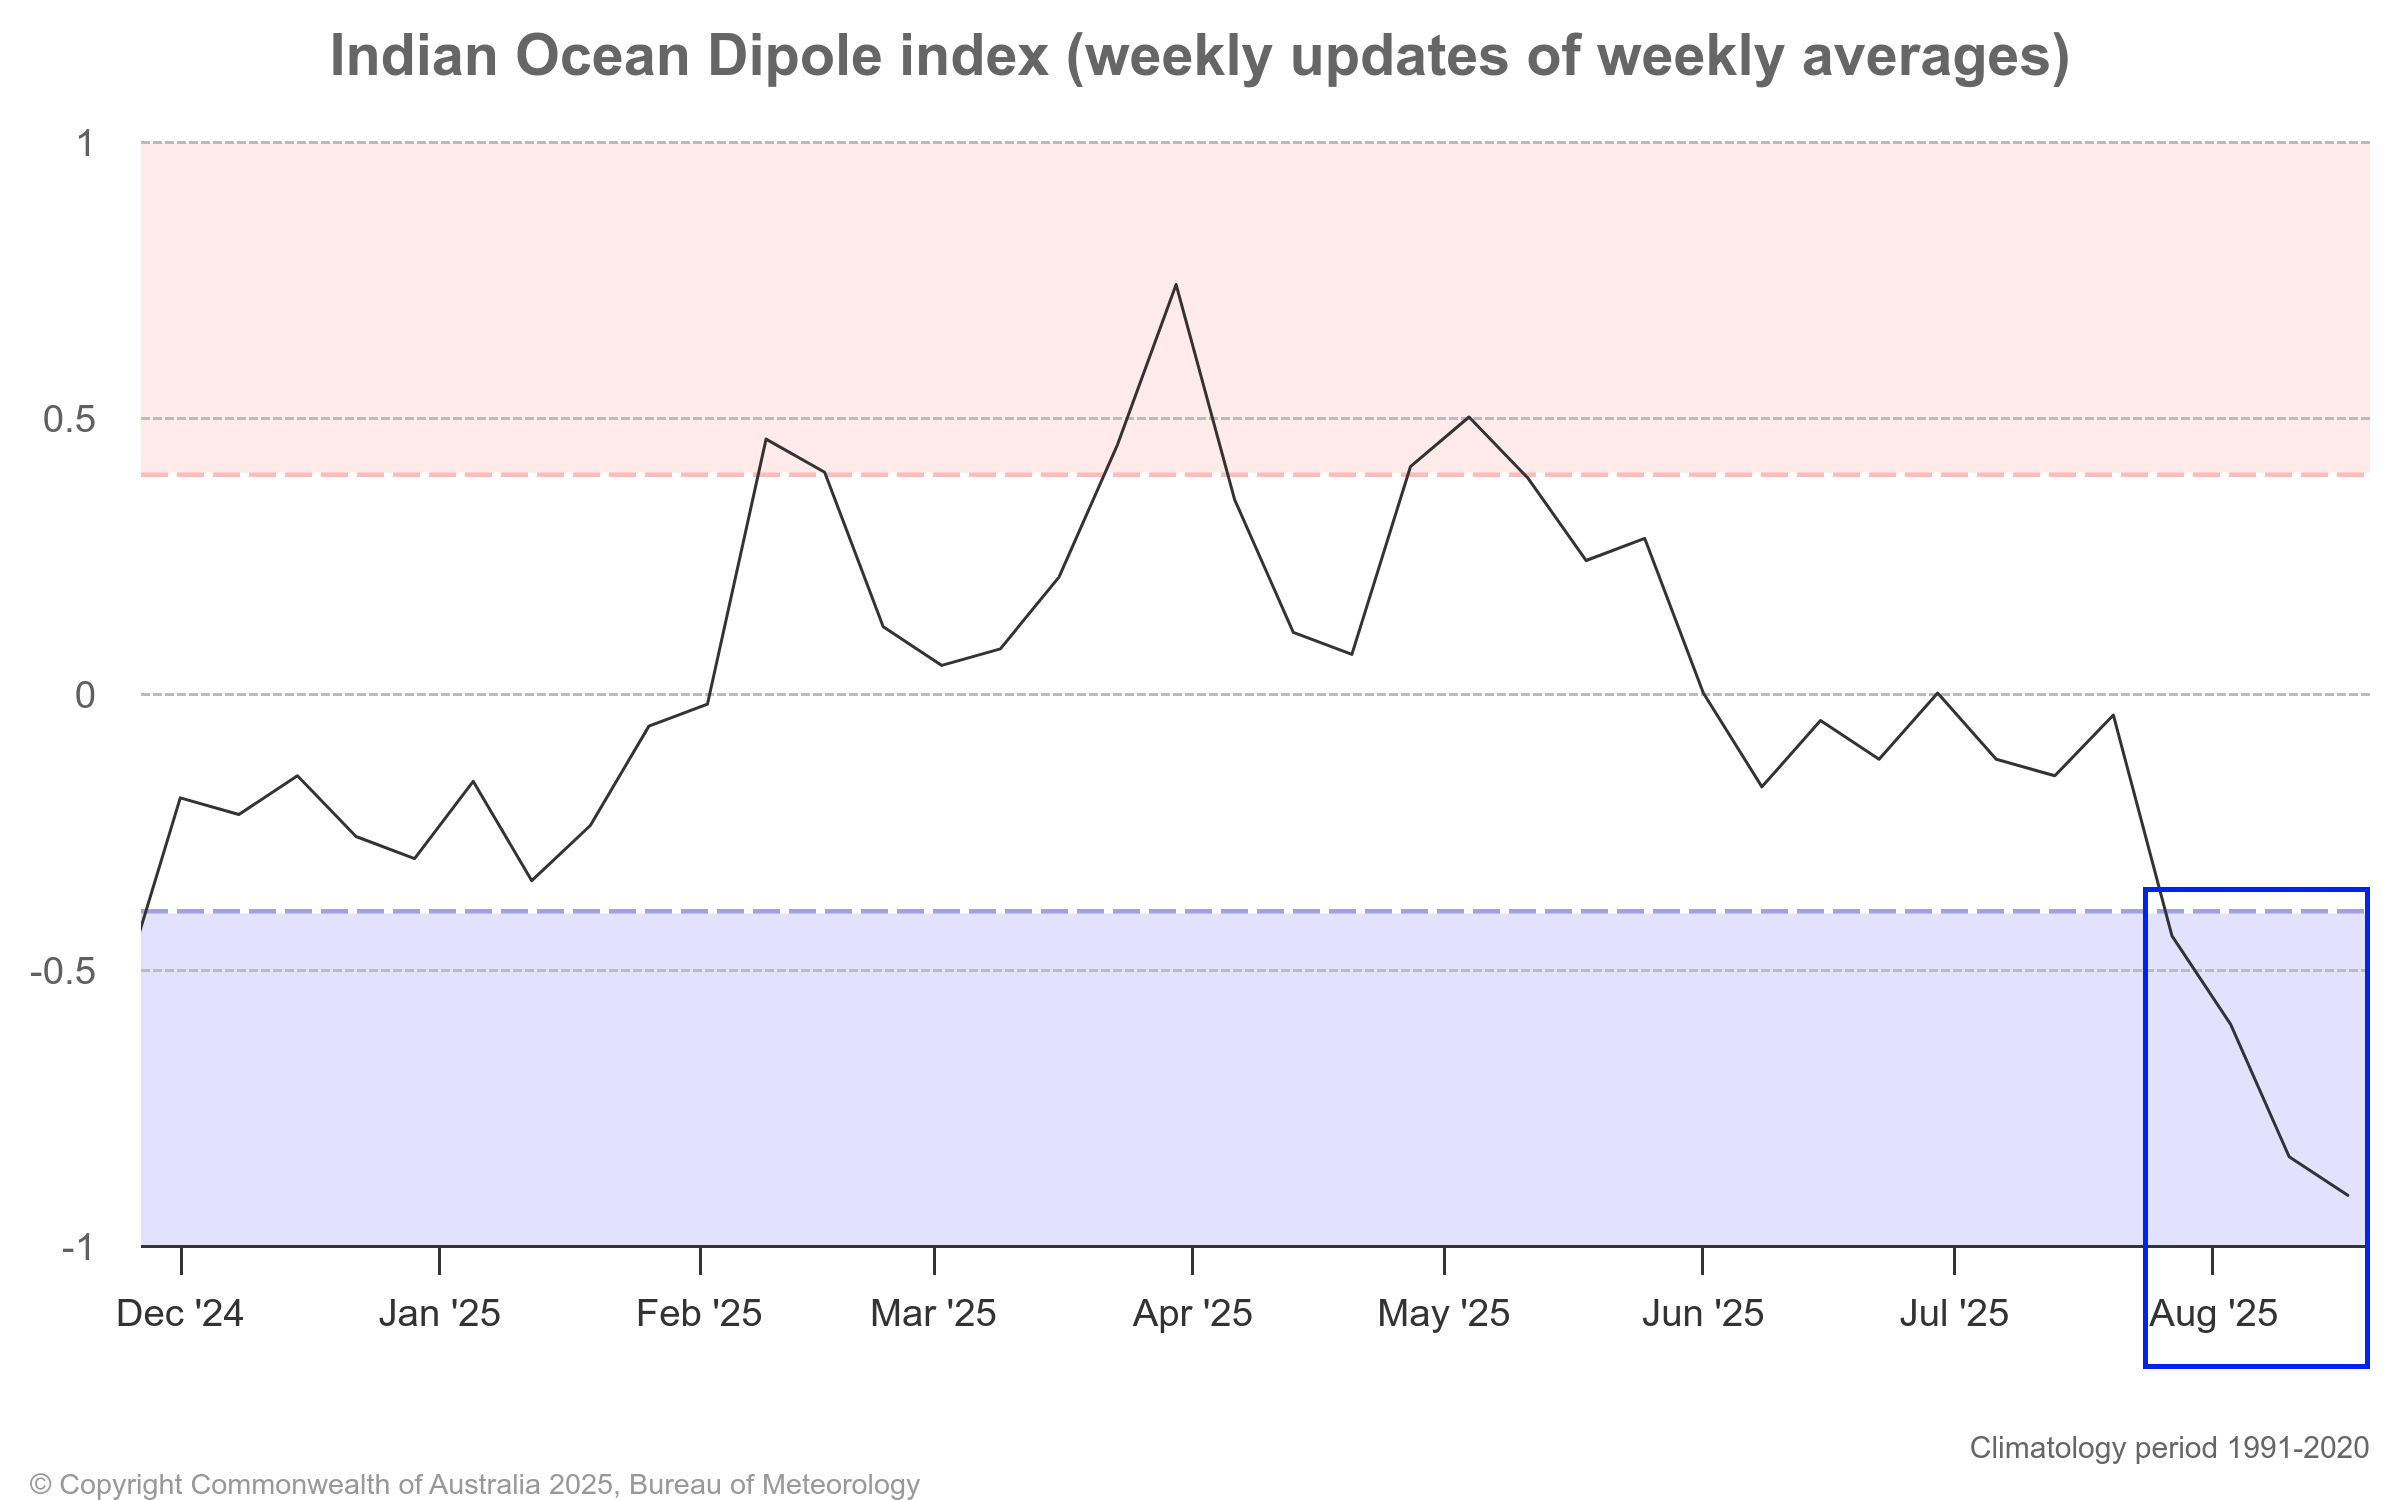
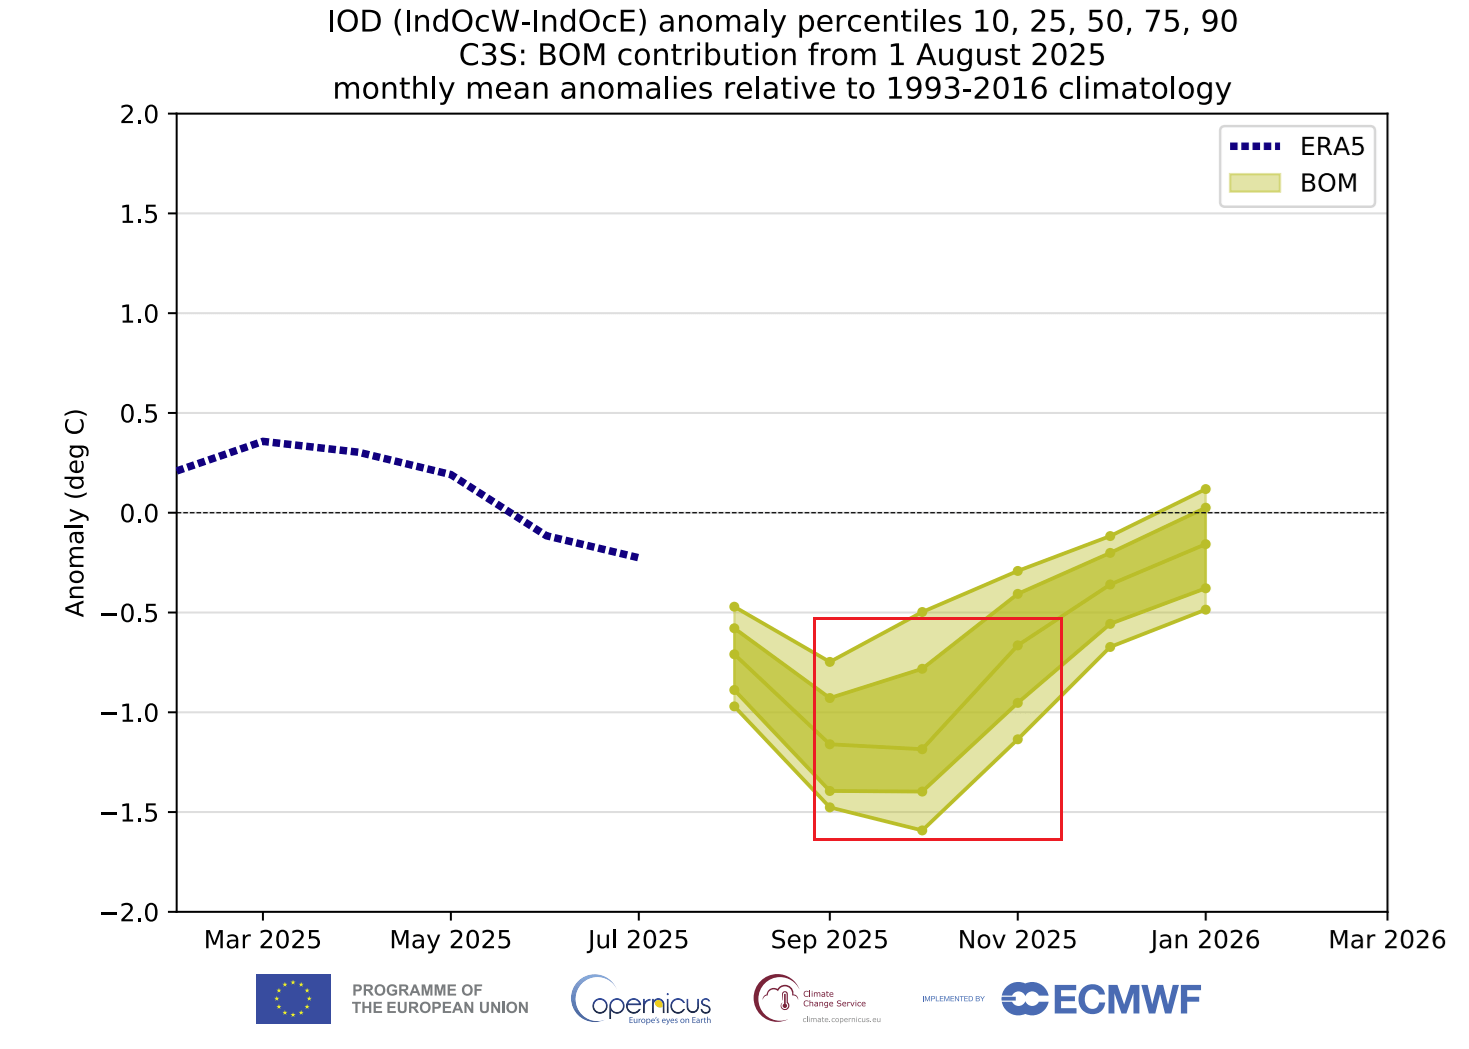
Looking at the latest weekly graph analysis, you can see that we were in a weak warm-neutral phase so far in 2025. But looking at the latest values, the IOD made a drastic reversal into a negative phase, reaching well beyond the official threshold of -0.4 degrees.
Below, you can see the typical atmospheric circulation pattern during a negative IOD phase. In this phase, the air is sinking in the western region and rising in the eastern region. That creates a large-scale atmospheric cell, increasing the importance of the IOD to a much larger scale than just regional. Image by NOAA-Climate.
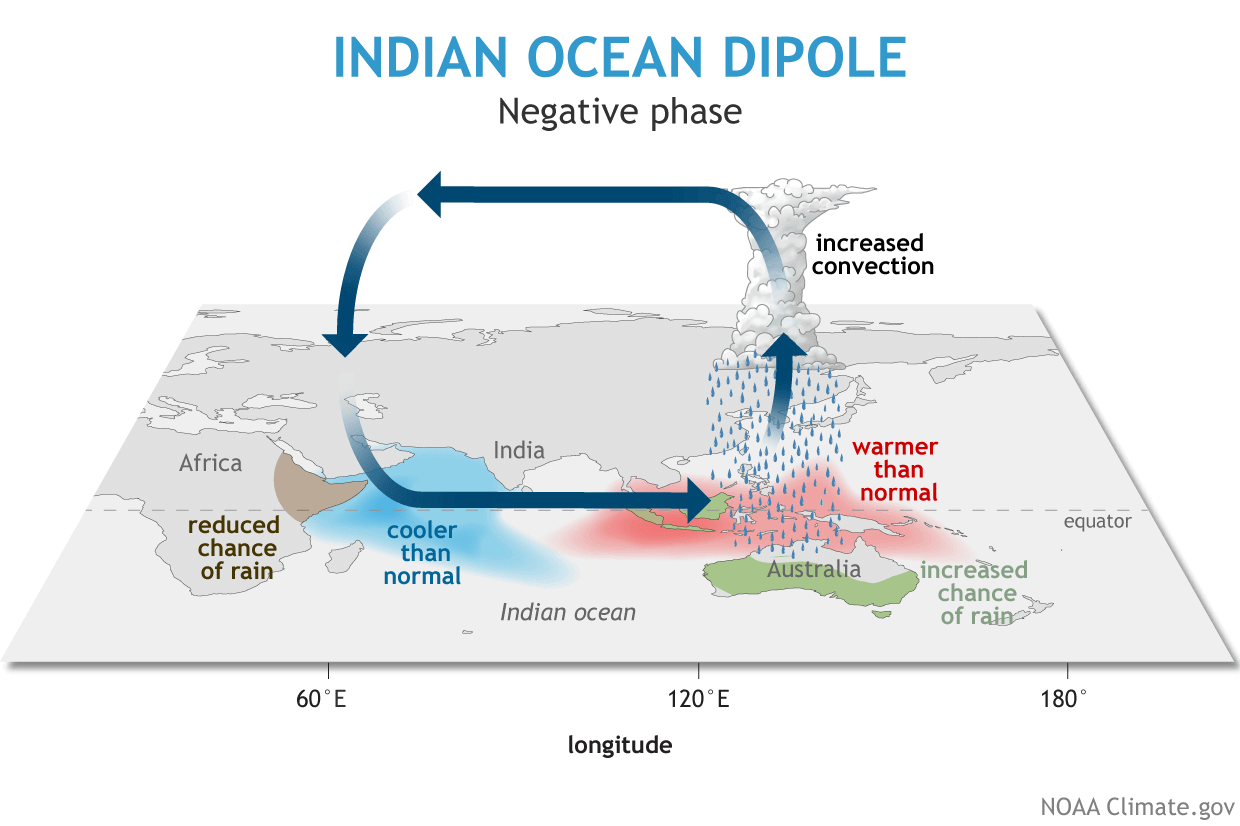
As you will see further down, this filtrates into the global atmosphere, bringing along its own set of weather influences.
AN ANOMALY ON THE RISE
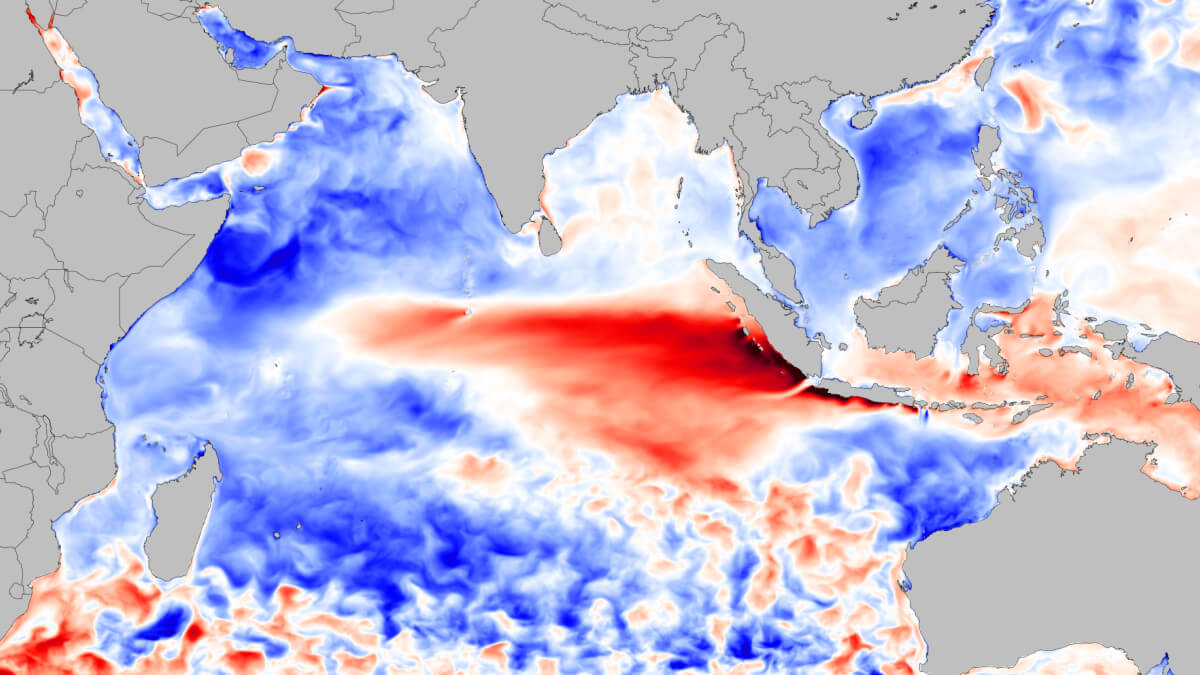
The latest ocean analysis nicely shows a temperature difference between the eastern and western regions of the Indian Ocean. So you can see colder anomalies in the west (blue box), but in the eastern parts, you can see a large area of above-normal anomalies. This is a textbook negative IOD pattern.
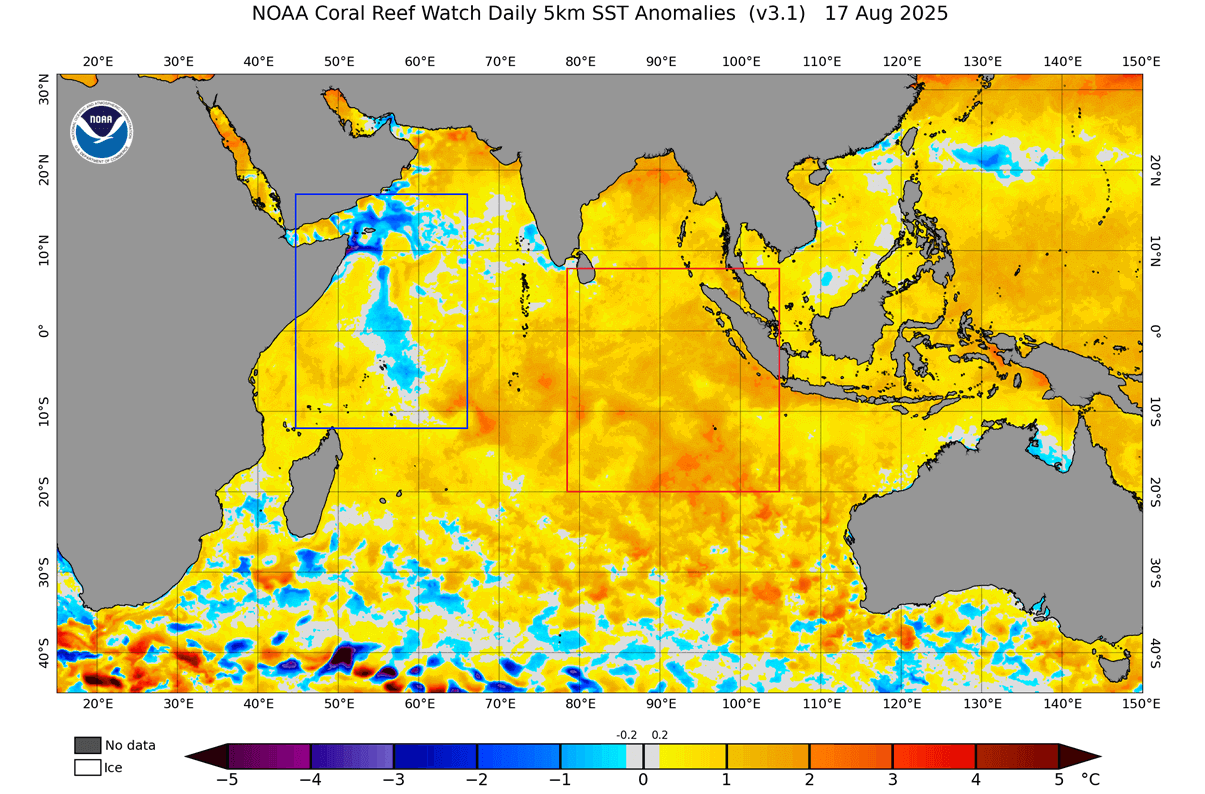
Looking at the 7-day temperature changes across the region, you can see the further cooling of the western regions and warming in the east. This further increases the strength of the negative IOD, and the lower it goes, the more influential it can become for the upcoming weather seasons.

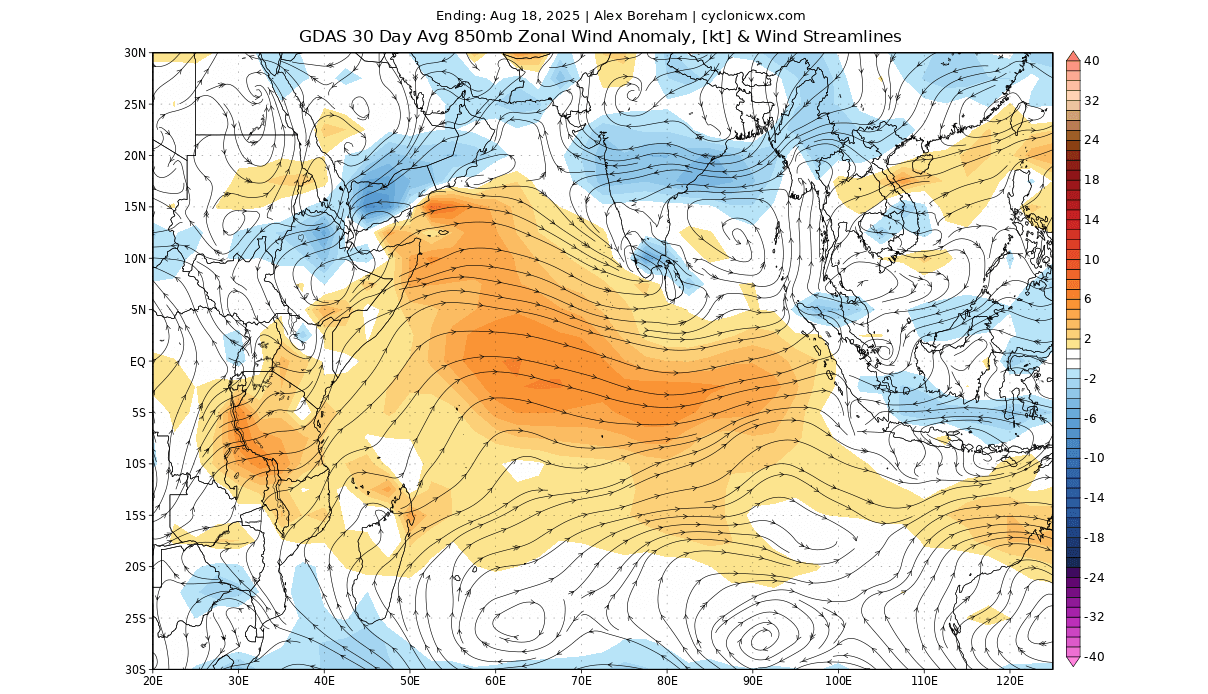
As mentioned, the driving force behind these ocean anomalies are trade winds, the prevailing easterly winds that circle the Earth near the equator. Stronger trade winds mean easterly flow, which cools the ocean surface. But weak trade winds mean less cooling or even a warmup period for the ocean surface.
Below you can see the zonal wind anomaly in the lower levels of the atmosphere for the past 30 days. As the image shows, there are increased westerly winds across the Indian Ocean, which promote warmer oceans in the east, driving the negative IOD event.
But the forecasts take the IOD much further than it’s currently. Below is the latest forecast, which shows a quite significant negative IOD event, reaching down into -1.3 degrees. This would be considered a strong event, giving it more confidence and power to impact the global seasonal weather in some shape or form.
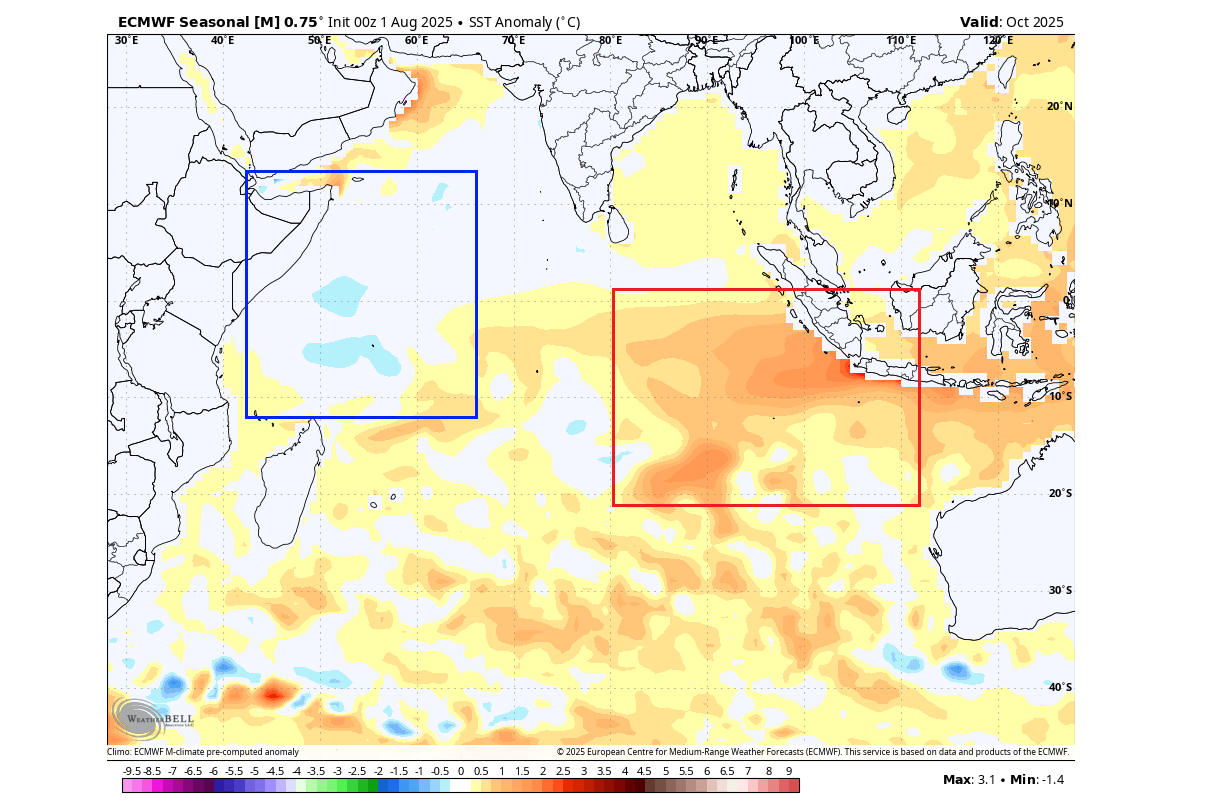
Looking also at the ECMWF seasonal forecast, you can see the ocean temperature forecast for late Fall. Below normal temperatures are found in the western part, while a strong warm anomaly is present over the eastern parts. This is a significant difference, which explains why the index forecast above goes so low.
This ocean event is also connected to a larger and much more famous anomaly, the La Niña in the tropical Pacific.
GLOBAL ATMOSPHERIC CONNECTION
When talking about ocean anomalies, we cannot ignore the ENSO events (La Niña and El Niño). We talked about it in much more detail in our recent articles, which will be linked at the bottom of the article.
But looking at the image below, we have the typical ocean temperature anomaly pattern for a negative IOD event. You can see it marked in the left box, and it shows the typical pattern of warmer waters in the eastern Indian Ocean and cooler waters towards the west.
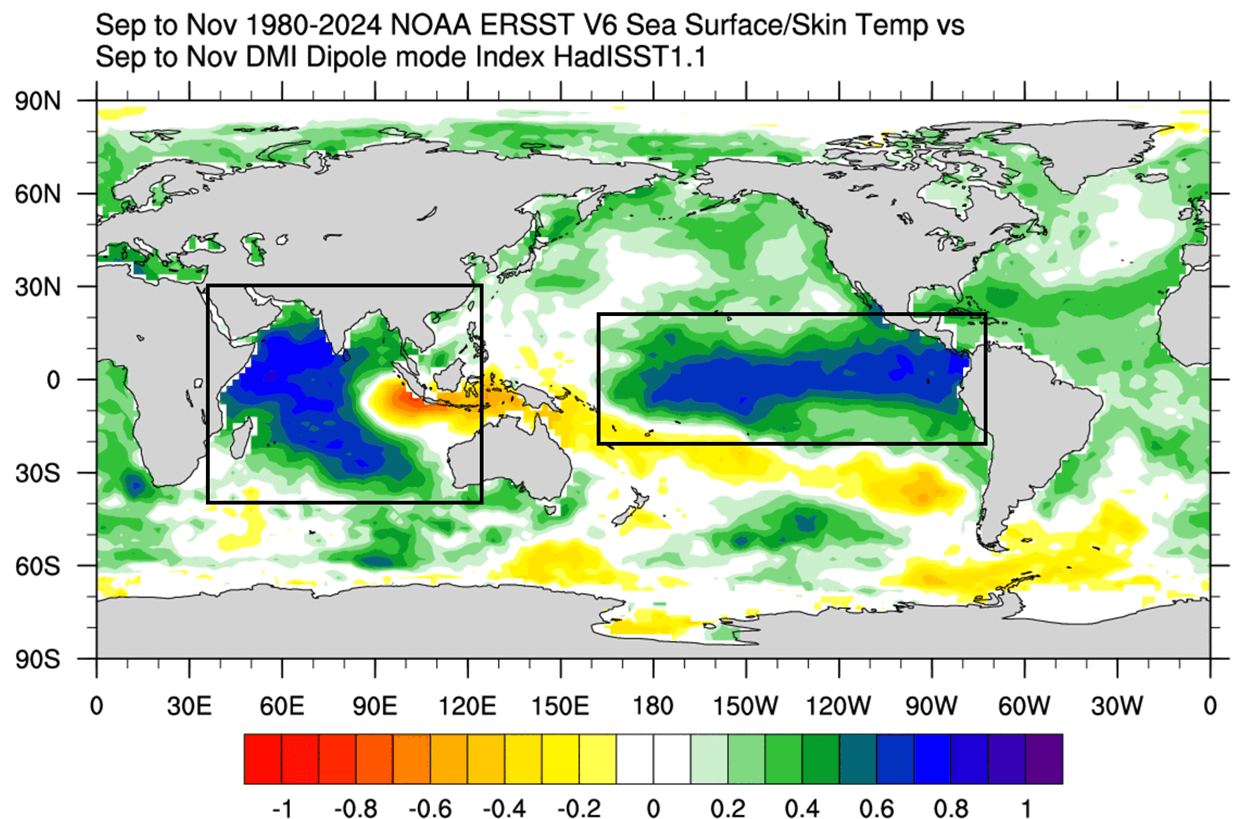
But notice in the Pacific Ocean how there is also a large cold anomaly. That is the ENSO region, and the cold anomalies are the La Niña phase. What this tells us is that the overall atmospheric circulation that creates La Niña conditions is also helping to create a negative IOD phase. So, we can say that this is a very delicate and connected feedback system.
Below, we have the latest global ocean temperature anomaly, and you can see the main regions marked in the image. Notice the opposing anomalies of the IOD regions and the cooling area of the ENSO regions, expected to go full La Niña this Fall.
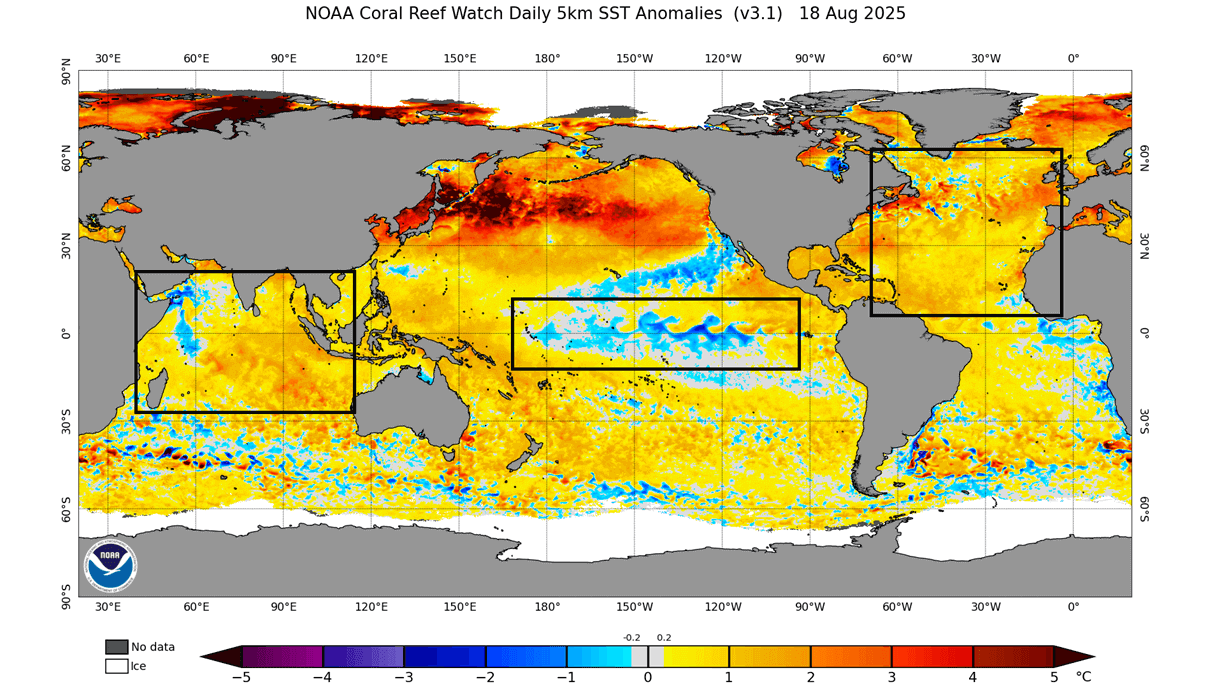
But notice also the large warm North Atlantic area. A recent study has suggested an important role of the warm Atlantic temperatures in the overall connection and “communication” between the IOD and the ENSO regions.
You can see the main image from that study below, which shows the whole circulation system in action. This nicely shows how connected the global weather system is, and how every part plays its role in creating the global weather patterns.
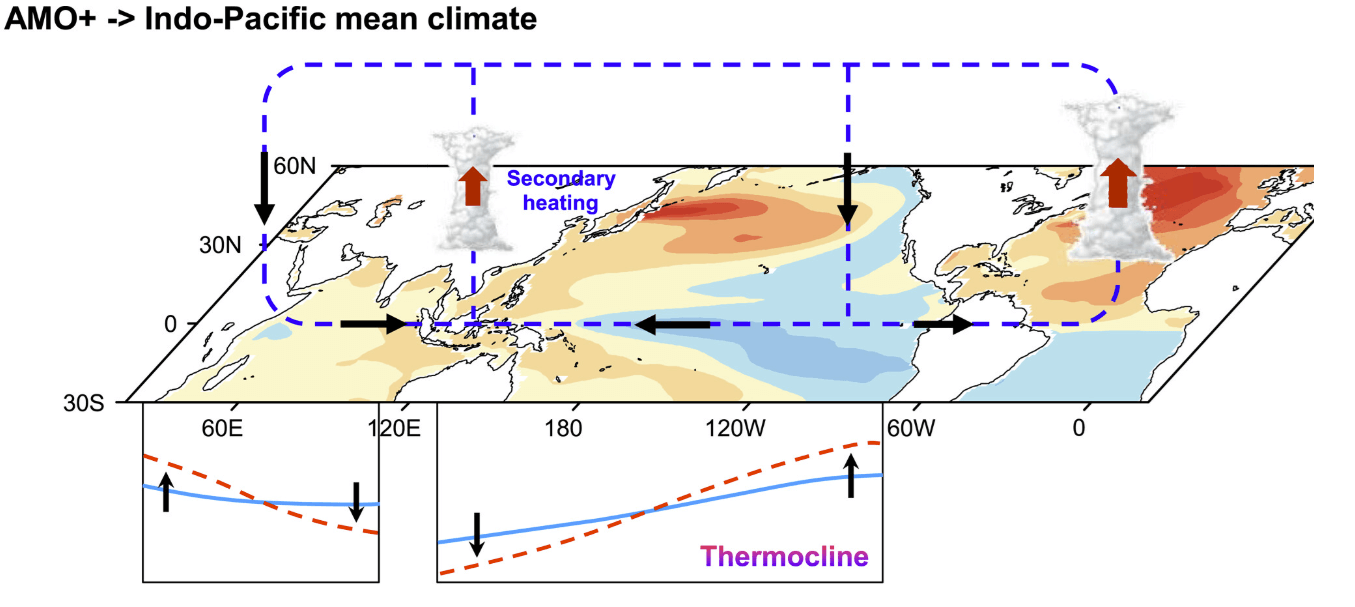
The combination of a warm North Atlantic Ocean and a developing La Niña can explain why the IOD is forecast to go into strong negative levels. With the cold ENSO and a warm Atlantic, we can always safely expect a formation of a negative IOD phase.
To put the whole IOD in perspective, we added a video below. It shows a positive phase rather, but nicely reveals the dynamics of the region, and how the IOD works in reality with changing surface anomalies.
We know that a negative IOD phase is coming. The main question now is how it can impact the upcoming Winter weather if it reaches that far into negative values?
WINTER PATTERN CHANGES
The overall mechanics behind the IOD are related to the driving mechanism of the ENSO regions that will form a La Niña this Fall and Winter. Overall, it all connects into one system, creating the final daily weather.
For the IOD winter analysis, we can simply use the past negative events and make a composite of all winters following a negative event. Of course, this comes with an issue, as all those winters had other global factors at play, not just IOD.
But since IOD is also connected with the ENSO and the global weather system, we can expect other combined factors to also play their role, so we can see a rough outline of how a negative IOD winter can shape out. We focused on North America, as here the impact of the ENSO is also more direct and less noisy compared to areas like Europe.
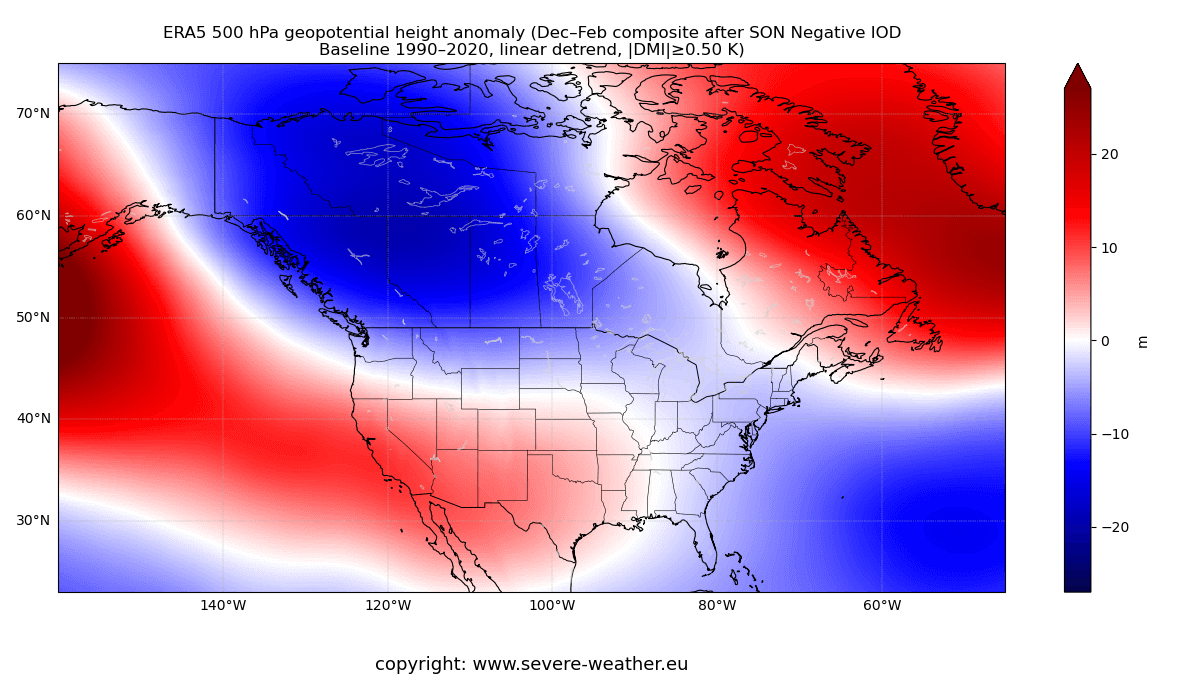
Below is the negative IOD winter pressure pattern, which shows a large low-pressure area over Canada. It expands over the northern and eastern United States into the Atlantic. An important feature here is the high-pressure anomaly over Greenland, blocking the flow and helping to power the large low-pressure anomaly.
Below is the winter temperature signal, which shows a cold air anomaly over western Canada and the northern, central, and western United States. This shows a large pool of cold air that is available to be released into the central and eastern United States. The data here is based on actual past winters.
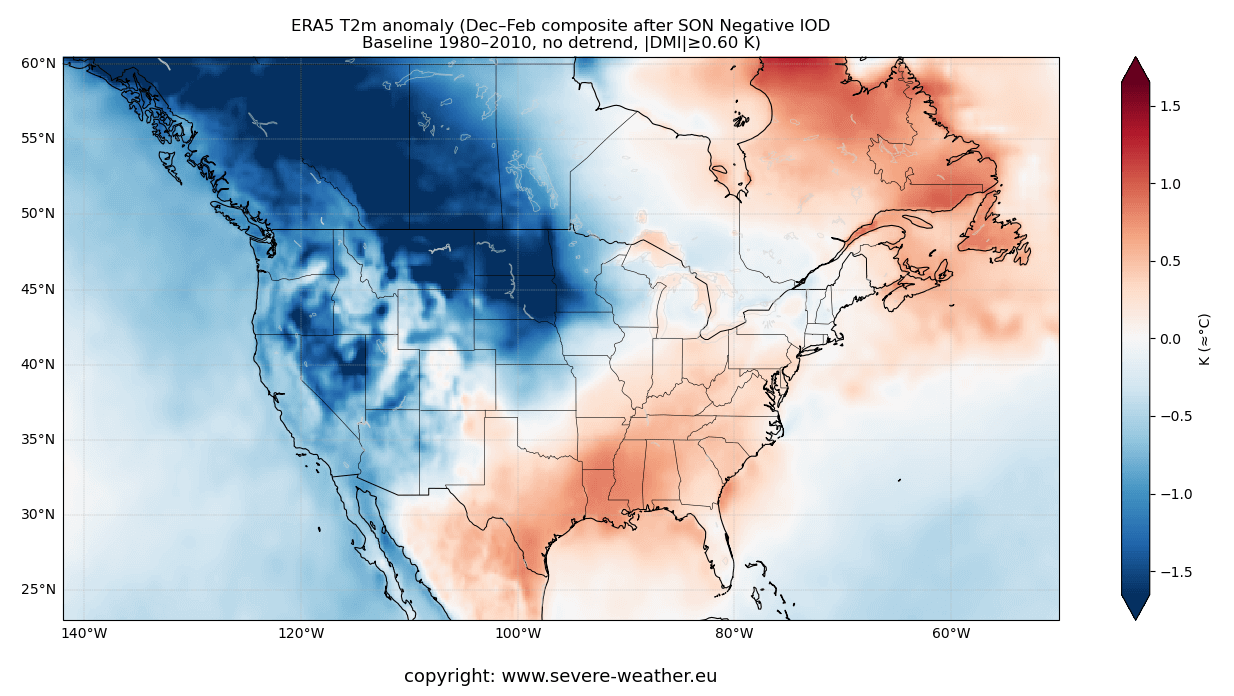
The eastern United States is shown with a warmer anomaly, but such a cold pool is more than large enough to send occasional cold air events into the east. But as this is a 3-month average, those individual events can get lost in the average. You can still see some cooler hints over the northeast despite this being a 3-month mix.
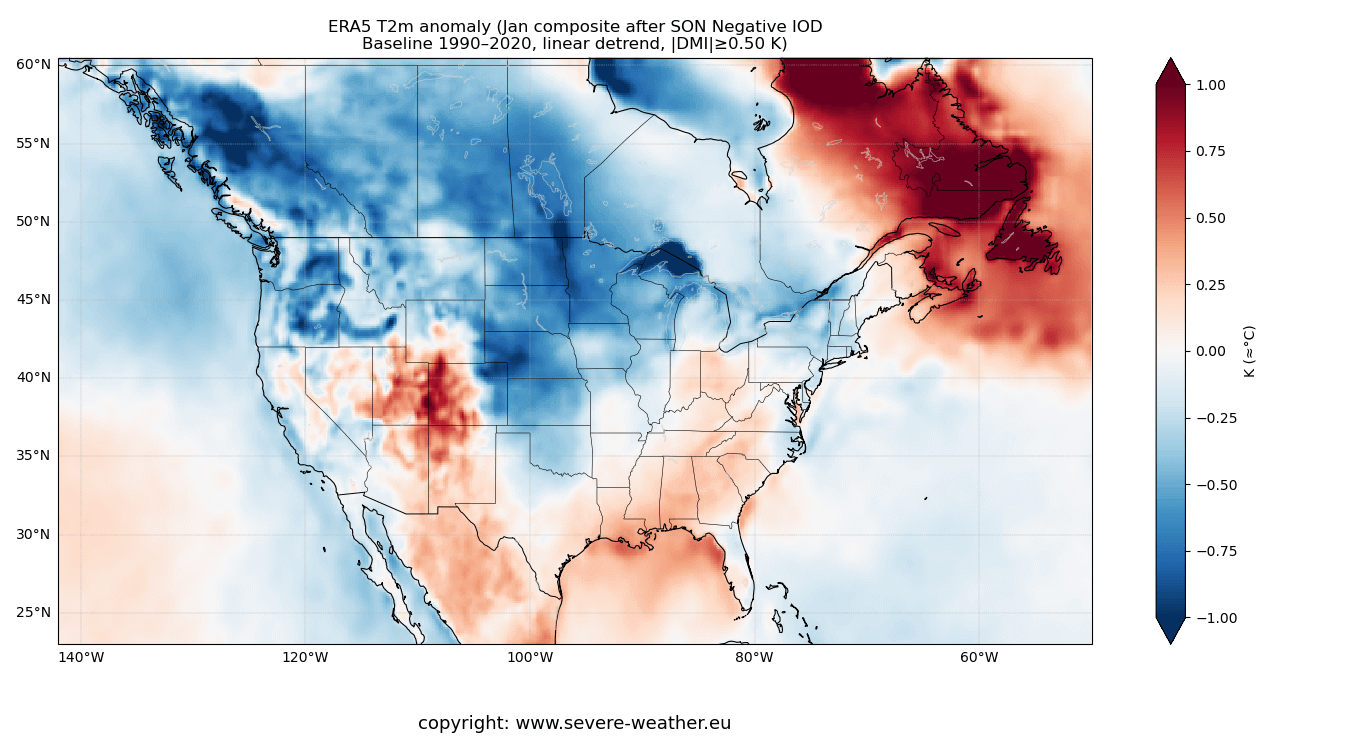
If we look at a single month analysis for the same years but only January (mid-winter), you can see a different spread of the cold anomalies, now also covering the Midwest and the Northeastern United States. The warm anomalies are also much weaker over the remaining parts of the eastern United States.
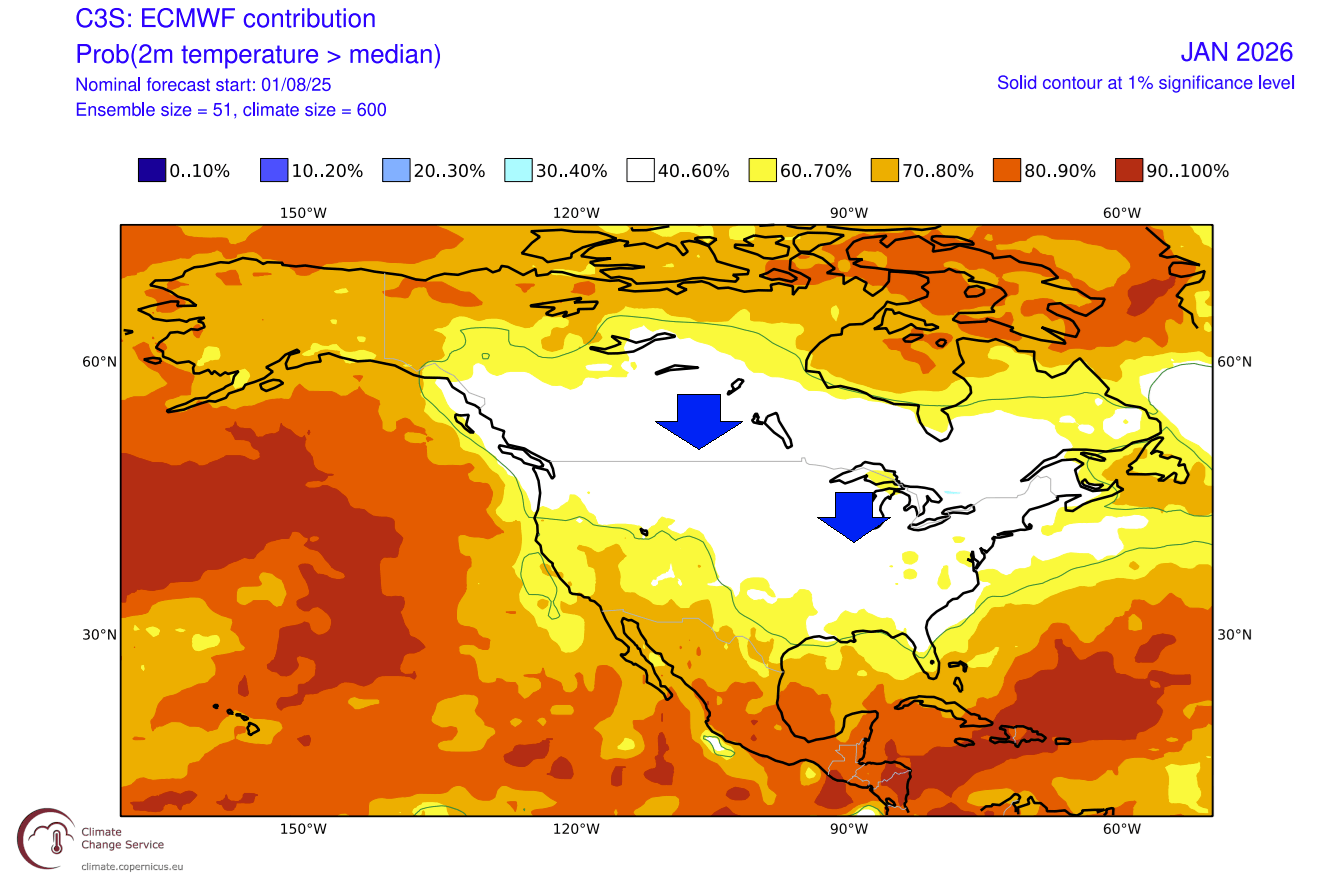
If we compare that to the actual January 2025 forecast, it shows a large area with no warm anomalies, centered over southern Canada, and spreading over the northern and eastern United States. This indicates a northerly flow, bringing the potential for some colder winter days to a large part of the United States down from the Canadian cold pool, similar to the negative IOD winters.
One of the main winter maps is also snowfall. Below you can see an image with snowfall anomalies for negative IOD winters. It shows more snowfall than normal over the northwestern United States, the Midwest, and parts of the northeast. Also, there is increased snowfall over parts of the lower Plains and the eastern United States.
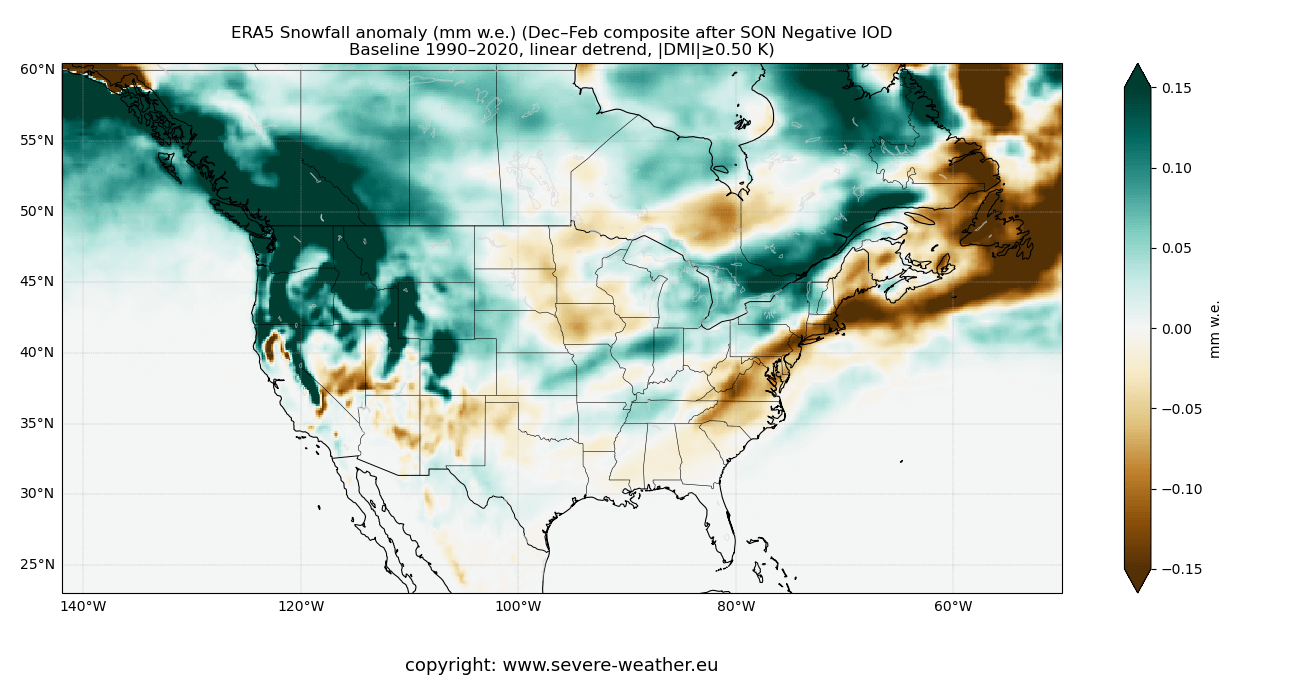
This is, of course, connected with the La Niña influence that usually comes with a negative IOD phase, but both combined can boost each other’s atmospheric influence. We still must consider that local weather systems play a specific role, as well as other global weather drivers.
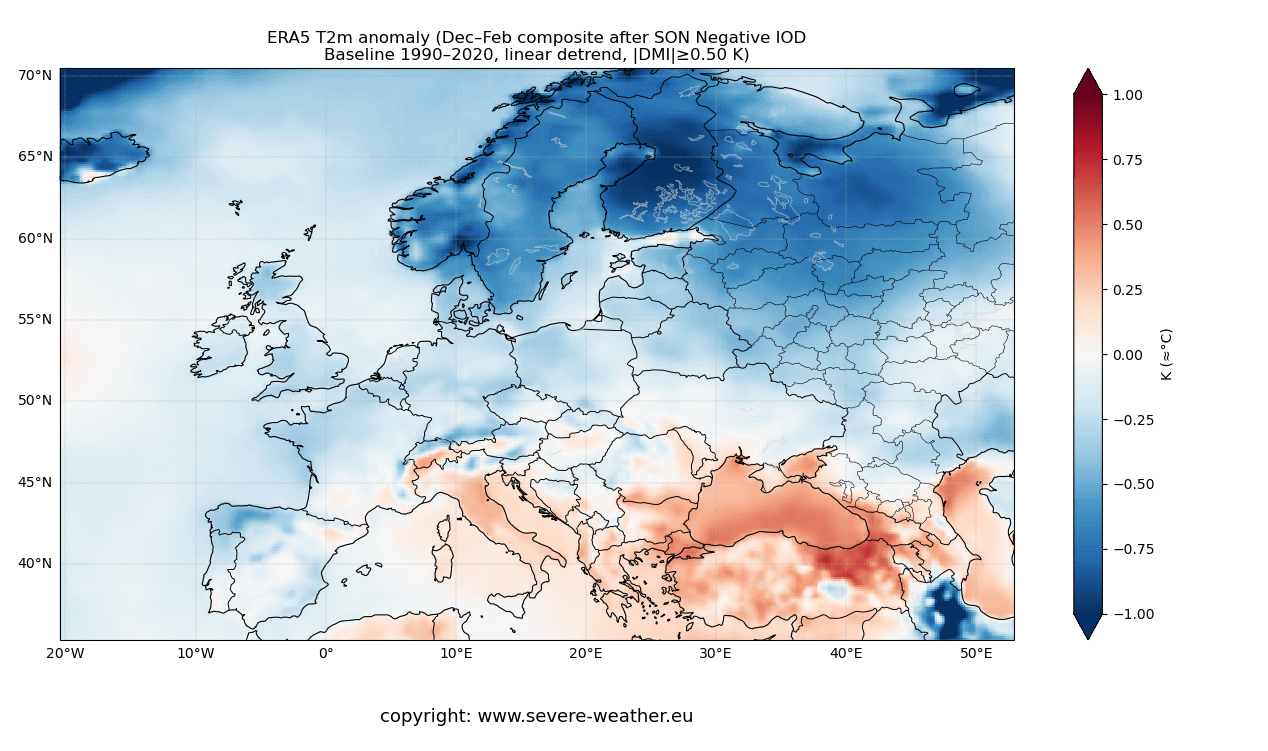
Looking also over Europe, the negative IOD winter signal here is with colder than normal temperatures, over much of the continent. This doesn’t mean that such a pattern will be fixed for 3 months straight, but just shows the background influence of the IOD, pushing for a colder winter against other factors.
That is why the past/historical data can only give us a limited insight into what kind of Winter pattern to expect from these ocean anomalies across the United States, Canada, and the rest of the world.
We will keep you updated on the developing weather trends in the coming seasons, so make sure to bookmark our page. Also, if you have seen this article in the Google App (Discover) feed, click the like button (♥) or add us to preferred sources there to see more of our forecasts and our latest articles on weather and nature in general.
Don’t miss:
Winter 2025/2026 Forecast for the United States, Canada and Europe