Fall is well into the second half, with the final month of the season about to start. Latest weather forecasts show a dynamic pattern across the United States, with a colder start to the month, followed by a warm period mid-month across the U.S. and Canada, and Europe shows mostly normal to above-normal trends. But looking at the Winter 2025/2026 start trends, the models show we might be in for a colder surprise.
In this article, we will first look at the last days of this month, before doing a weather forecast breakdown for November. But the main interest is now on the start of the meteorological Winter 2025/2026, which has now arrived within the range of extended range model forecasts, and shows interesting development.
LATE FALL SEASONAL WEATHER
As October is slowly ending, we can look at preliminary surface temperature data for the month so far. Below is the CDAS analysis, which shows that this month was colder than normal across the western United States and central Europe. There is also an area of normal temperatures over the far eastern United States.
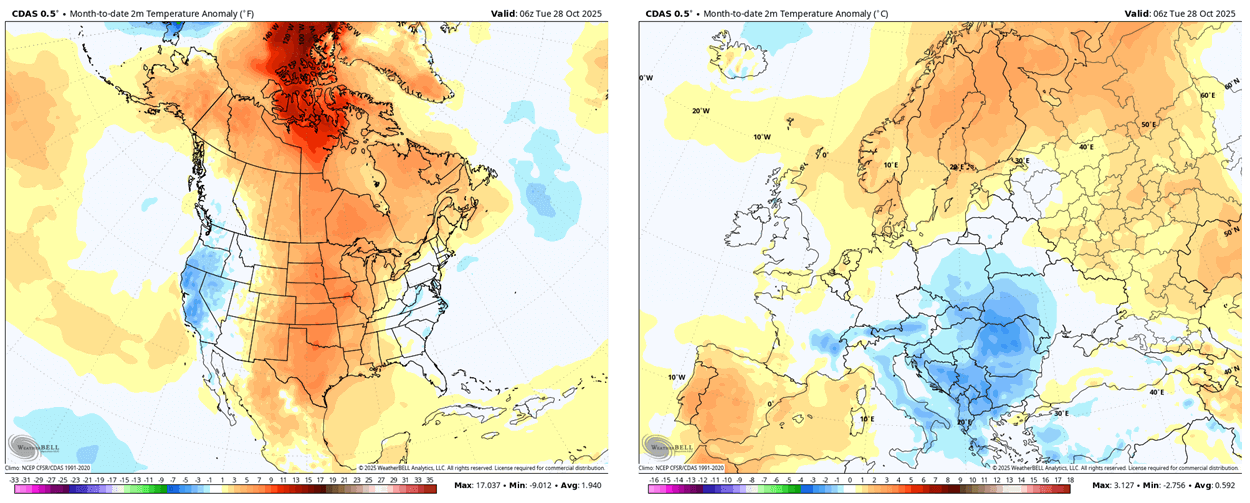
On the other hand, we can see that Canada and the central and north-central United States had warmer-than-normal temperatures. This was the result of a strong ridging pattern over the United States and Canada.
Looking at the last days of October, we will first look at the pressure pattern forecast below. You can see a broad high-pressure area over eastern Canada and a low-pressure anomaly over the eastern United States. A broad low-pressure area is in the North Pacific, bringing warmer air to the western U.S. and Canada.
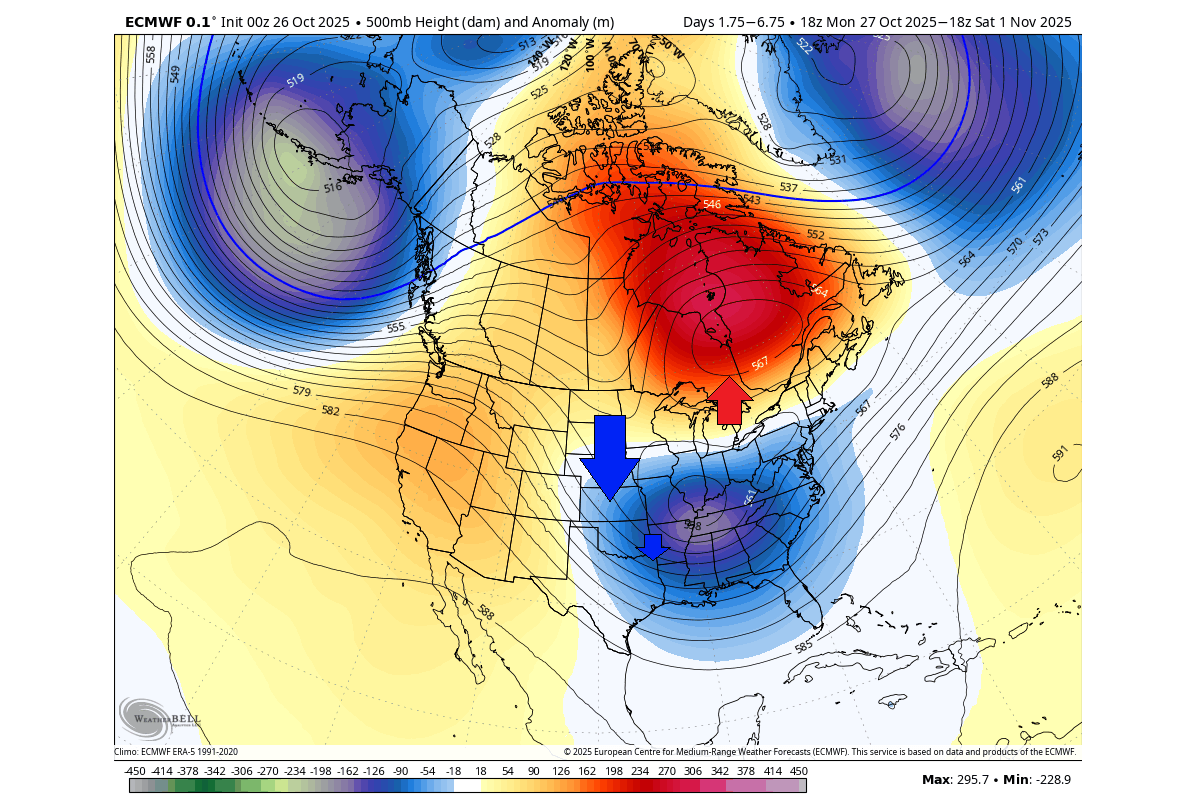
This setup creates a very specific airflow over North America: a southerly wind over the western United States and eastern Canada, and a northerly flow in the east-central U.S., with a cold air corridor over the central and eastern United States.
You can see this nicely in the temperature forecast below. A warmer-than-usual airmass is being transported across the southwestern United States and eastern Canada. But notice the cold anomaly over the central and eastern United States, spreading with the northerly flow just over Halloween.
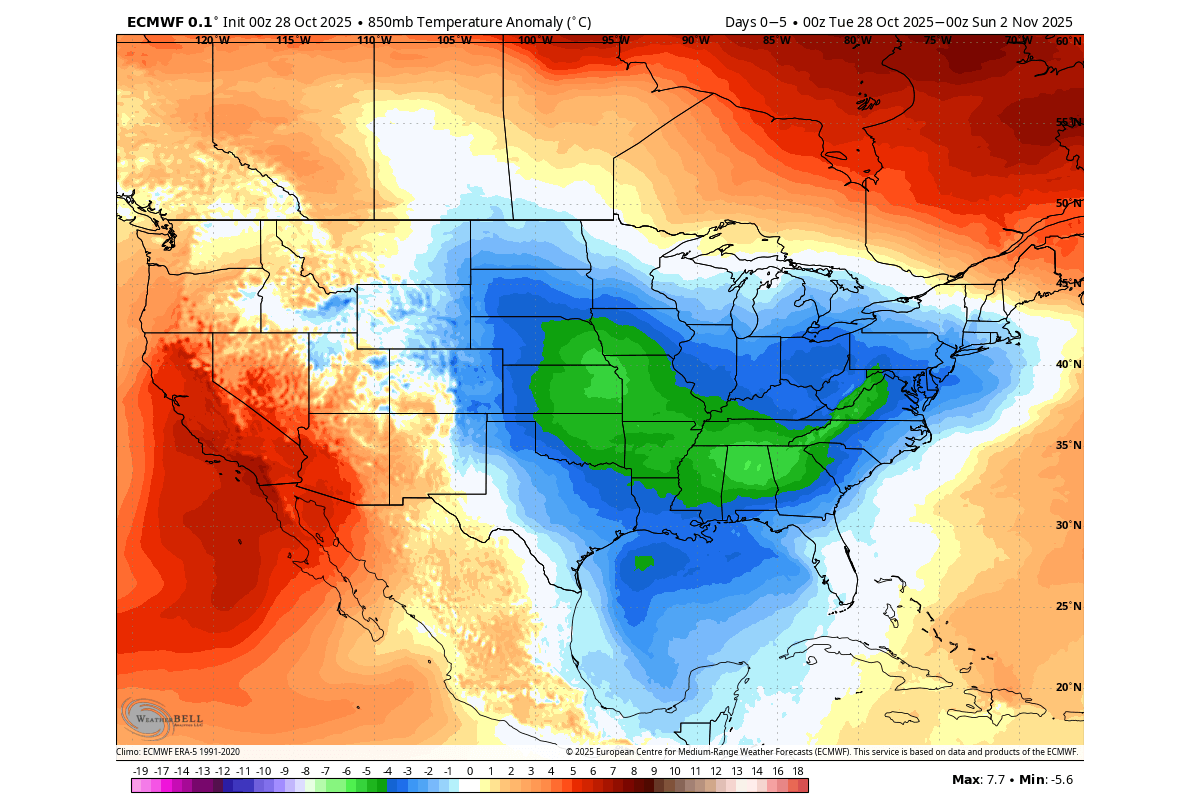
If this weather pattern were to occur in mid-winter or even in December, it would bring very cold air and snowfall to a large part of the United States.
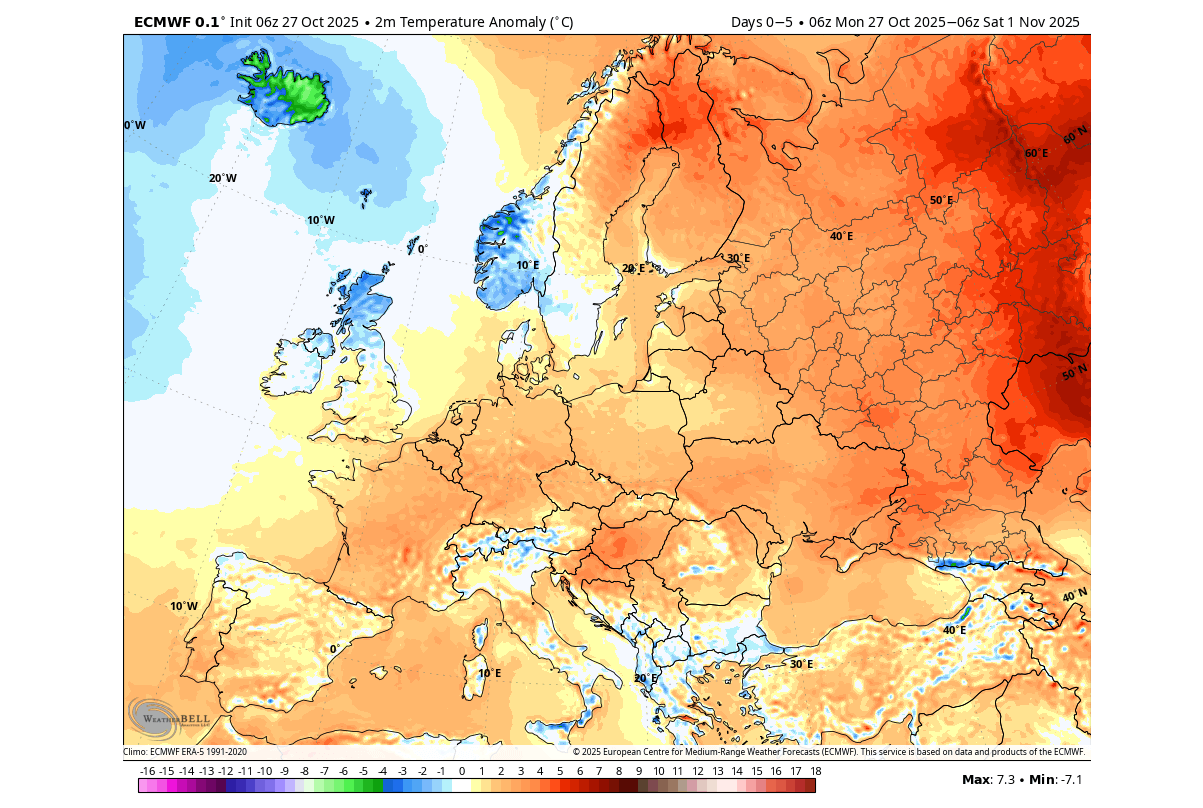
Over Europe, the forecast calls for a more stable and mild period in the last days of this month, with normal to above-normal temperatures across much of the continent. But a cooler maritime airmass will expand over the northwest.
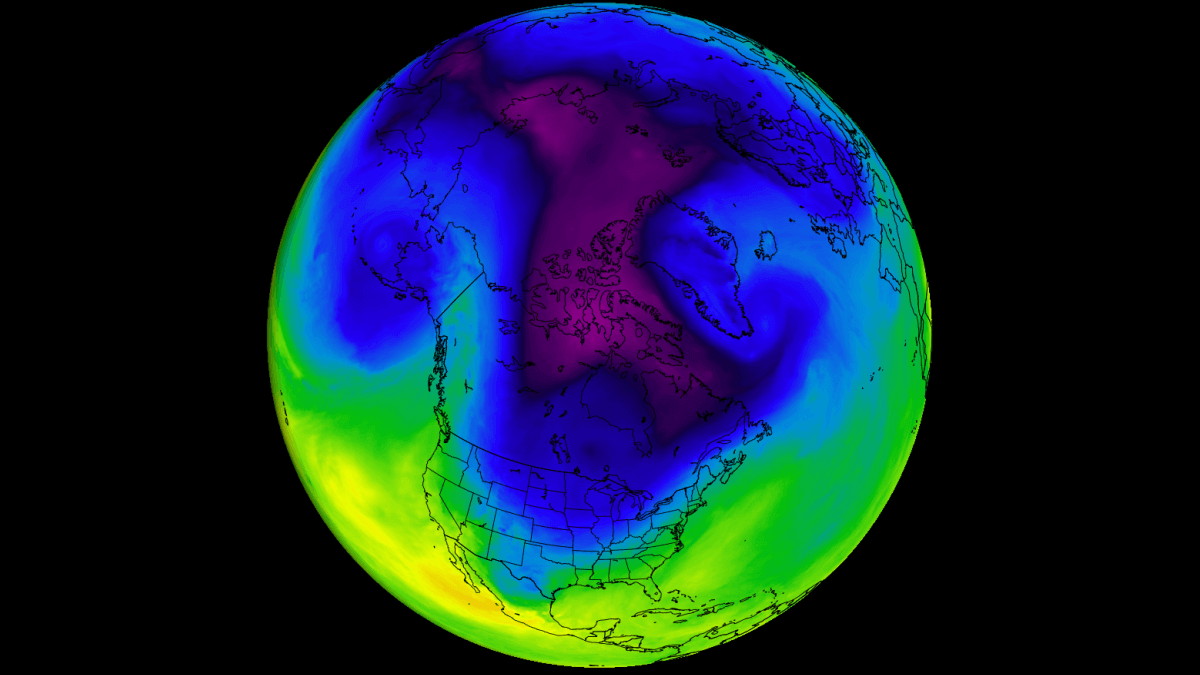
The daily (and seasonal) movement of the pressure systems is what causes these temperature patterns and weather changes. Pairs of pressure systems are known as Rossby Waves, which shape our daily weather. You can see an example of Rossby waves in the image below from NOAA, and how they are all connected and function with the jet stream.
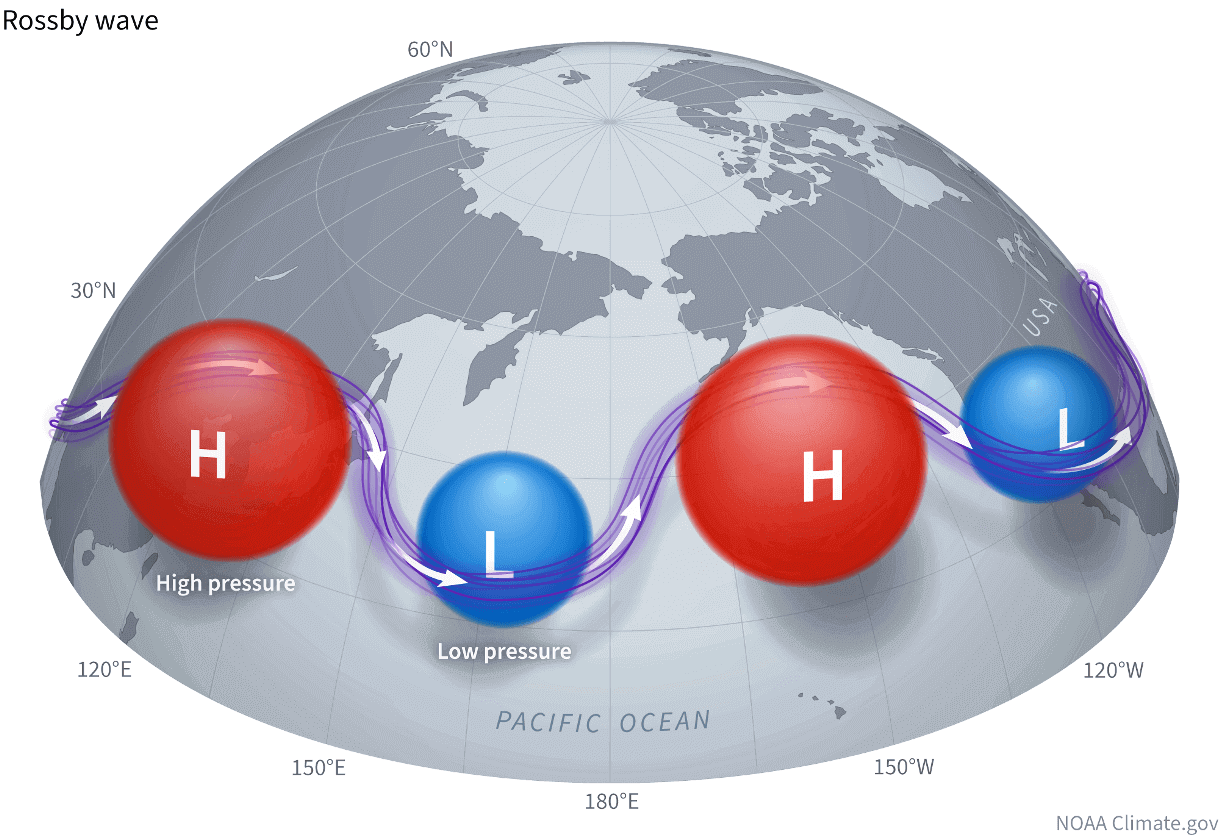
The purple line connecting these pressure systems is called the jet stream. This rapid stream of air lies at around 9 to 14 kilometers (6 to 9 miles) altitude, which helps drive the pressure systems.
We produced a high-resolution forecast video that shows the airmass movement over North America in the next 15 days. This way, you can see how the cold air is transported down from the north like it has its own “cold highway”, driven by the Rossby waves of highs and lows and the jet stream in between.
So while October ends on a cooler note, we can already see into November, which is the final month of meteorological Fall.
THE FINAL FALL MONTH
Looking at the first week of November, the 5-day pressure forecast shows two low-pressure areas, one over eastern Canada and one over the Pacific Northwest. There is a high-pressure ridge in-between, over the United States, with a cut-off low over the southerast, bringing along a colder-than-normal airmass.
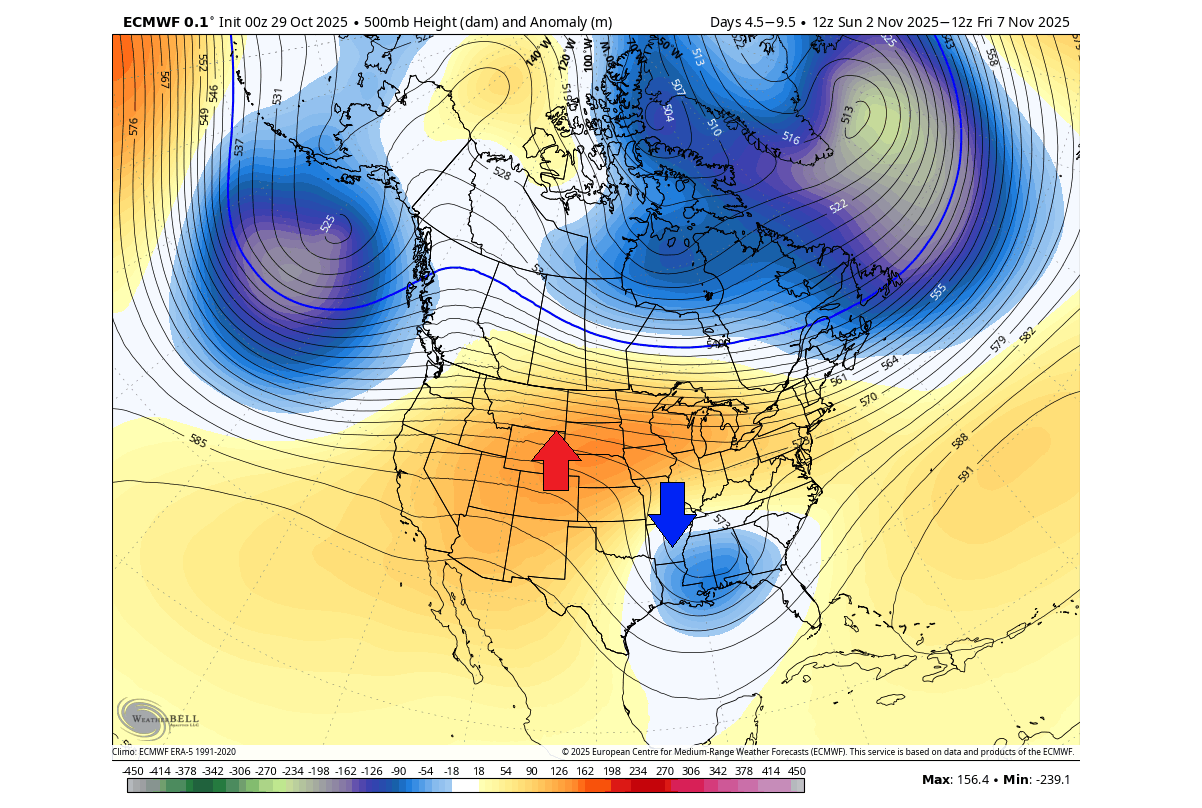
The low-pressure area in the northeast Pacific helps to build and sustain the ridge over the west-central United States, bringing up unseasonably warm air.
Below is the airmass temperature anomaly, averaged for the first week of November. You can see the supply of cooler air over the southern and eastern United States and southeastern Canada. At the same time, a much warmer air mass will rise over the western United States and western Canada.
We often see such a division in weather patterns, where colder and warmer air separate along the jet stream between the Rossby waves.
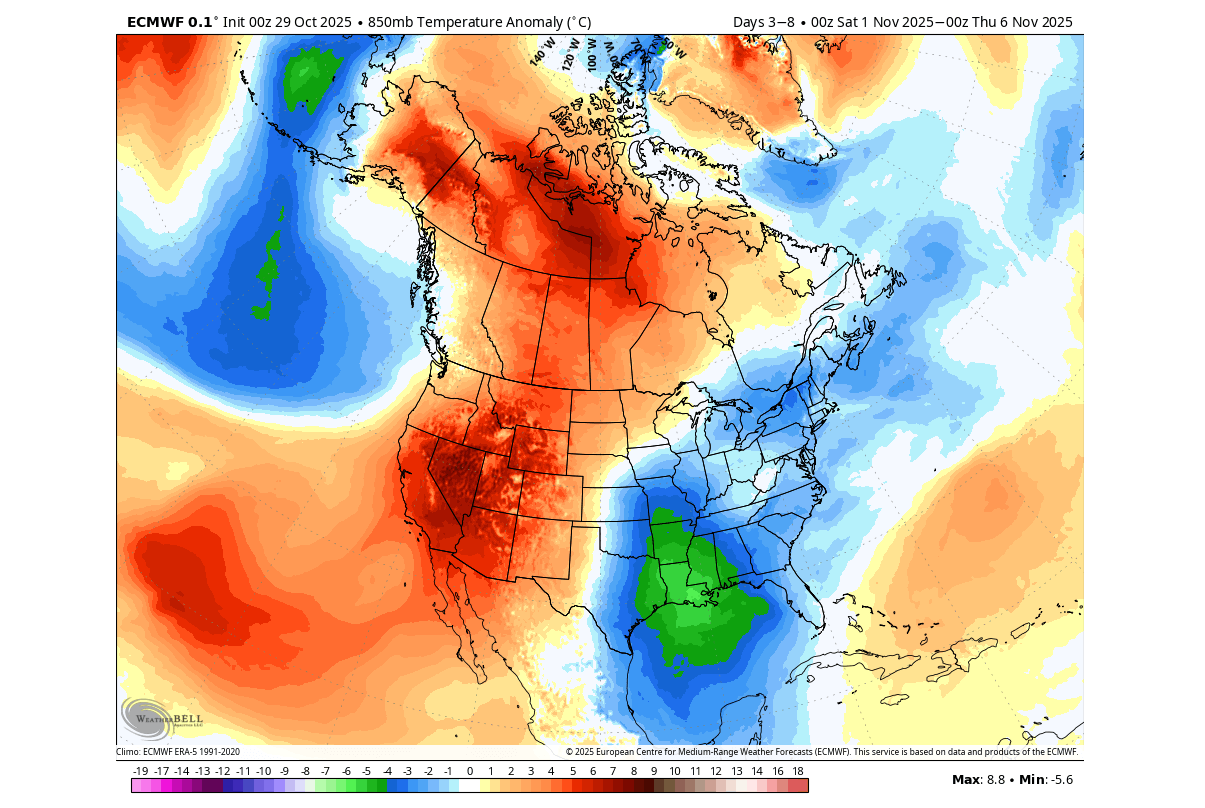
You can see this by looking at the temperature at the 850mb level (1500m/5000ft) below. This way, we can understand the overall airmass movement. The image below is for Sunday next week, and nicely shows how the actual separation of the airmass looks like. You can see the cooler airmass over Canada, reaching into the eastern and northeastern United States.
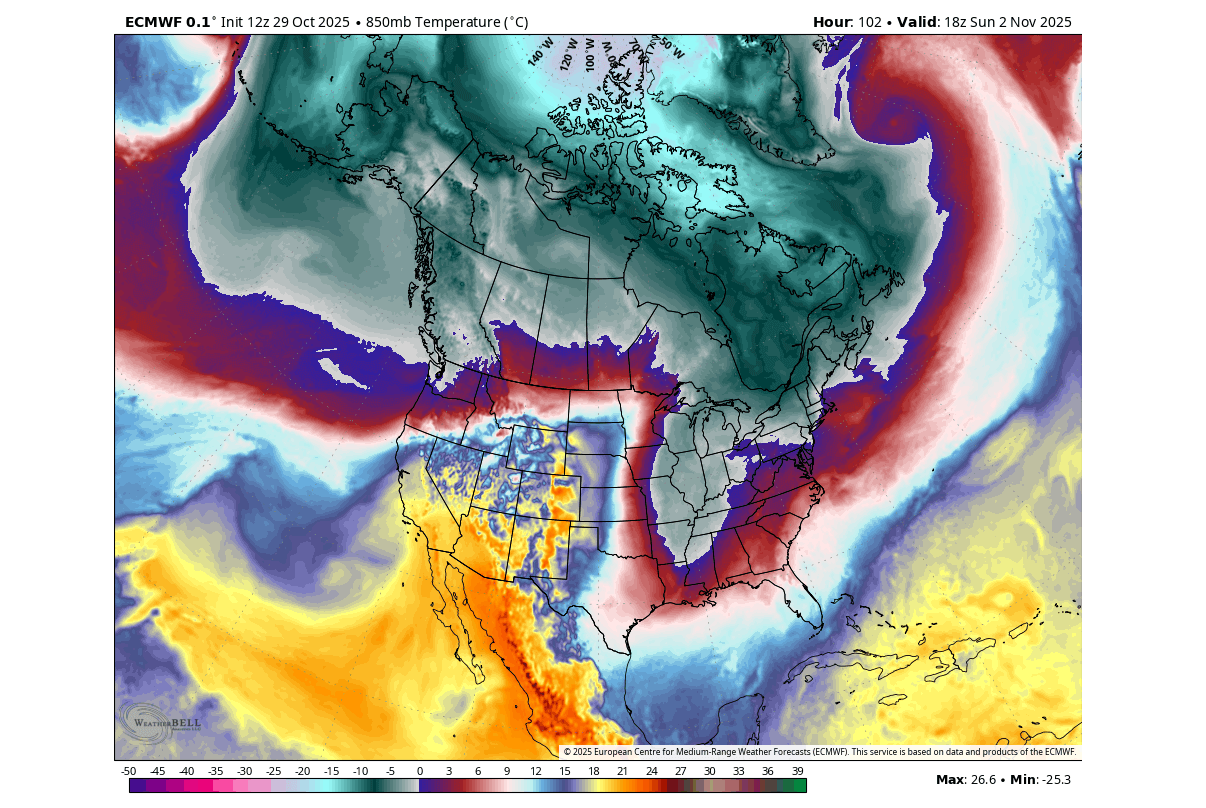
You can also see the connection of the cold airmass far back to the north into the polar circle. This northern flow from the Arctic is sometimes known as the “Polar Express”, and is often what brings the coldest days and most snow during Winter.
As mentioned above, the multi-day average does not show the full picture. So, below is a single-day forecast that shows the temperature anomalies for early week. You can see a cold air anomaly spanning from the central and southern Plains eastward and northeastward, up over the Midwest.
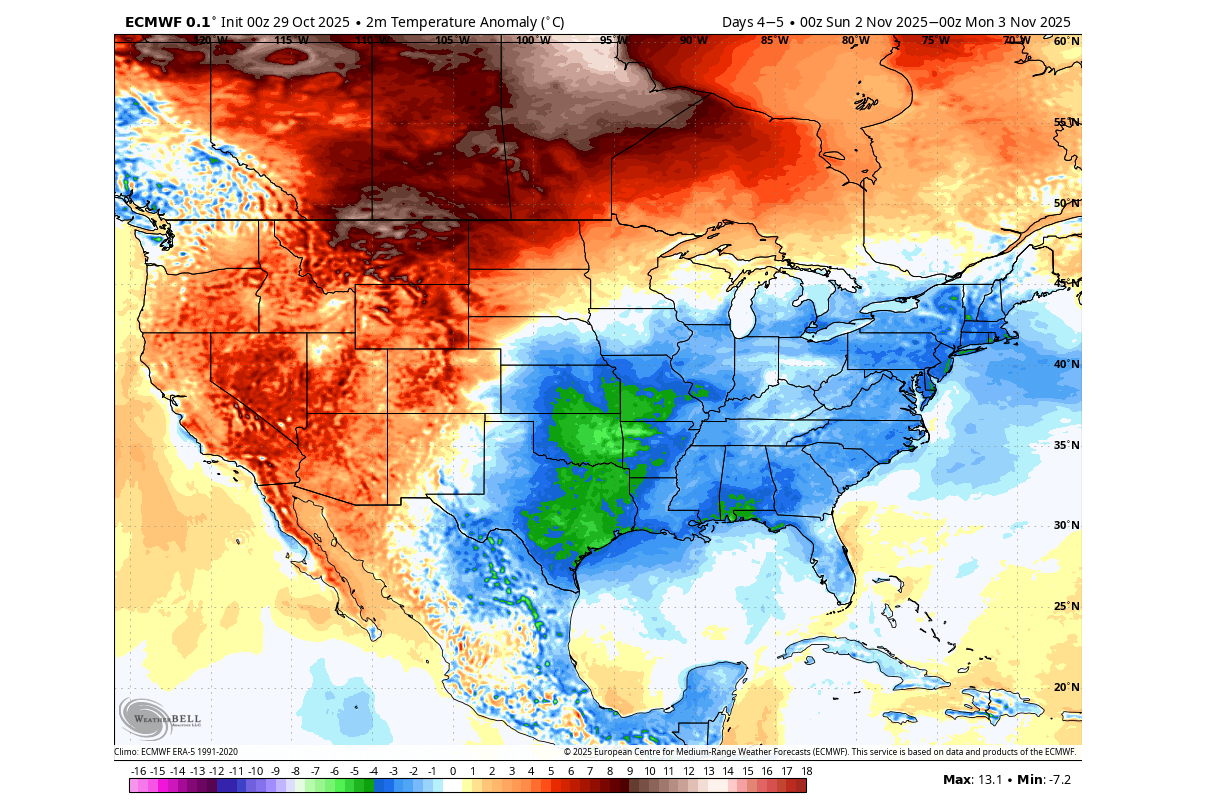
The cold air anomaly does look interesting, but we are still not that deep into Fall for it to bring deep-freezing temperatures. But near (or at) freezing surface temperatures can be expected in the upper Midwest, and over parts of the northeast.
We can also look at the 15-day total snowfall prediction below, even though we are not that deep into the cold air season yet. You can see snowfall is expected over the altitudes of the U.S. Rockies, and it is also starting to expand deeper into southern Canada. This signals that the colder airmass source is getting closer with seasonal cooling.
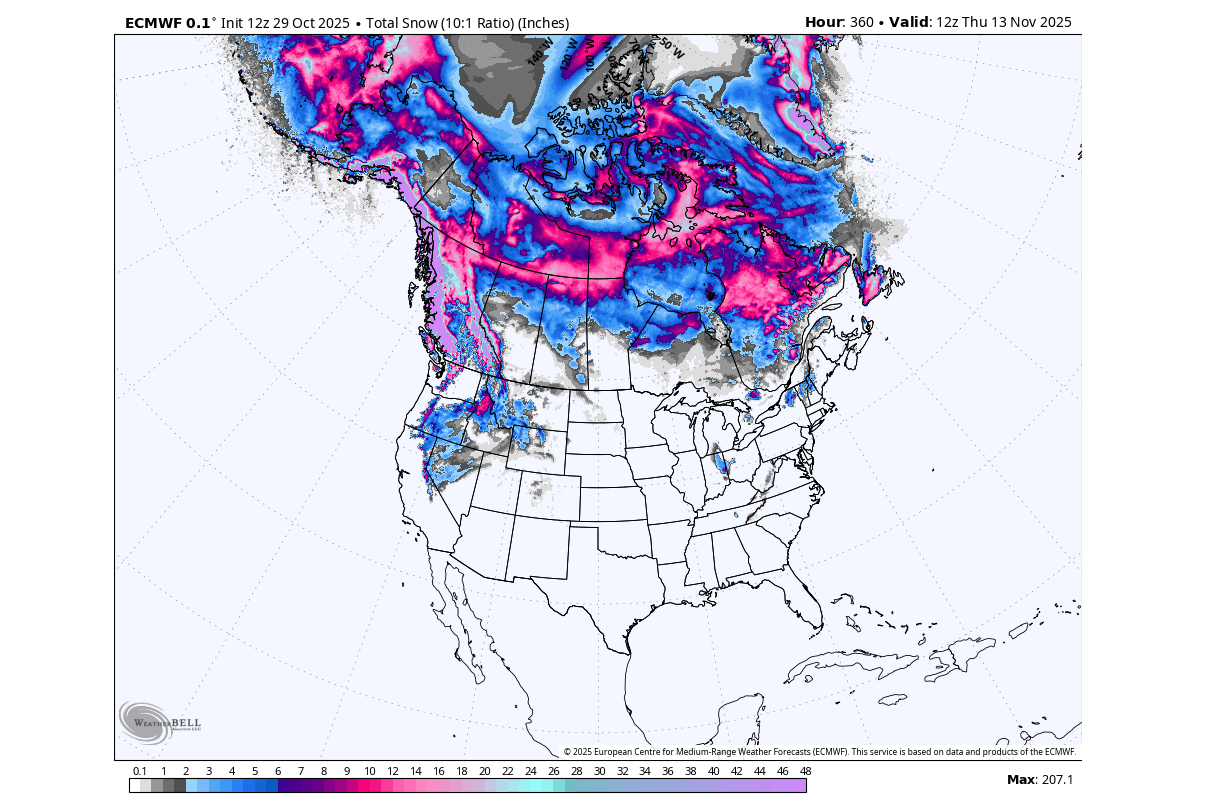
Of course, this is just a current model scenario, but we can look at these forecasts to evaluate the potential for cold and snow. There are some snowfall patches also predicted over the northeastern United States.
A low-pressure area over the North Atlantic helps to raise pressure over western and northern Europe. The forecast below shows the temperature pattern for the first week of November, with mostly above-normal temperatures over the continent. The exception is over central parts, where a small cut-off low will keep temperatures down.
To look deeper into November, we will use the extended ensemble forecasts, and spy on the weather patterns in the rest of the month, and also have a look at the start of Winter 2025/2026.
NOVEMBER EXTENDED FORECAST
Looking deeper into November, you can see the main low-pressure area is forecast over the upper Aleutians and far northern Pacific. This is a different pattern that what we will see at the start of the new month. This configuration enables a ridge to build over the east-central United States and eastern Canada.
You can also see a high-pressure anomaly building over Europe, with a Rossby wave low pair in the northern Atlantic.
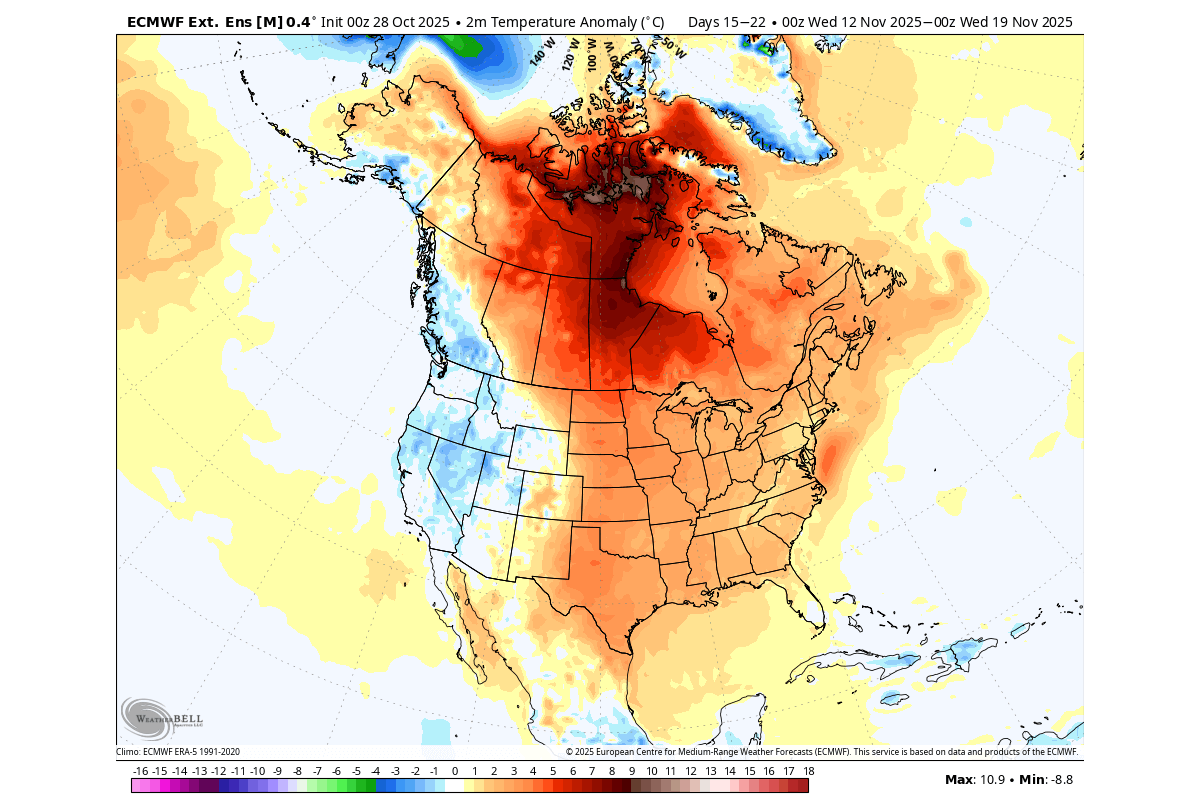
The temperature forecast trend for mid-month, below, shows a return of above-normal temperatures over much of Canada and over the central and eastern United States. A cooler area is forecast over the western United States, under the influence of a low-pressure area.
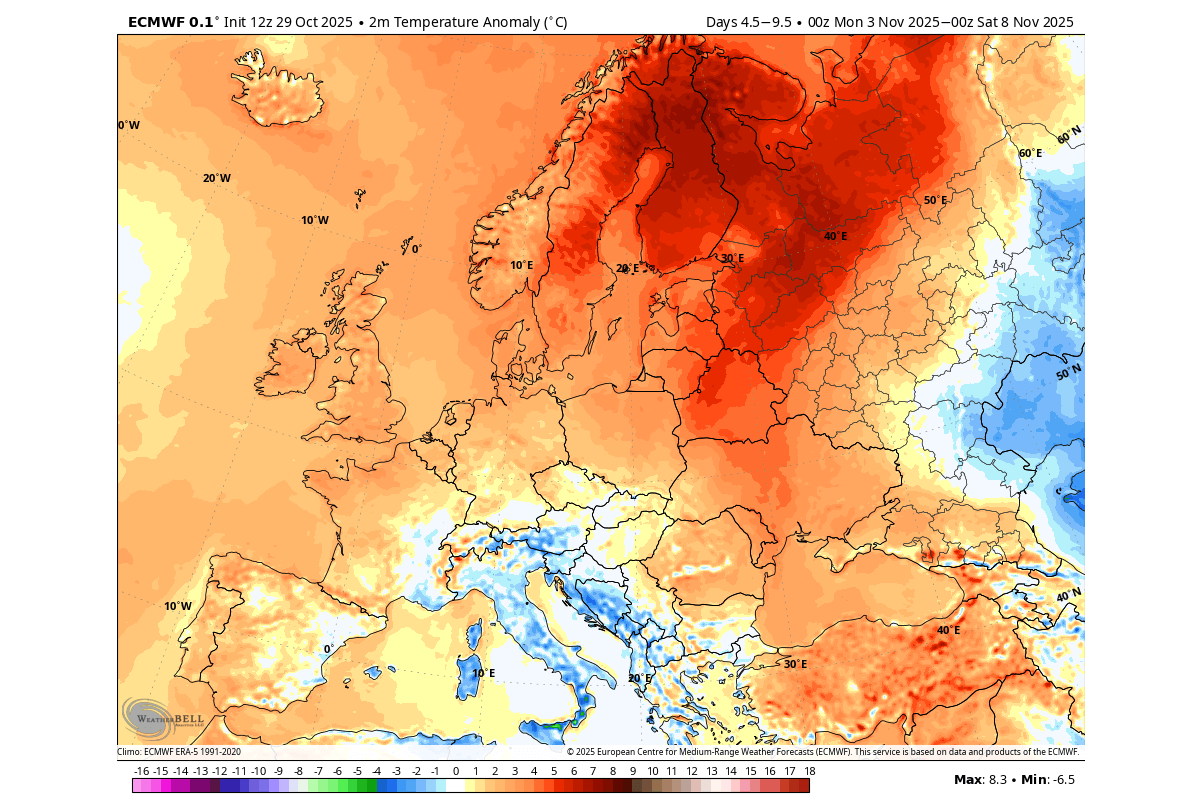
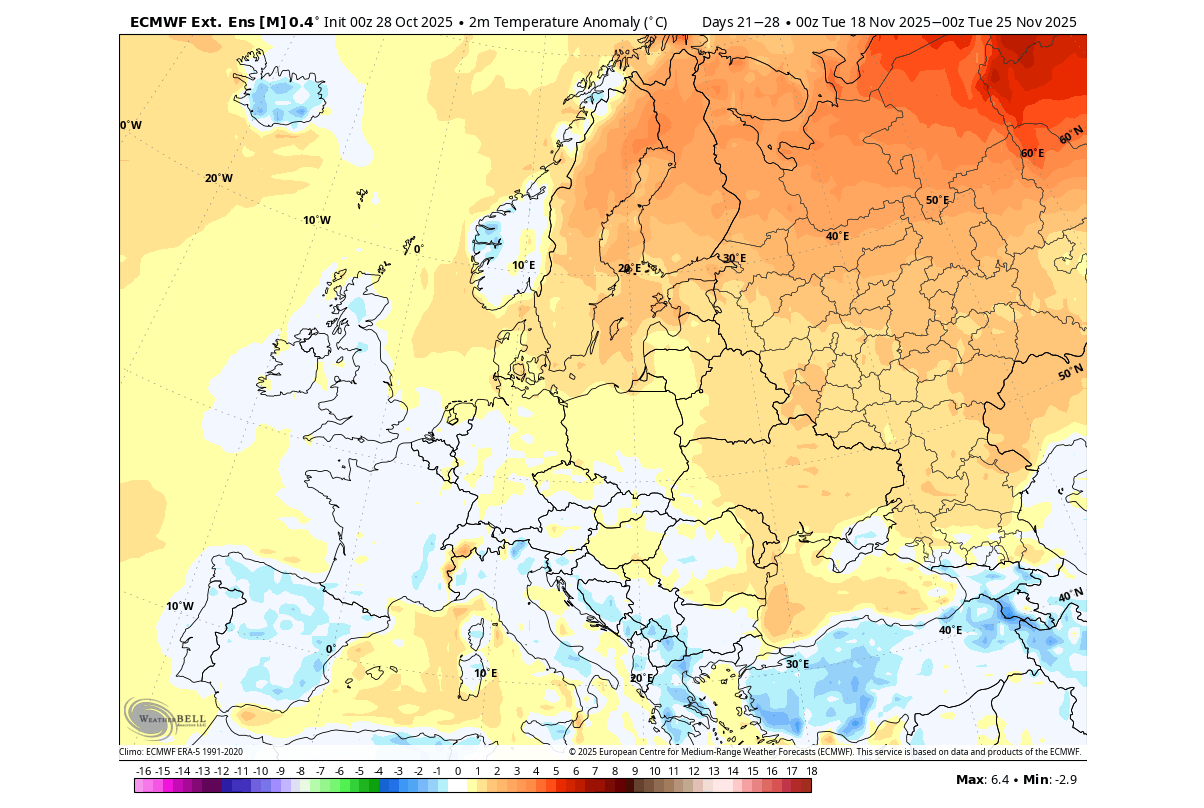
The mid-month forecast for Europe shows a warmer airmass to continue over the north and northeast. But surprisingly, we see a normal-to-cooler trend across the central, western, and northwestern parts.
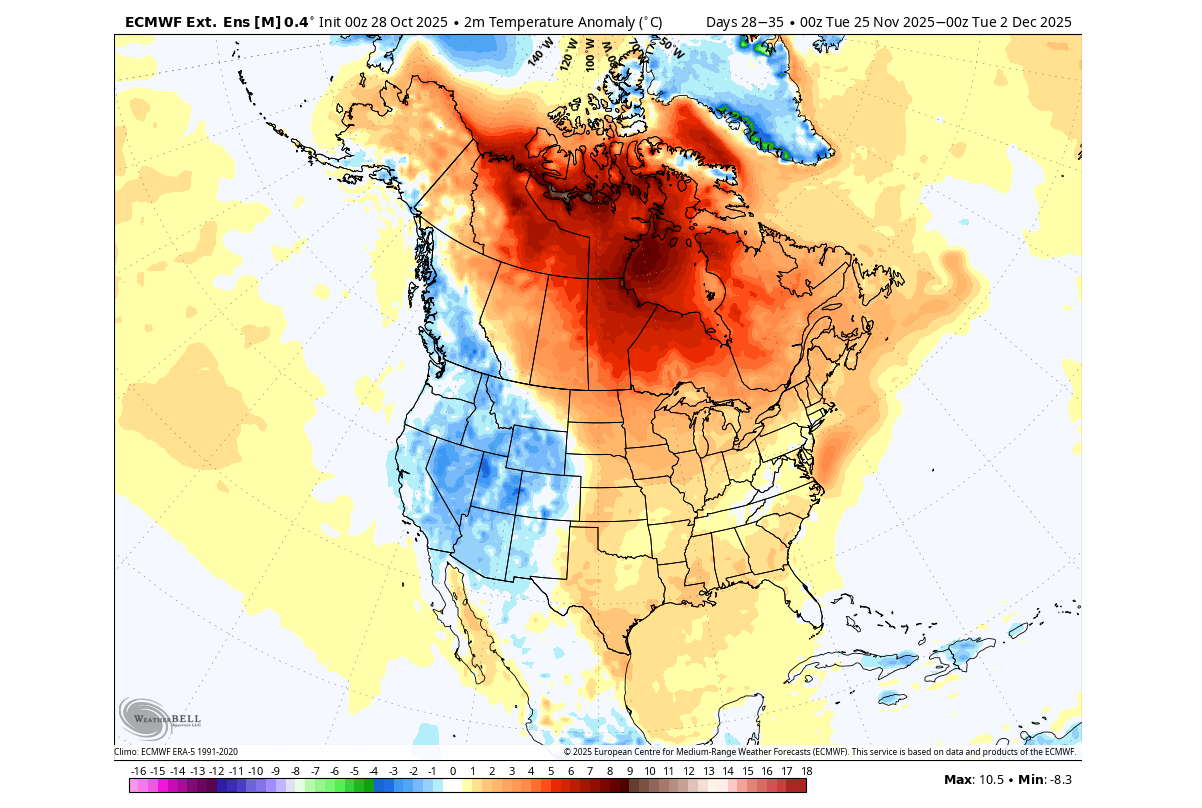
Going towards the end of the month, we can see weather changes starting over North America. The below-normal temperatures are expanding from the western towards the central United States, and the warm anomalies are starting to slowly break down. This indicates that a new trend could be emerging for the start of Winter 2025/2026.
This comes just in time as the meteorological Fall comes to an end. The meteorological Winter starts on December 1st, and it covers the 3 coldest months of the year in the Northern Hemisphere: December, January, and February.
THE START OF WINTER 2025/2026
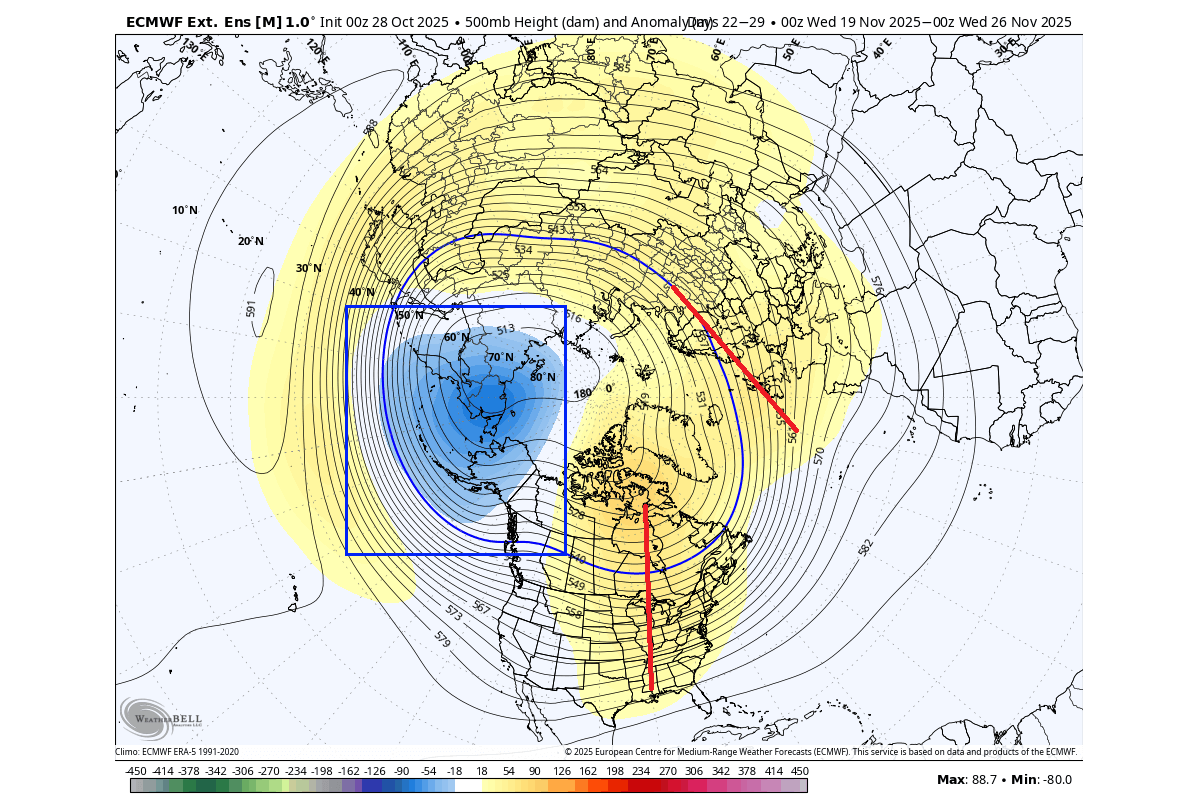
For the first week of meteorological Winter 2025/2026, the extended models currently show a pressure pattern reversal. With a high-pressure anomaly over Greenland and the Polar regions, the main low-pressure areas will move over the eastern United States, eastern Canada, and northern Europe.
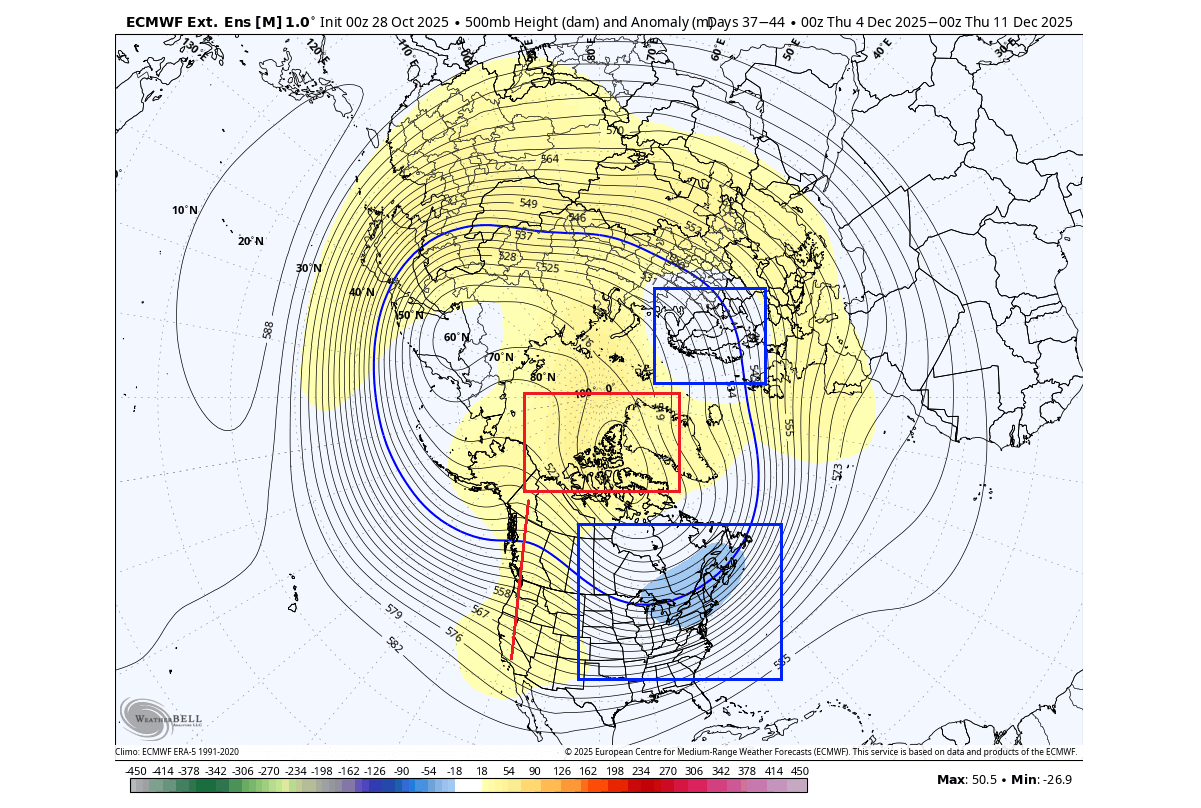
This means that a ridge is expected over the western United States, with higher pressure also likely over south-central Europe.
We can track the pattern changes in the airmass temperature below. You can see a colder air mass starting to expand over the northern United States, down from western Canada, and continuing into the eastern United States.

This is a first step towards a more proper winter pattern, as a cold “corridor” starts to establish. This is due to a low-pressure area in the east, which creates a more northerly flow, pumping colder air from Canada down into the United States.
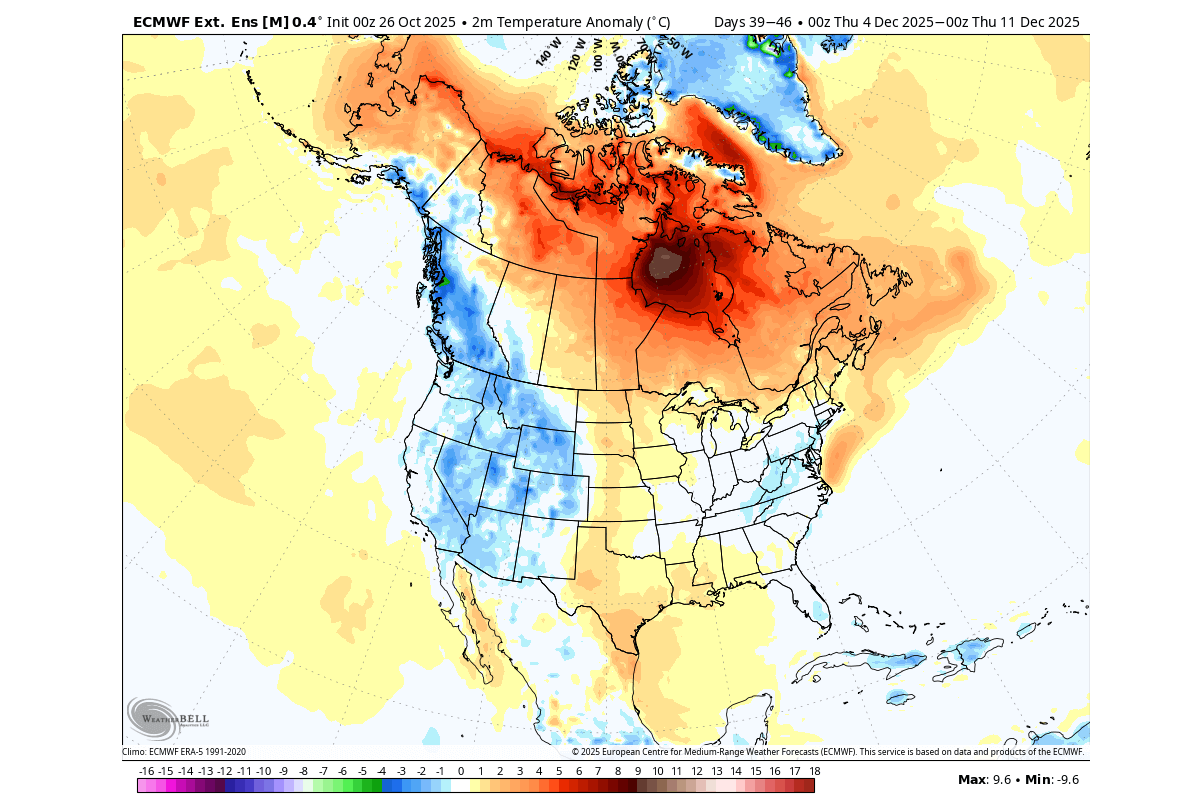
We can also look at the surface temperature anomaly, and you can see the eastern United States cooling down. In these ranges, the airmass temperature forecast is perhaps a better choice, but we can see the surface trends starting to reverse too.
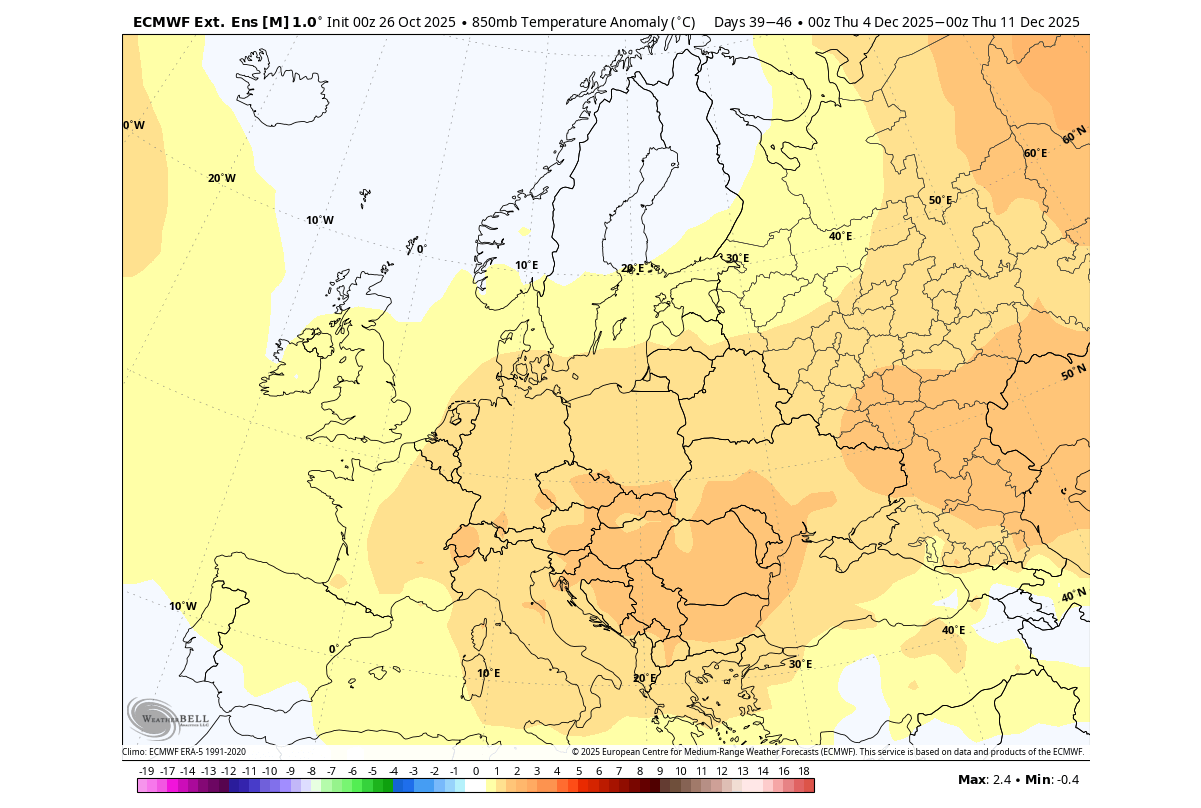
Looking at Europe for the Winter start, we can see the effect of a low-pressure system over the north. There you can see the area of normal or lower temperatures, with a warmer airmass over the rest of the continent, under the high-pressure anomaly.
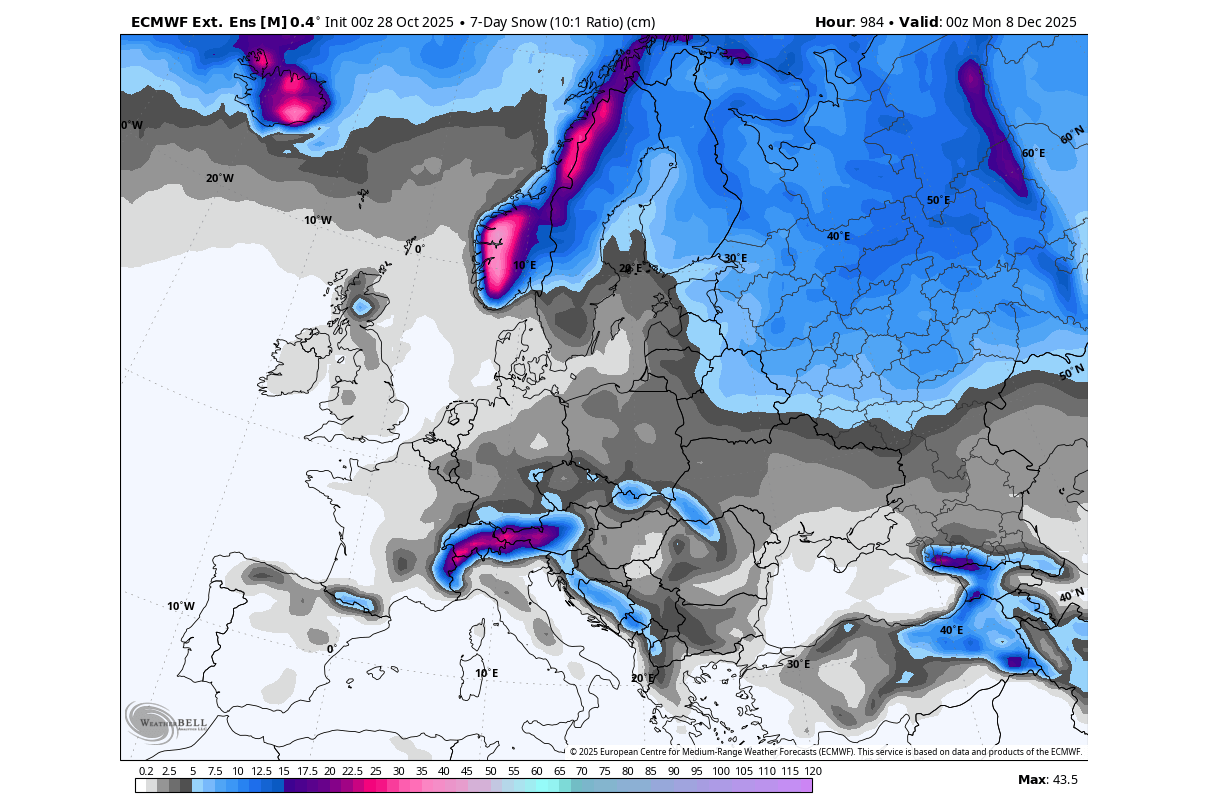
We also have the extended snowfall forecast available for the first week of meteorological Winter. Over North America, we can start to see the snowfall covering deeper into the United States, with accumulations over the northern U.S., the Midwest, the west, and the northeast.
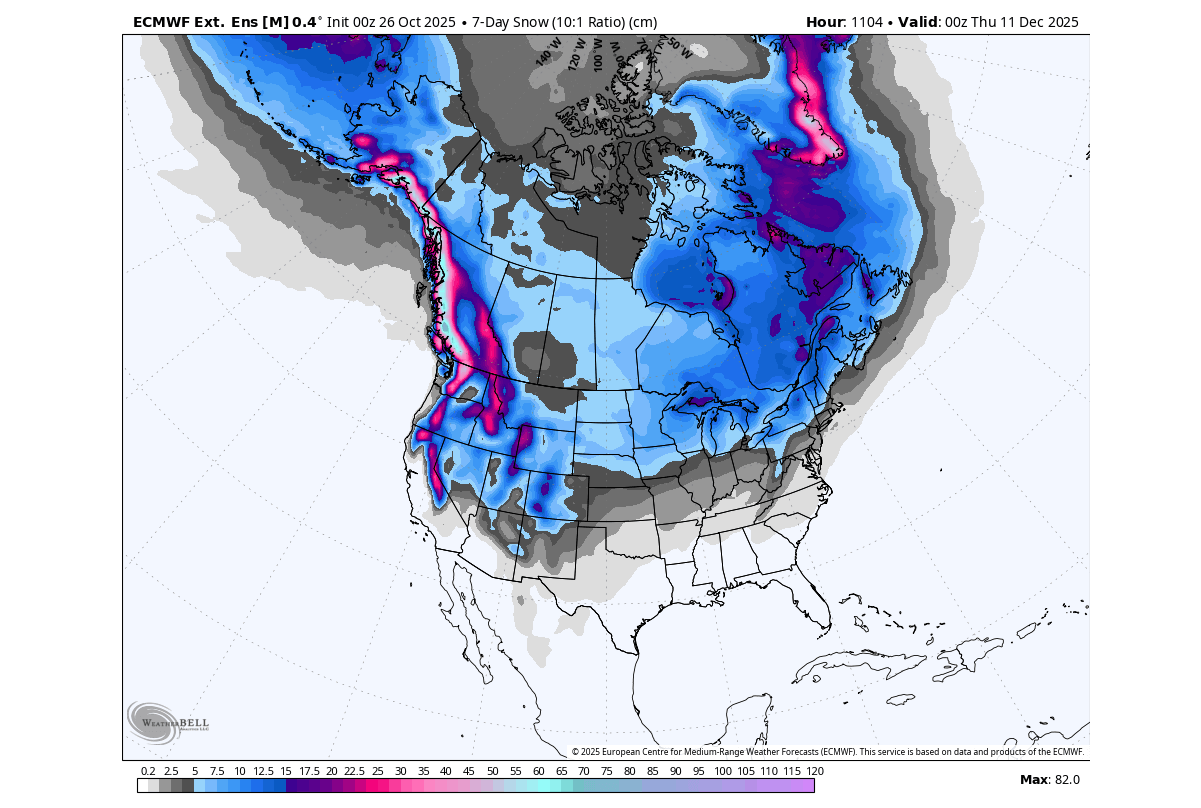
Over Europe, the main snowfall interest zones are mostly linked to the higher elevations in central parts, as expected under a warmer-than-normal airmass. The snowfall coverage is forecast to seasonally start increasing over the northern and northeastern parts.
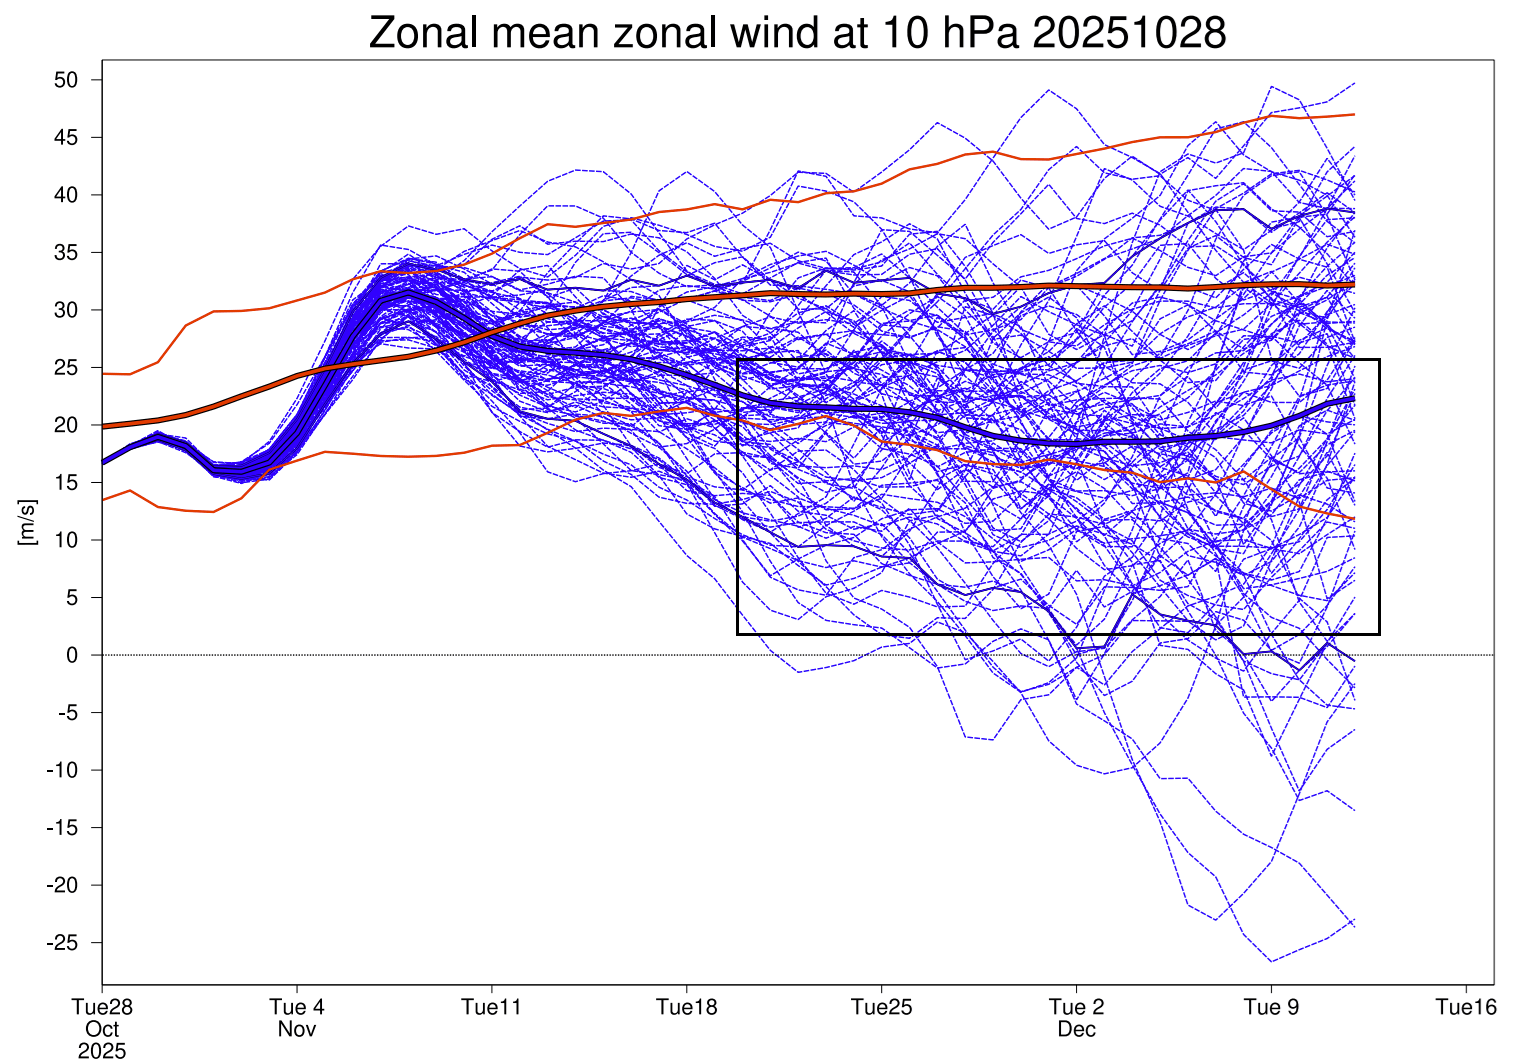
We will monitor the development closely, especially as the early December stratospheric forecasts now also show an unusual slowdown/weakening of the Polar Vortex. Overall, it looks like we are in for an interesting start to Winter 2025/2026.
The image below shows the forecast of stratospheric Polar Vortex winds, which we use to measure its strength. And as you can see, a deceleration of the stratospheric winds is telling us a Polar Vortex weakening is coming.
Forecast images in this article were provided by WeatherBell, using a professional/commercial user license.
We will keep you updated on the developing weather trends in the coming weeks, so make sure to bookmark our page. Also, if you have seen this article in the Google App (Discover) feed, click the like and follow button there to see more of our forecasts and our latest articles on weather and nature in general.