A cold La Niña event is unfolding in the Pacific Ocean. It has a known impact on the Winter weather patterns and is also expected to play a major role in the 2024/2025 season. We will look at the snowfall patterns during La Niña winters over the United States and Canada based on past La Niña events.
Simply put, the La Niña is another name for an area of cold ocean anomalies in the tropical Pacific. Knowing what causes these changes, it can tell us a lot about the state of the ocean and the atmosphere.
When the ocean anomalies start changing, it tells us how the atmospheric conditions are also expected to change. Based on that, we can look at past events and see how they impacted the Winter weather patterns and what that tells us for the 2024/2025 cold weather season.
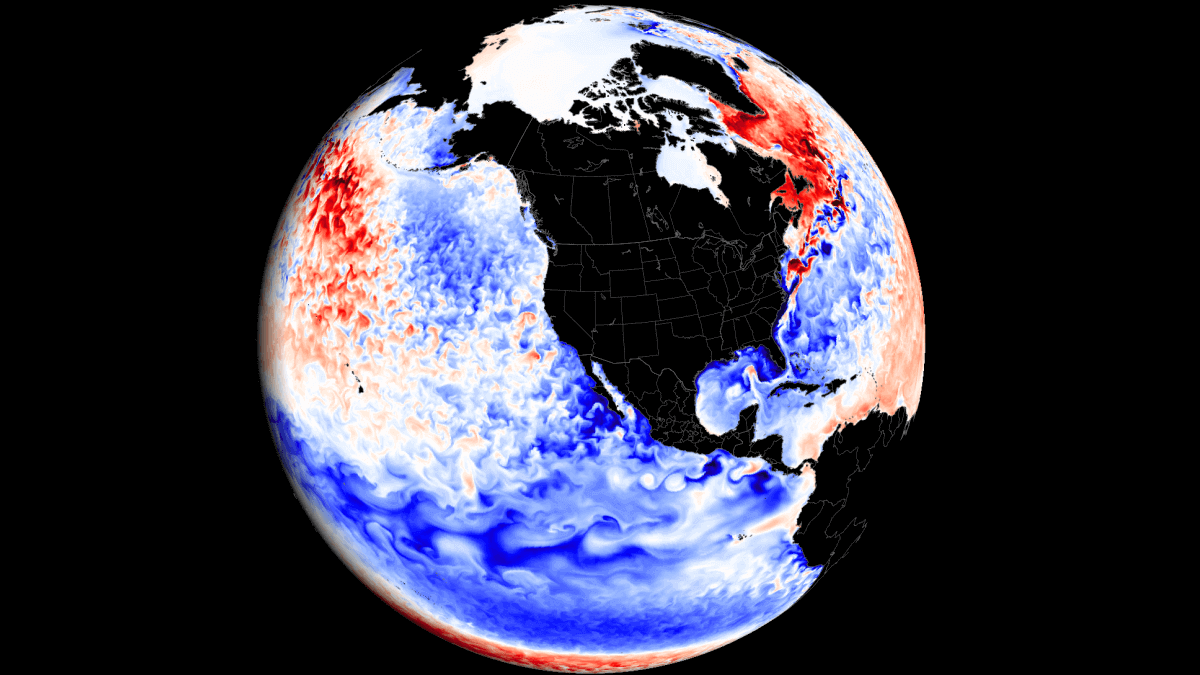
COLD OCEAN ANOMALY
The La Niña mentioned above is an ocean temperature anomaly in the ENSO regions. This region of the tropical Pacific Ocean changes between warm and cold phases. Typically there is a phase change around every 1-3 years. The warm phase is called El Niño, and the cold phase is called La Niña.
These ENSO phases significantly influence tropical rainfall, pressure patterns, and complex ocean and atmosphere connections. The image below shows the circulation pattern of a cold phase, which is forecast to influence the upcoming Winter season.

By impacting or changing this circulation, ENSO significantly changes tropical rainfall and pressure patterns. This changes the atmosphere-ocean feedback system, which spreads the ENSO influence globally, impacting the Winter temperature and snowfall patterns.
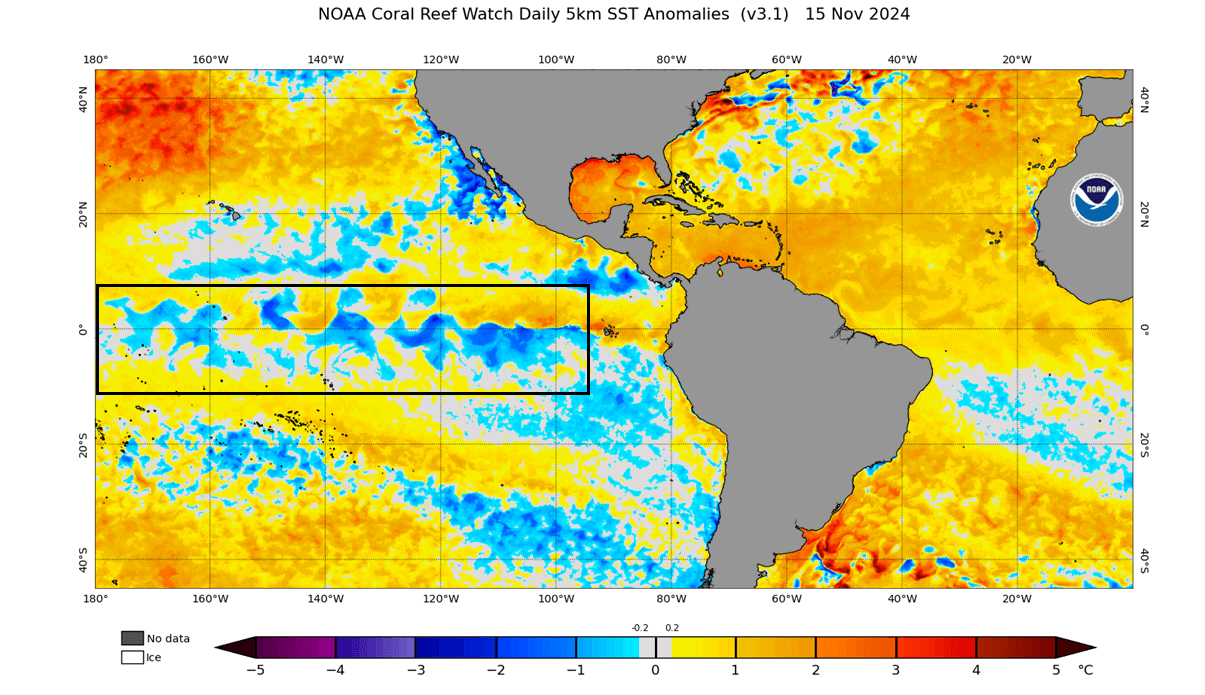
In the image below is the latest ocean analysis, with the marked main ENSO region. It shows colder-than-normal ocean surface in the central and eastern ENSO regions. These cold anomalies have a “wave-like” shape because of the strong easterly trade winds that push the waters towards the west, bringing deeper, colder water to the surface.
Below is an analysis/forecast image from NMME, where you can see the ENSO ocean temperature drop starting in spring when the previous warm phase was ending. Negative anomalies and cooling are forecast over the Winter of 2024/2025. The forecast average is within the La Niña threshold but shows a rather weak event.
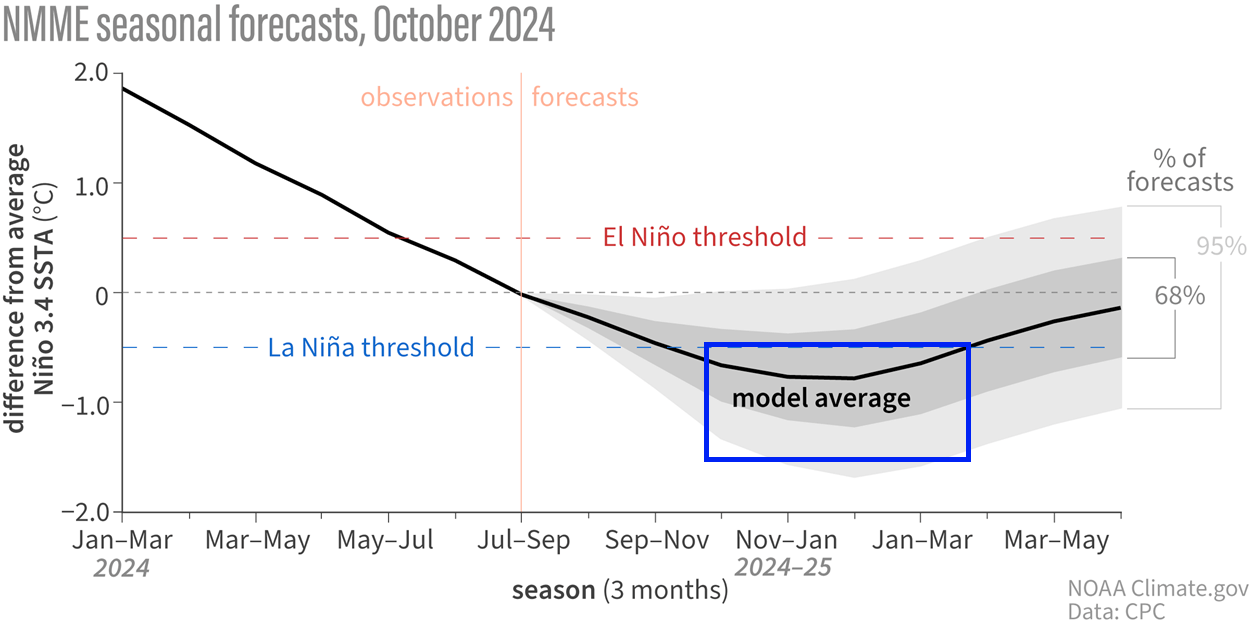
The image above shows that even in early spring, the ocean anomaly was still above normal but began cooling rapidly. We decided to produce a high-resolution video (below) from NASA data that shows this transition of ocean anomalies in the tropical Pacific.
Changes in the oceans are well known to impact winter weather patterns and also the snowfall potential. We will take a closer look at the weather influence that La Niña usually shows over North America, where it has a more direct impact.
LA NINA WEATHER OVER NORTH AMERICA
The main influence of these ocean anomalies can be seen in the changing jet stream patterns. A jet stream is a large and powerful stream of air (wind) at around 8-11km (5-7 mi) altitude, flowing like an atmospheric river.
Typically, a strong blocking high-pressure system in the North Pacific is the most common effect of a cold ENSO phase (La Niña). That usually redirects the polar jet stream down over the northern United States.
Below is an image that shows you the average winter pressure pattern from recent La Niña winters. The main feature is a strong high-pressure system in the North Pacific and a low-pressure area over Canada.
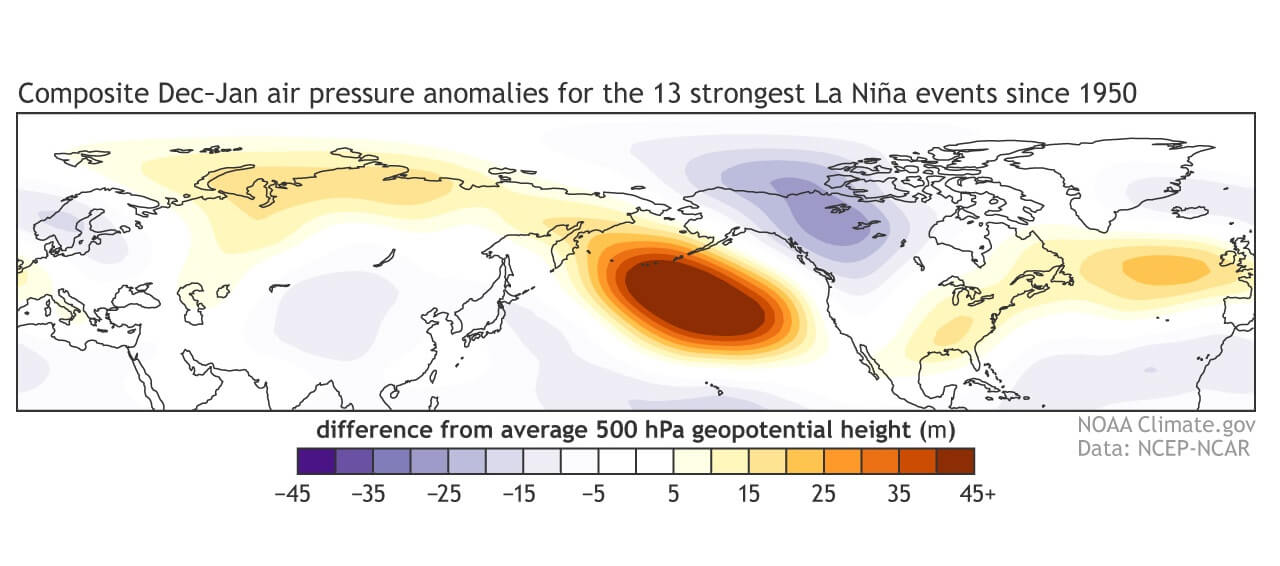
The circulation of the strong high-pressure system promotes the development of a low-pressure region over Alaska and western Canada. That pushes the jet stream downwards between the two strong pressure systems into the Northern United States.
The image below shows jet stream redirection from La Niña and the resulting weather patterns developing over the United States and Canada.
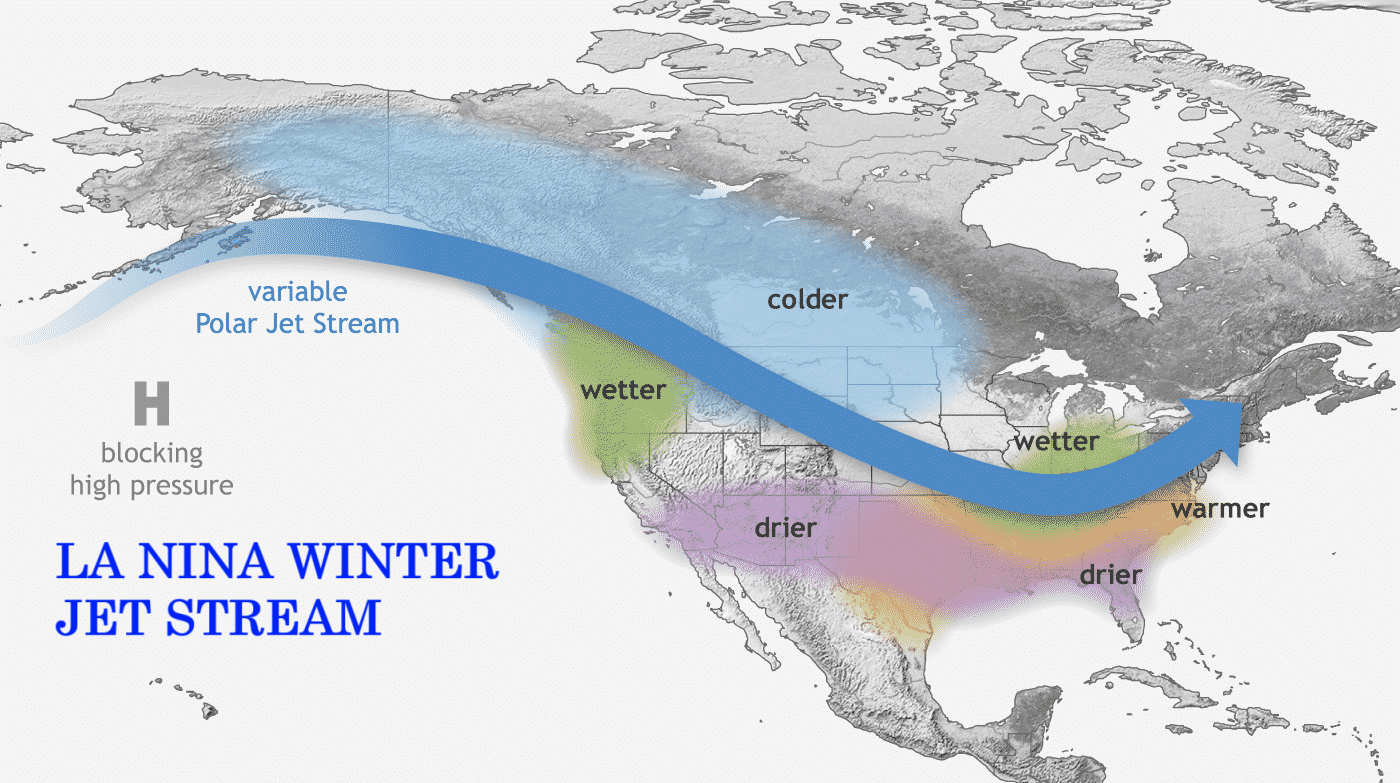
The displaced jet stream brings colder temperatures and winter storms from the polar regions down into the northern and northwestern United States. Warmer and drier winter weather prevails over the southern states.
Looking at the temperature analysis for some of the more recent La Niña winters, you can see the cold anomaly area under the jet stream in western Canada and the northwestern United States. Negative anomalies extend over the Midwest and down into the south-central plains.
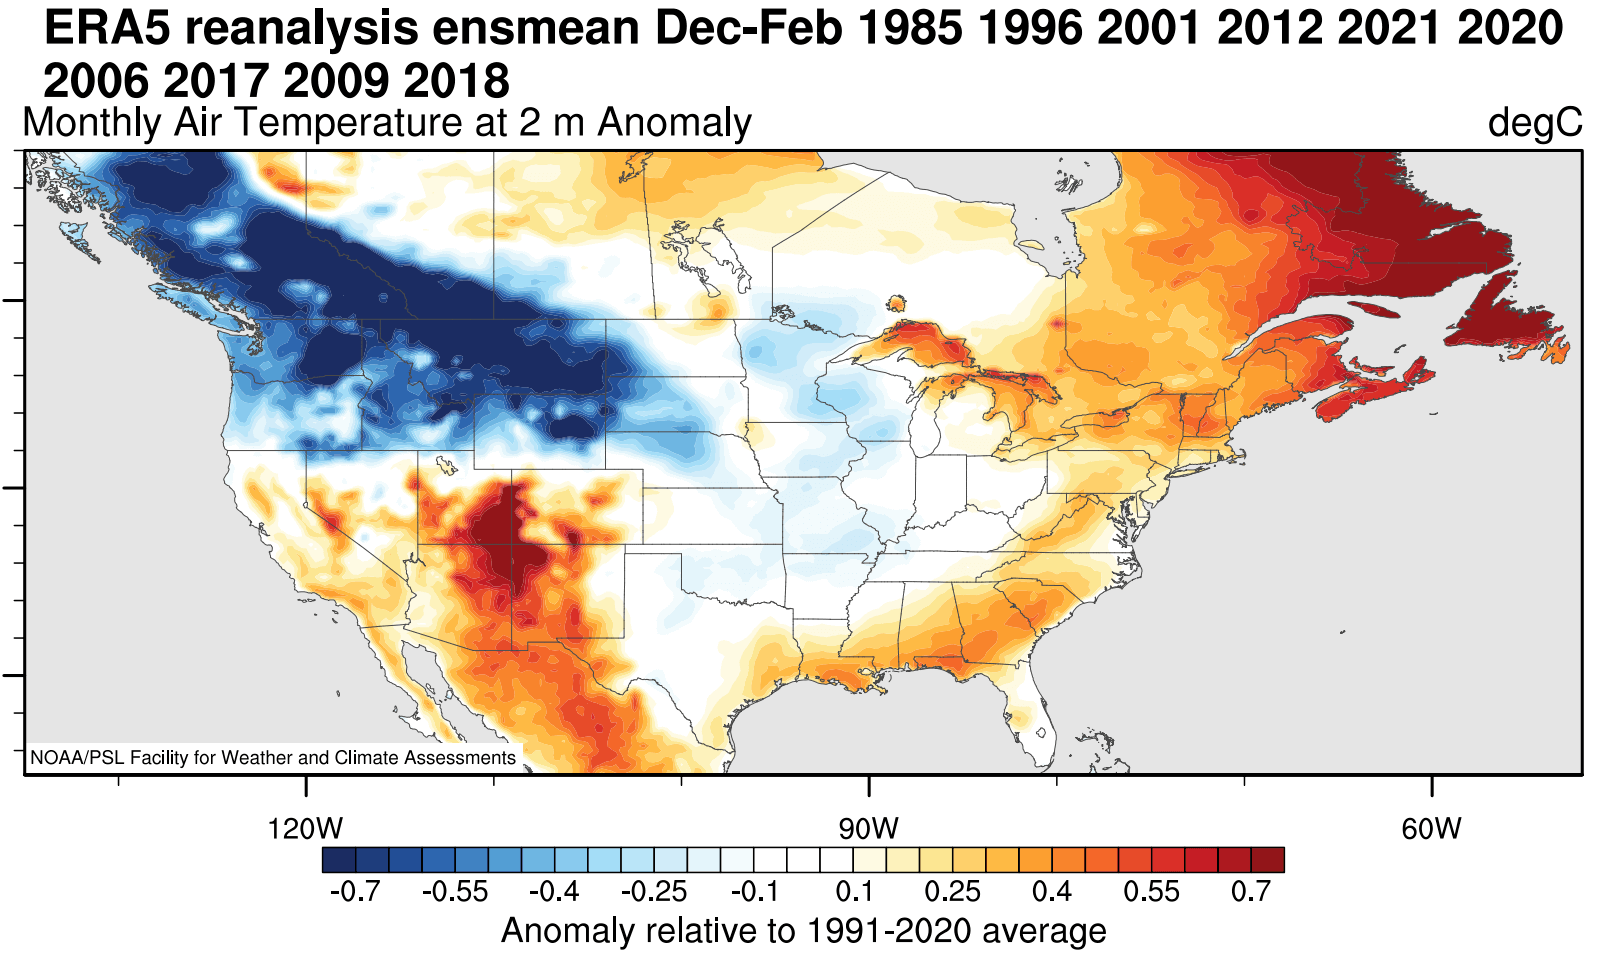
Warmer-than-normal weather and mild winter conditions develop in the southwestern and eastern United States and eastern Canada. The main winter weather dynamics usually develop between these warm and cold anomalies in the Midwest and the central United States.
With the change in the jet stream, the La Niña significantly affects the snowfall potential over North America as the pressure systems take a different path.
The colder air is more easily accessible to the northern United States, which increases the snowfall potential if moisture is available. In the graphics below by NOAA-Climate, you will see the average snowfall patterns for La Niña winters.
UNITED STATES AND CANADA SNOWFALL PATTERNS
We will look at the snowfall patterns based on the state-of-the-art ERA-5 data. This data combines the snowfall for the winters of last 22 La Niña events.
As the colder air is more easily accessible to the northern United States and southern Canada in a La Niña winter, that increases the snowfall potential if moisture is available. In the first image below, you can see the average snowfall pattern for all La Niña years.
You can see above-average snowfall across much of the northern United States and southern Canada. Peak snowfall is usually across the higher elevations of the Pacific Northwest. But in other areas, states like Minnesota, Wisconsin, Michigan, New York, Vermont and northern Pennsylvania stand out with more snowfall in such winters.
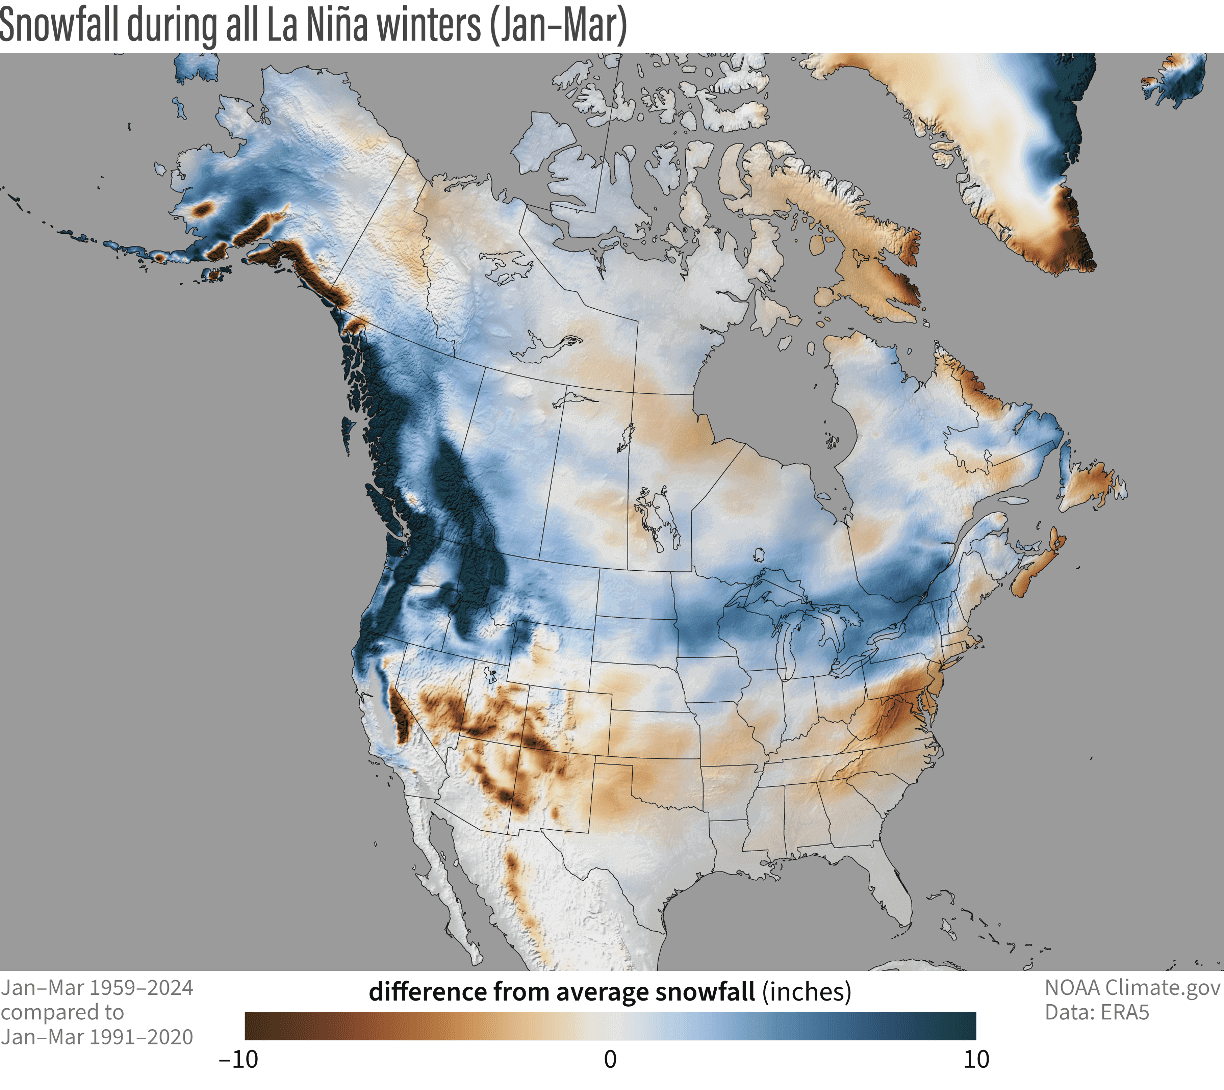
The southern United States usually experiences less snowfall in such winters because the jet stream is more confined to the northern United States and southern Canada.
But, there is a limitation when looking at actual snow values and averages. The biggest issue is that a few big snow events or months can make the average look snowier than what is actually normal.
The image below shows how many of the 22 last La Niña winters had below-average snowfall from January–March. Red colors mean those places had below-average snowfall more than half the time. Gray colors mean those areas had more snowfall on average.
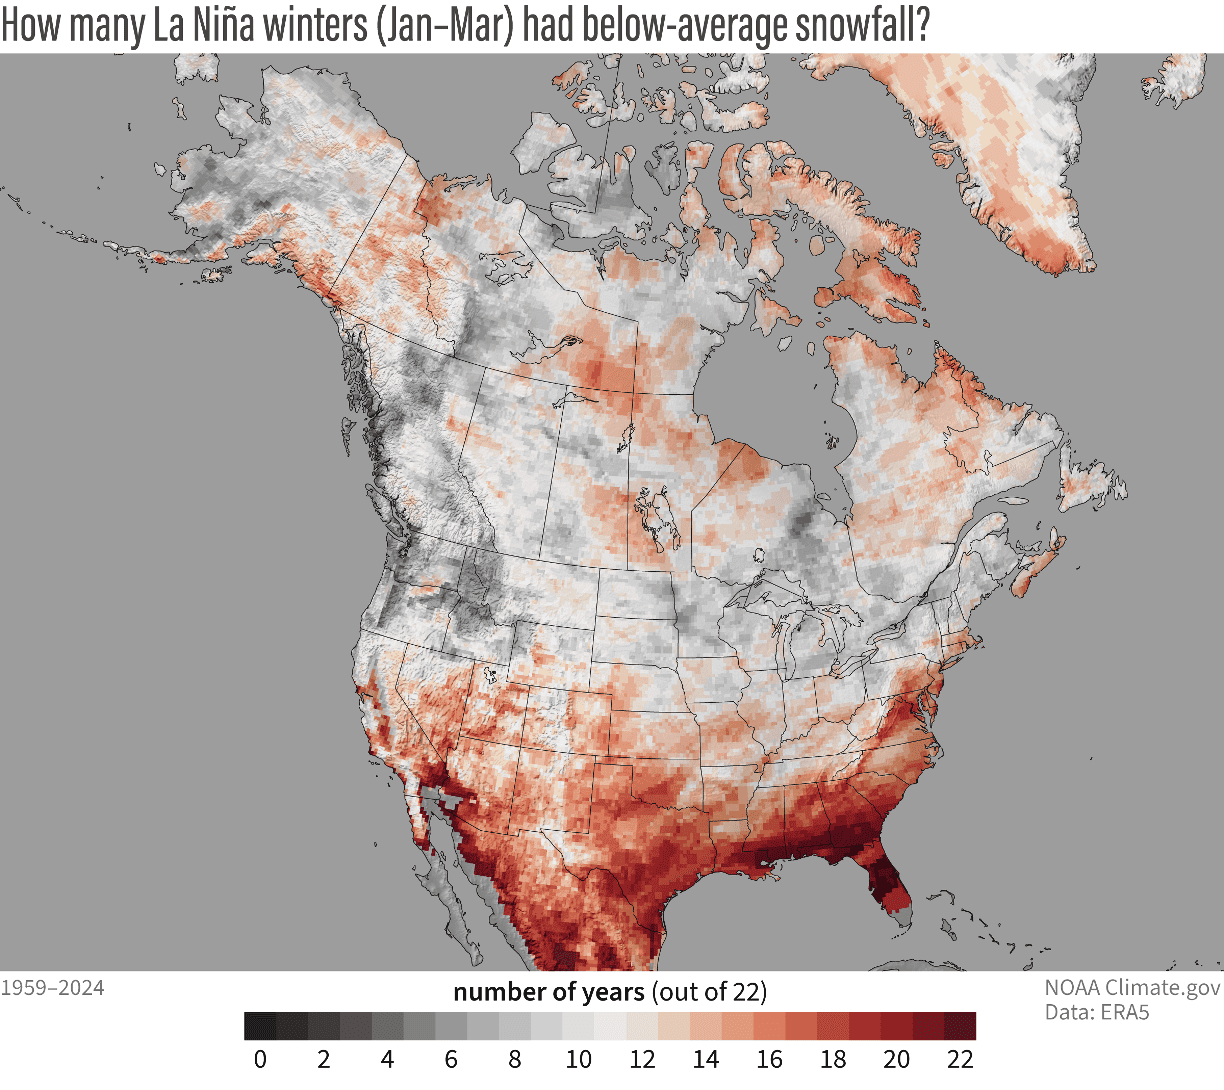
Overall, the signal for above-average snowfall is strong across the Pacific Northwest and Idaho, the northern Midwest, and southeastern Canada.
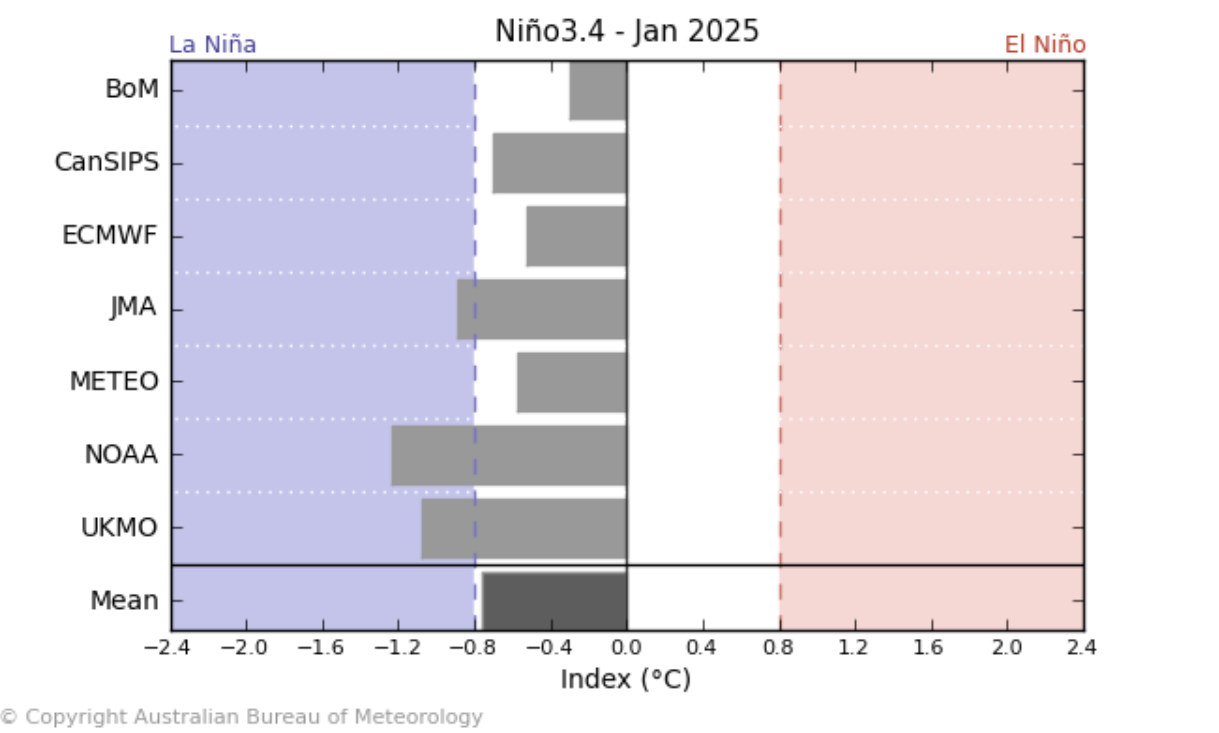
Below is the ENSO forecast graph from multiple forecasts for January 2025, and it shows a rather weak La Niña event for 2024/2025. Why is that important? Because not every La Niña is the same, and changes in its strength can significantly impact the weather outcome across the United States and Canada.
Because a weak La Niña event is forecast for this season, we will also look at the snowfall patterns for a weak event. As you can see below, there is not much difference in the overall snowfall amount between the northern and the southern United States.
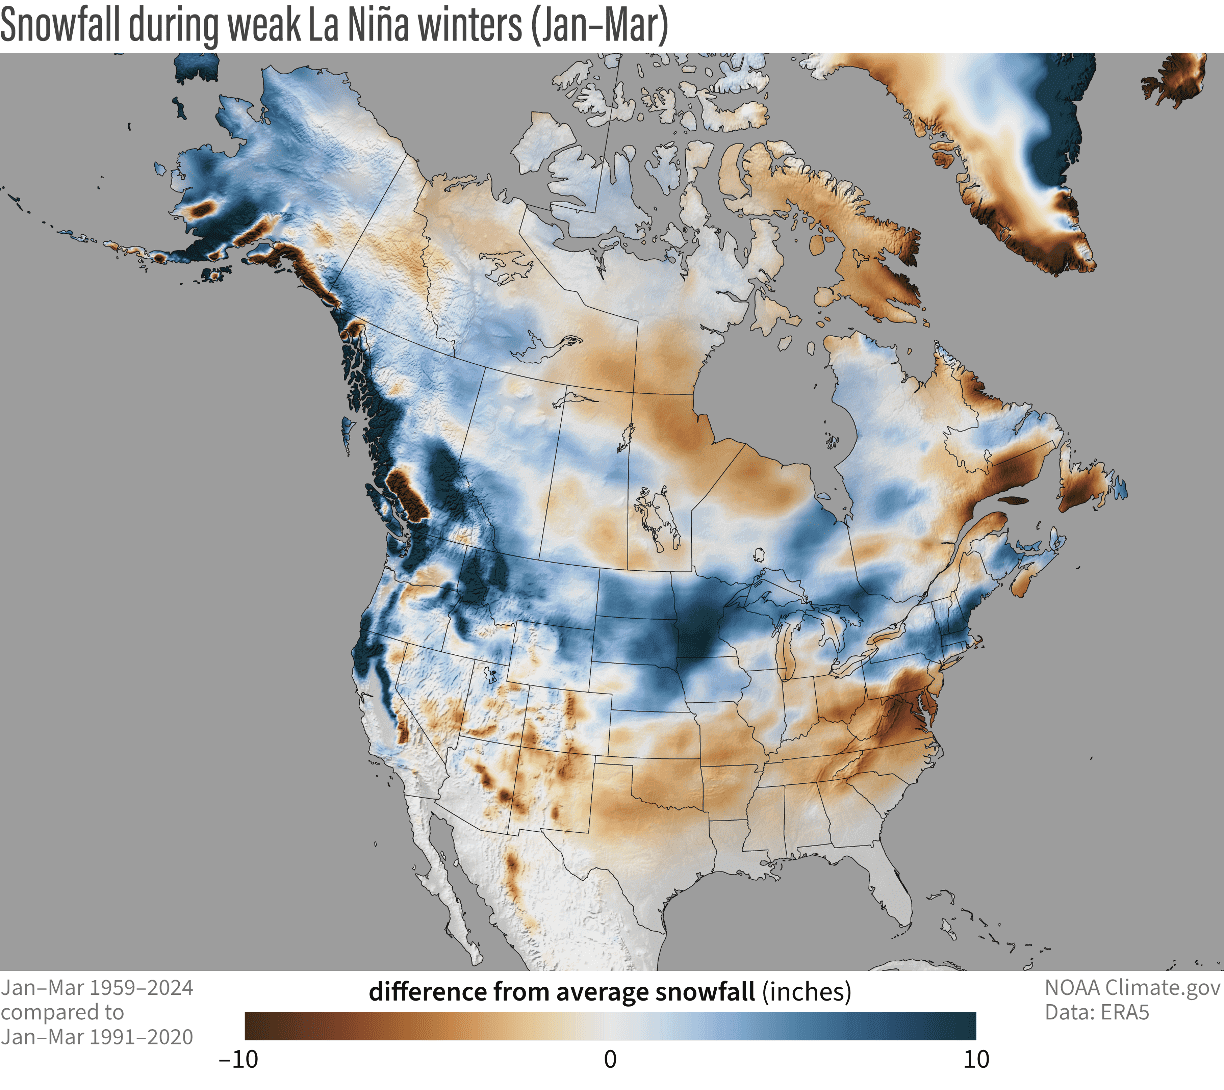
But there are some differences between regions. You can see that the north-central U.S., including the Dakotas, Nebraska, and Minnesota, had an even snowier winter during weak La Niña years. There is also more snowfall across the northeastern United States but less over the southeastern U.S..
Looking at how many (out of nine) weak La Niña events had below-average snowfall also shows a similar pattern, with almost all weak La Niña winters having more snowfall over the northeastern U.S., northern Plains, and the northwest.
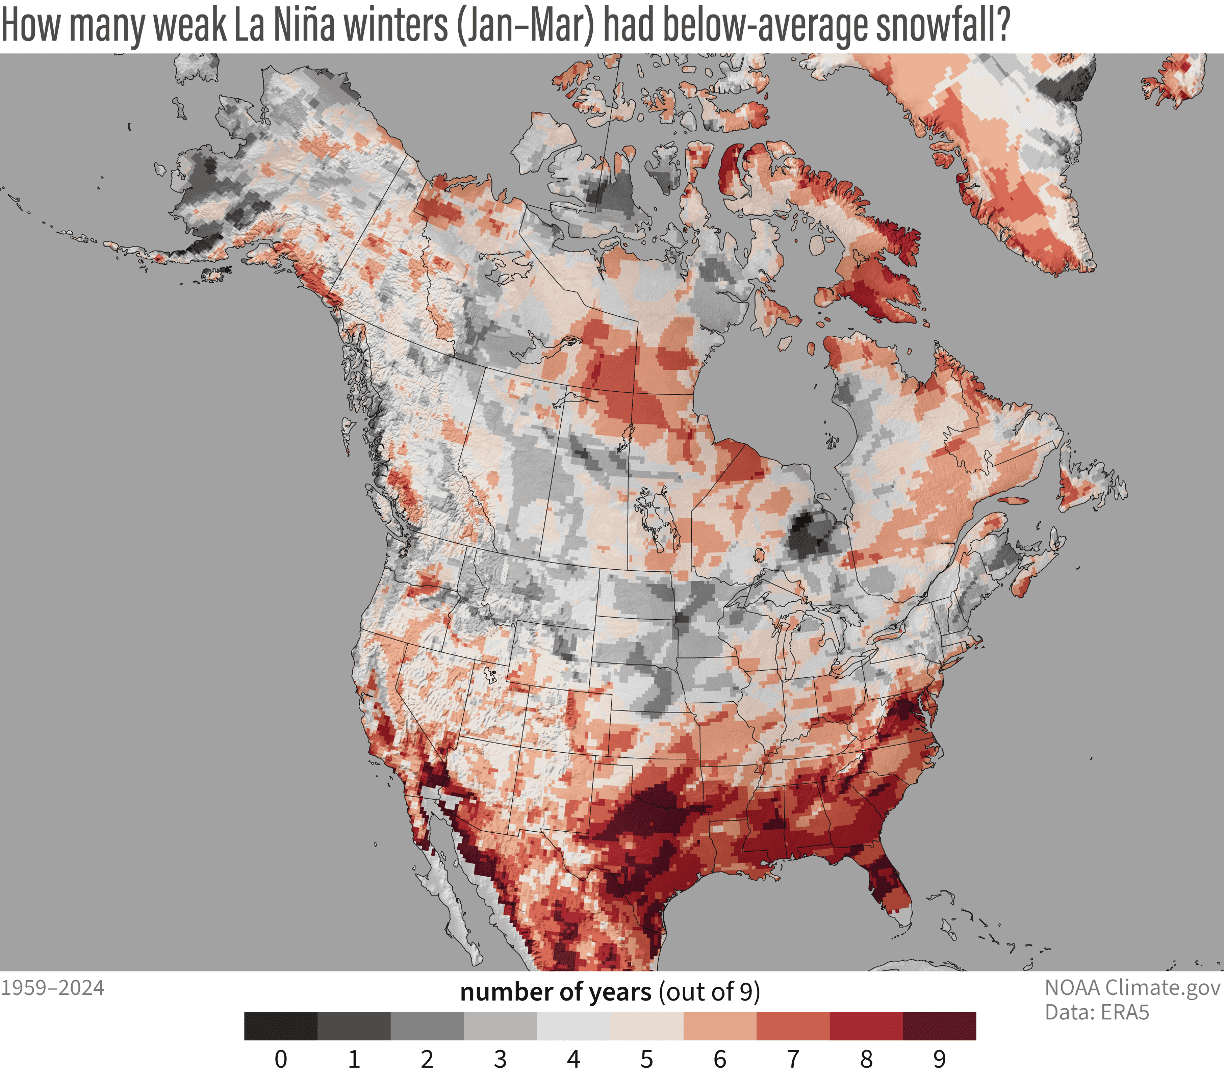
The data also shows that Virginia, Maryland, and Washington, D.C., had below-average snowfall in almost every single weak La Niña winter.
Behind all these seasons and decades is also a changing overall trend in snowfall amounts. The image below shows changes in January–March snowfall across North America from 1959 to 2024. Most of the United States has seen a snowfall decline over past decades, while some areas in Canada keep increasing.
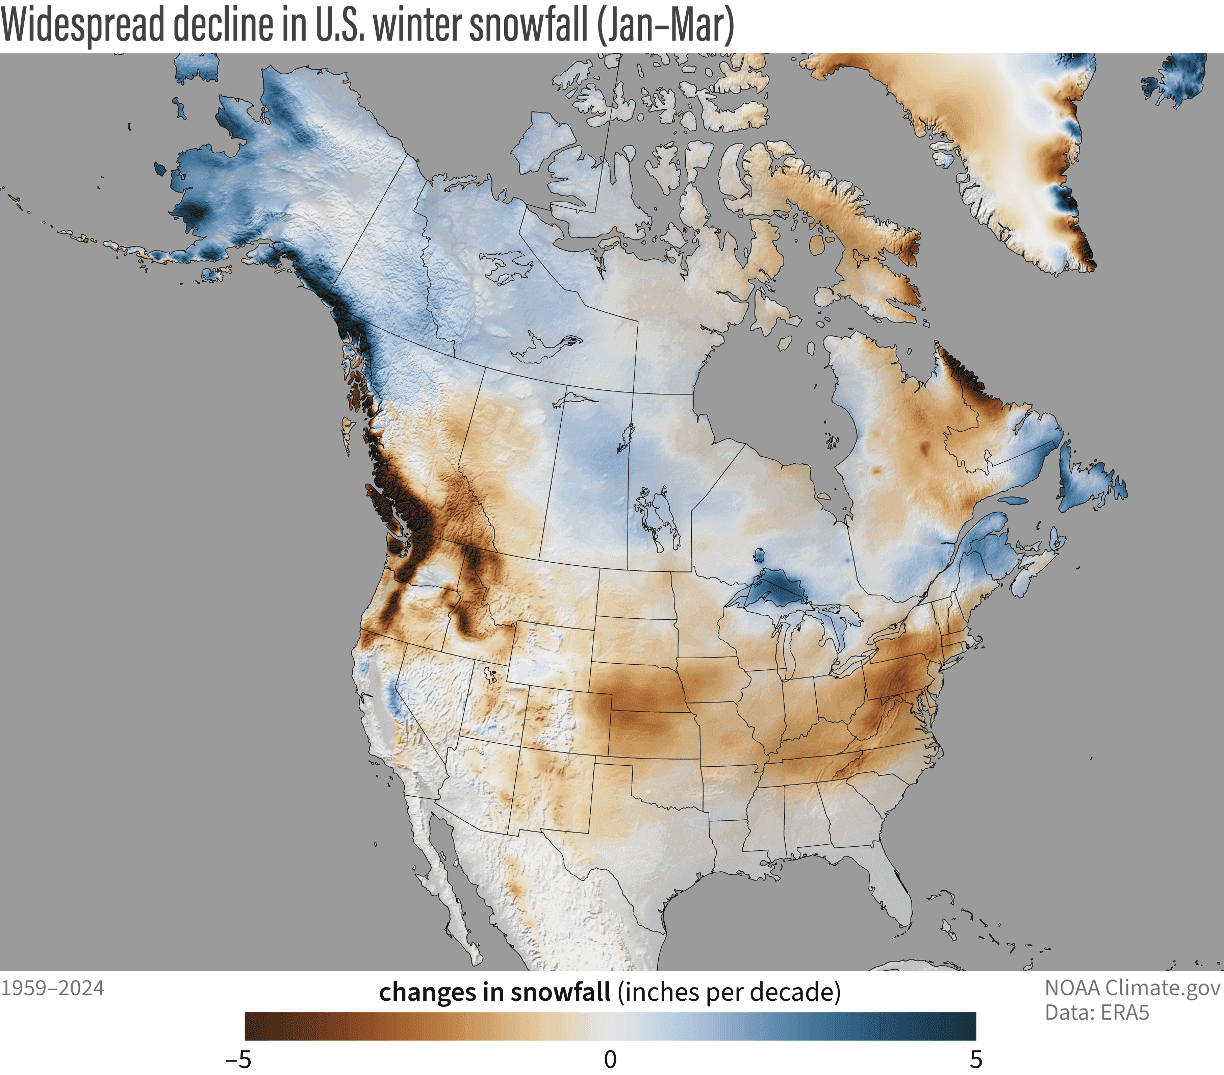
You can still see the area around the Great Lakes and the far northeastern United States that defy this long-trend and keep the same or higher snowfall amounts on average.
We will keep you updated on other developing weather trends, so bookmark our page. Also, if you have seen this article in the Google App (Discover) feed, click the like button (♥) there to see more of our forecasts and our latest articles on weather and nature in general.
Don’t miss:
Latest Winter 2024/2025 Snowfall Predictions: A Slow start but with a Late surprise