La Nina has entered its third cycle after defying its breakdown in the tropical Pacific Ocean. Cold anomalies are focused more on the central Pacific regions and remain stable. Latest forecasts show the La Nina to remain around for Fall and Winter 2022/23, creating a disturbance in the atmospheric flow.
But what is La Nina, and how can it change the seasonal weather worldwide? As you will find out, it is one part of an extensive system that connects the ocean and the atmosphere called ENSO.
We will look at the latest conditions across these ocean regions and the latest forecast for the coming months. Finally, you will see just how strong of an influence these oceanic anomalies can exert on the seasonal weather patterns, especially during the cold season.

ENSO GLOBAL WEATHER ROLE
ENSO stands for “El Niño Southern Oscillation.” This region of the equatorial Pacific ocean has periodic changes between warm and cold phases. Typically there is a phase change around every 1-3 years.
ENSO significantly influences the tropical rainfall and pressure patterns and the complex exchange between the ocean and the atmosphere. As a result, we can observe large-scale pressure changes in the tropics with each developing phase. Then, after some delay, these changes enter circulation over the rest of the world.
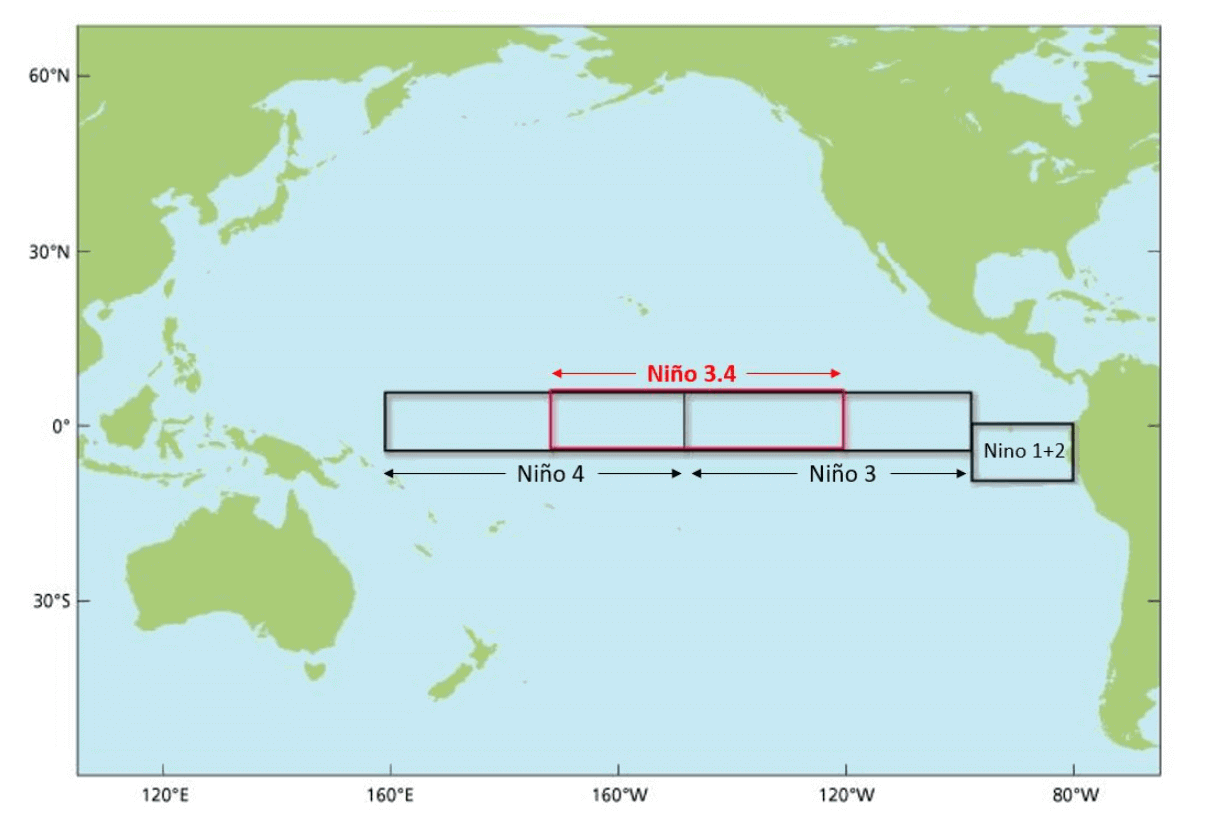
The image below shows the ENSO regions across the tropical Pacific. Regions 3 and 4 cover the east and west and cover a large part of the tropical Pacific. The main area is a combination of regions 3 and 4, seen in the image as the Nino 3.4 region.
Each ENSO phase influences the pressure and weather in the tropics differently. This affects the overall global circulation with time, changing the weather patterns worldwide.
Each phase (cold/warm) usually develops between late summer and early Fall and typically lasts until next summer. But some events can last up to two years.
The cold ENSO phase is called La Nina, and the warm phase is called El Nino. Besides the temperatures, one of the main differences between the phases is the pressure patterns they develop.
During an El Nino, the pressure over the tropical Pacific is lower, with more rainfall and storms in this region.
But during a La Nina, the pressure over the equatorial Pacific is high, creating stable conditions and less convection. These pressure changes translate into the global circulation, affecting both Hemispheres with time.
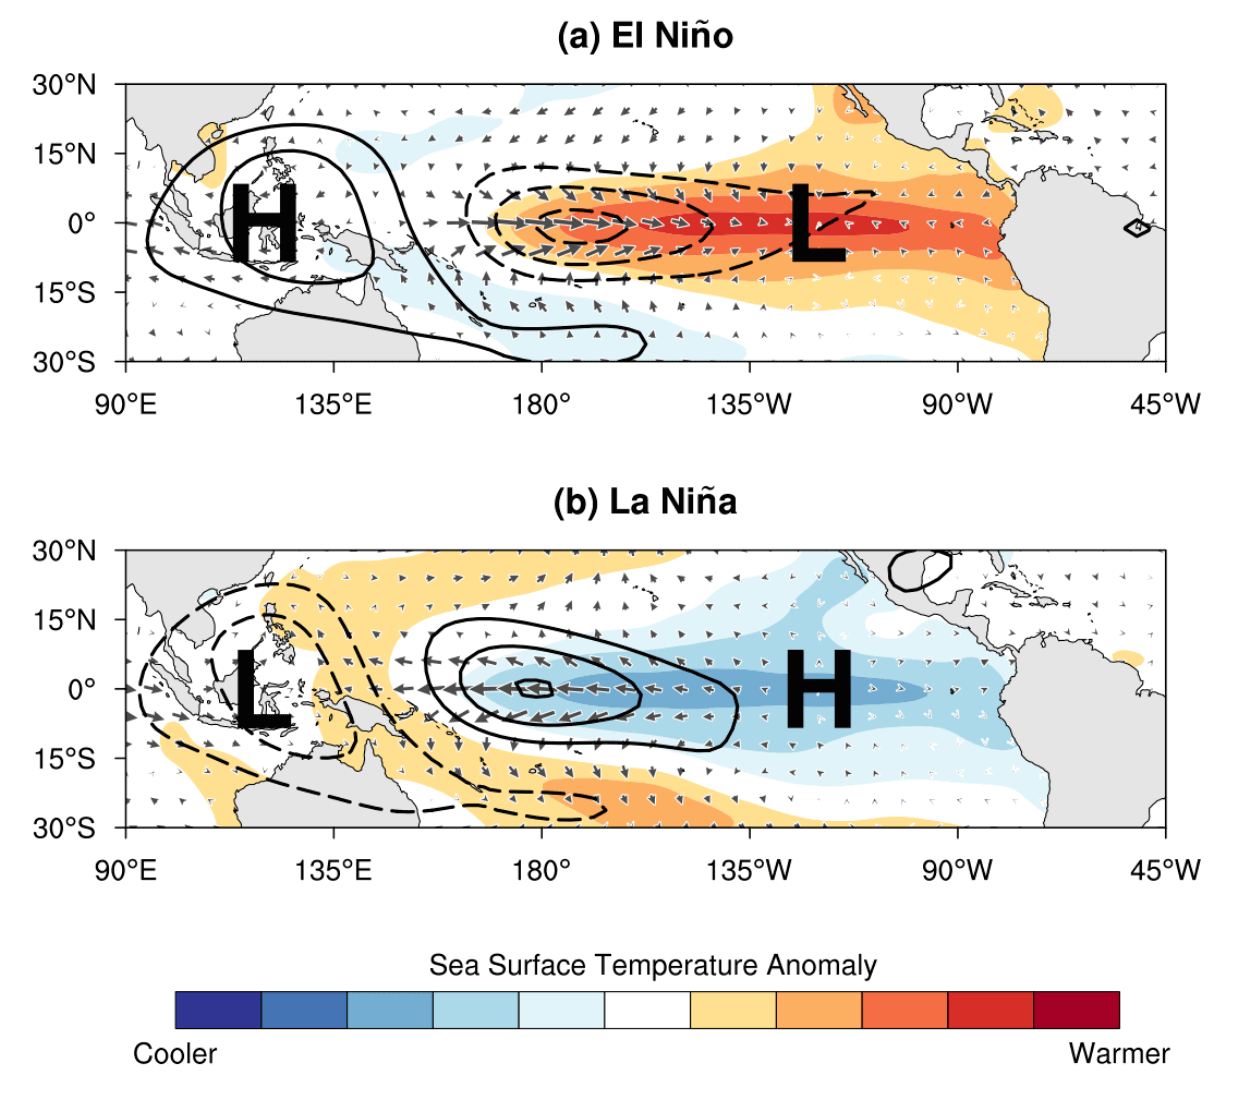
Typically, an El Nino produces stronger ocean anomalies, focused more on the central and eastern regions. But while La Nina usually has weaker anomalies, they typically peak more from the central to the western region.
The following image below from NOAA Climate shows the typical circulation during a cold ENSO phase (La Nina) which is currently active.
Air descends in the eastern Pacific, causing stable and dry weather. At the same time, the air is rising in the western Pacific, causing frequent thunderstorms, low pressure, and a lot of rainfall.
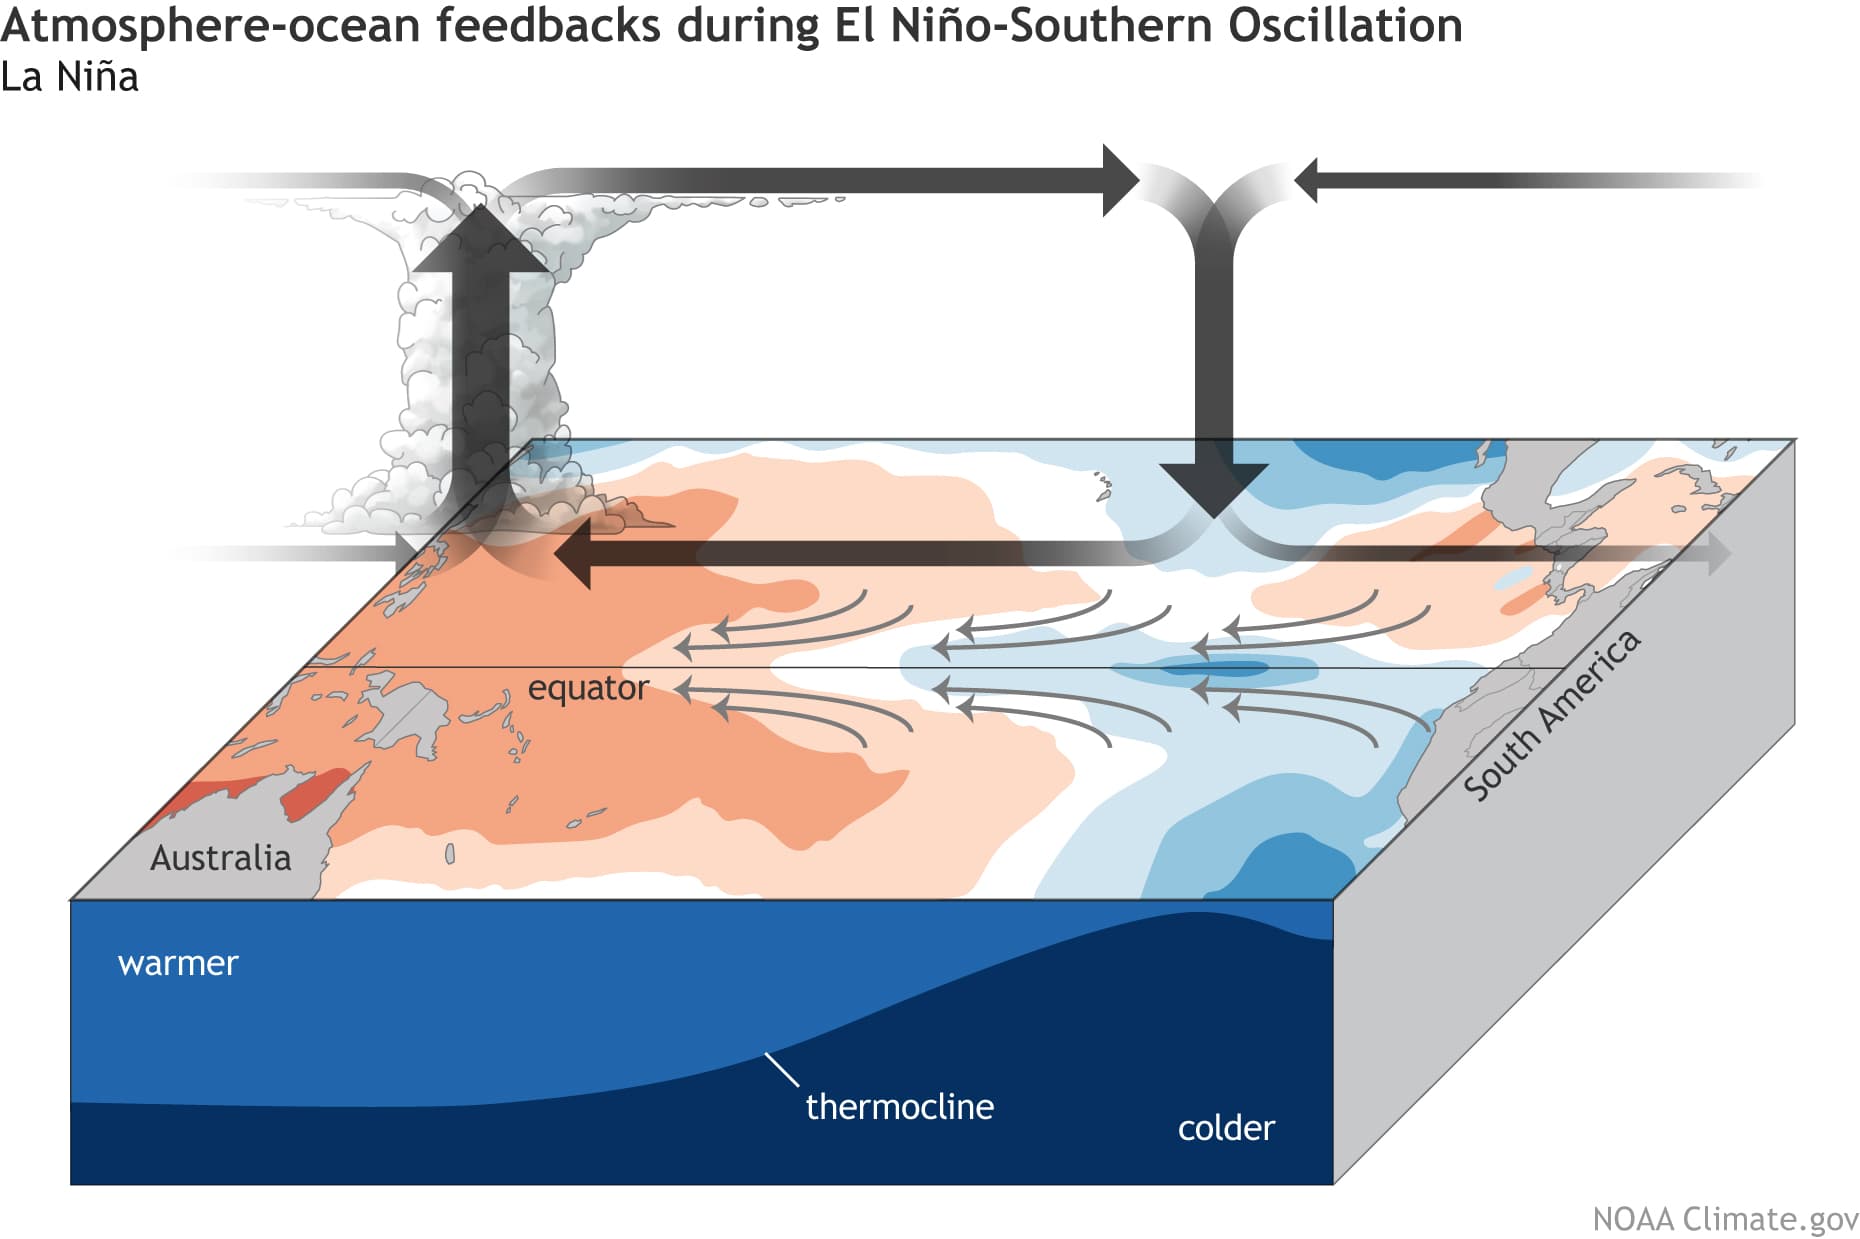
Image by NOAA Climate
This way, ENSO has a major impact on the tropical rainfall and pressure patterns and thus impacts the ocean-atmosphere feedback system. Through this ocean-atmosphere system, the ENSO influence is distributed globally.
We usually observe a global shift in pressure patterns during the emergence of an ENSO phase, but it is more influential during the peak of its phase.
But why does ENSO even shift between cold and warm phases? There is no simple answer, but we can say that it results from the complex relationship between pressure patterns and winds.
The tropical trade winds usually start or stop a certain phase by overturning the ocean surface layers and altering the ocean currents and temperature.
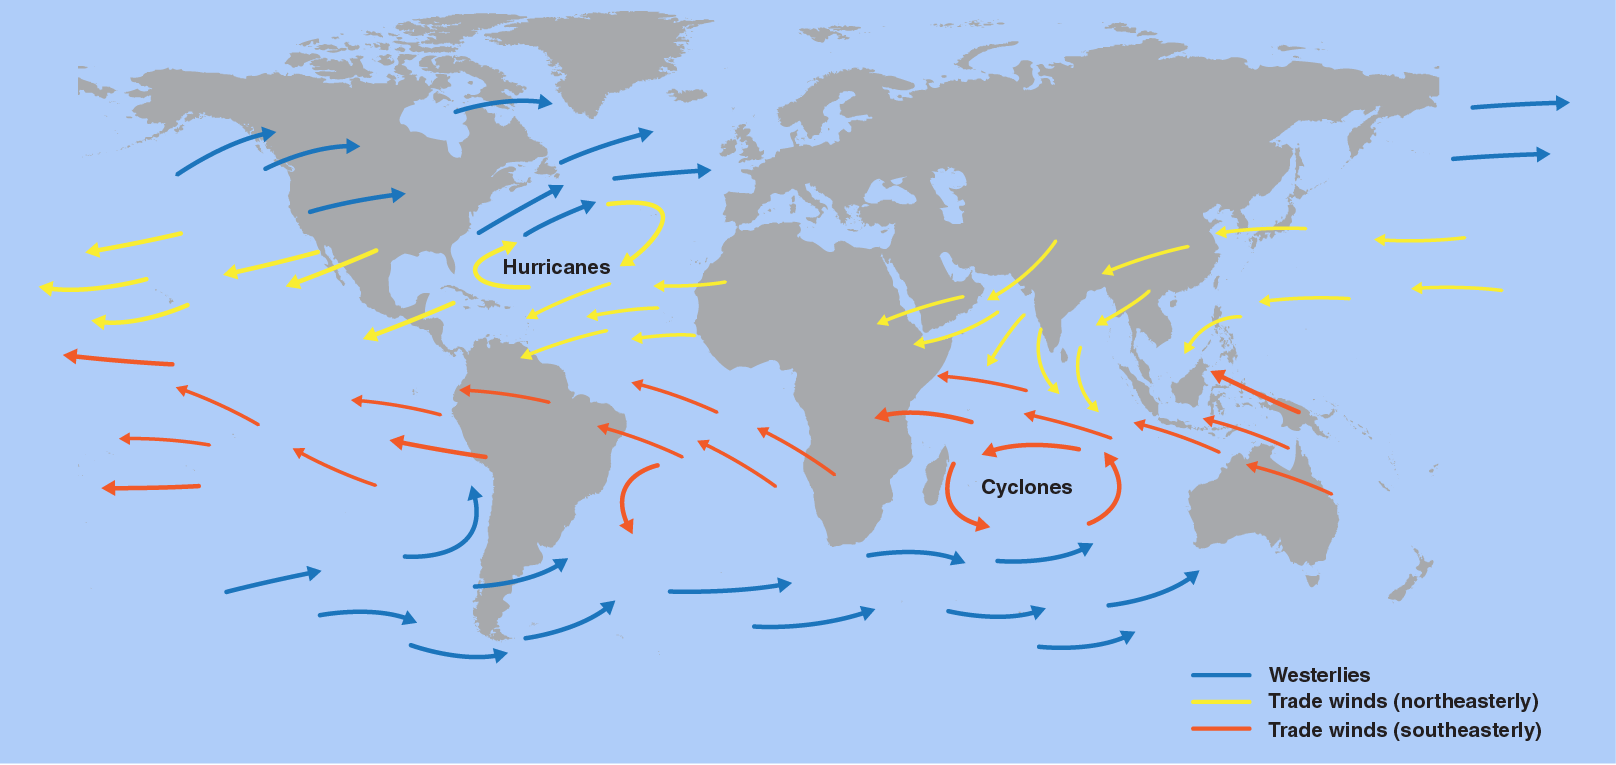
What are the trade winds? They are steady and persistent winds, blowing towards (and along) the Equator in both Hemispheres. The image below from Weather.gov nicely shows a simplified map of the prevailing global winds, with tropical trade winds in yellow and red.
When these easterly winds get stronger, they tend to change the ocean surface currents, and they start pushing the water from east to the west. This pushes warmer surface waters towards the west but brings deeper (colder) waters to the surface to replace them.
This process is much better seen in the video animation below, showing ocean temperature anomalies from Summer to late Fall 2021.
ENSO cooling starts in July, as the cold waves develop across the equatorial Pacific. They are formed as the surface water is pushed west by the trade winds, now replaced by deeper, colder water.
The image below shows the latest trade wind anomalies in the tropical regions. We can see stronger than average easterly trade winds (negative). Strong trade winds prevail in the tropical Pacific across the westerly/central ENSO regions.
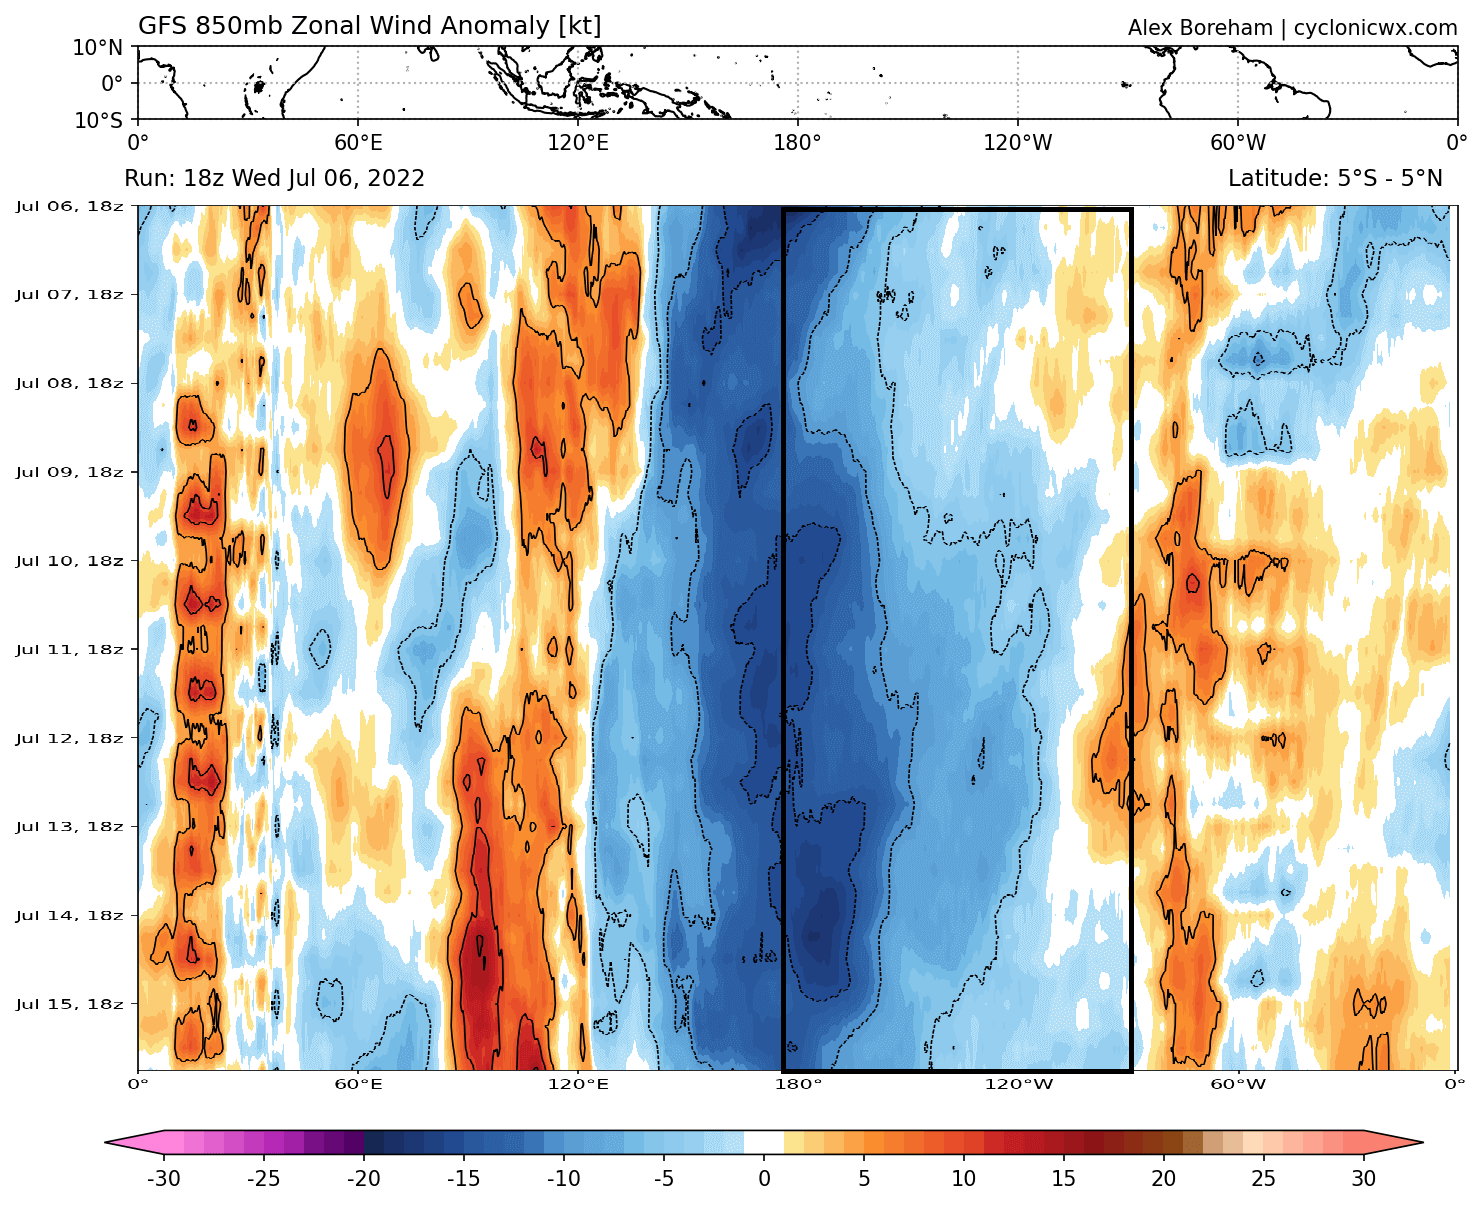
Image by cyclonicwx.com
But the key here is not just in the winds themselves, as pressure changes typically drive them. Instead, the ENSO phase directly responds to an atmospheric pressure change called the Southern Oscillation Index.
The Southern Oscillation Index or SOI represents the difference in air pressure measured at Tahiti (French Polynesia) and Darwin (Australia). The image below shows the location of the two pressure zones that are important for ENSO.

Positive SOI values mean the pressure over the Tahiti side is higher than over Darwin in Australia. This corresponds to stronger easterly trade winds, supporting La Nina conditions.
But during an El Nino, we see lower pressure in the eastern Pacific, over Tahiti, and higher over Darwin, Australia. This produces a negative SOI value and weaker trade winds, which means less ocean surface cooling.
On the SOI analysis below, we can see persistent positive values. Such data further supports stronger trade winds and ocean cooling in the ENSO regions, sustaining and extending the La Nina towards Fall 2022.

Image by longpaddock.qld.gov.au
LA NINA CONTINUES – LATEST DATA
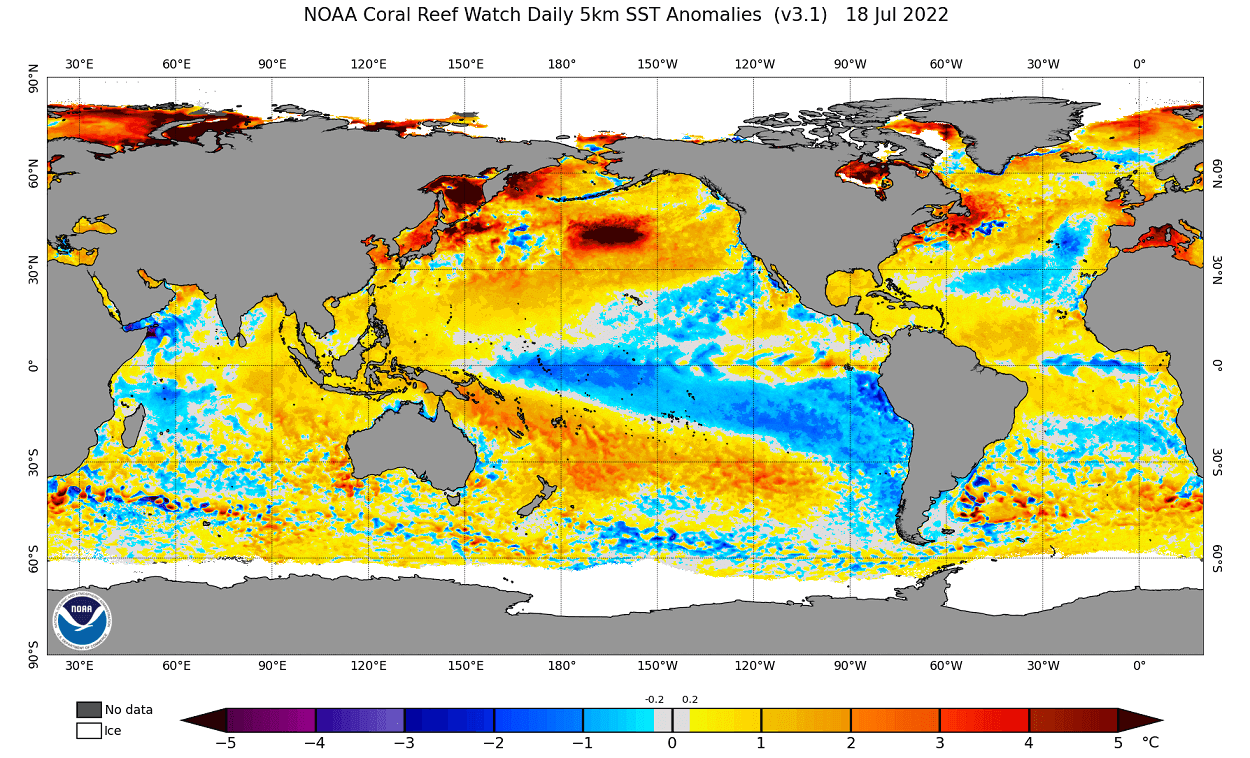
Current global ocean analysis reveals the continuing presence of cold ocean anomalies in the tropical Pacific. This is across the ENSO regions, with the easterly region also having some warm anomalies mixed in.
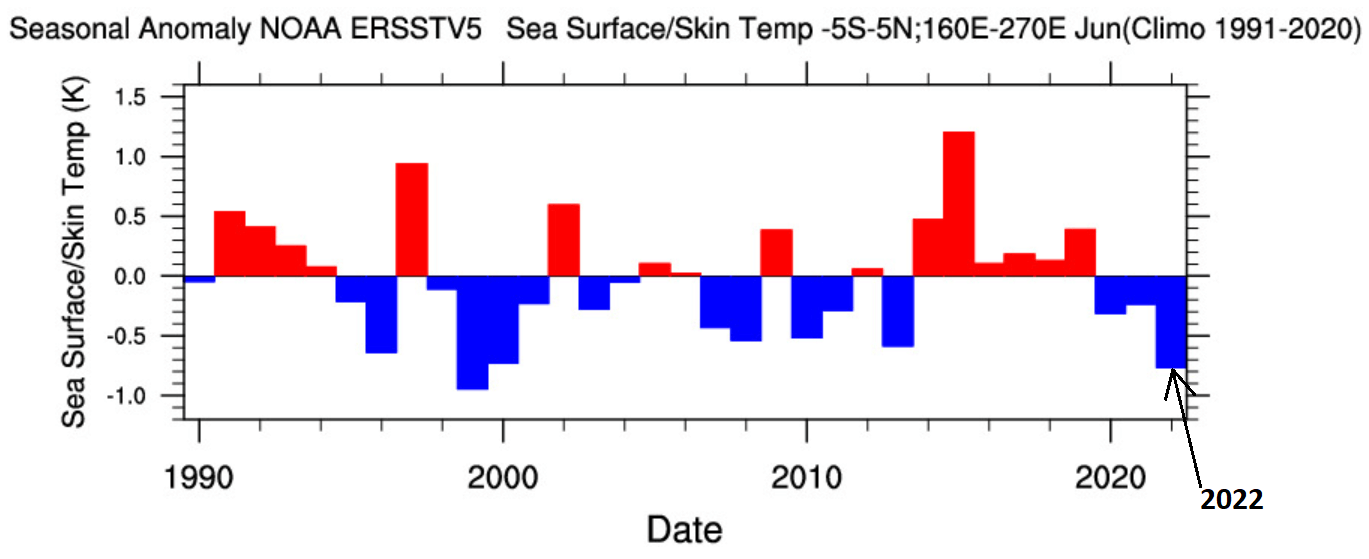
The sustained trade winds have helped to sustain the cold anomalies in the central and western tropical Pacific. Looking at the historical analysis below, we can see that the anomalies have reached unusually cold levels across the ENSO regions this season, being the second coldest in the past 32 years.
Focusing on region 3.4, you can see the La Nina from the last two years in the image below. New ocean cooling began in late Summer and Fall last year. That was the development of the current cold phase. Peak cooling was weaker than the first La Nina, as the second-year event is usually weaker than the first event.

But every summer, the pressure and wind patterns change across the tropical regions. This usually means a change in the trade winds and weakening of the cold ENSO phase.
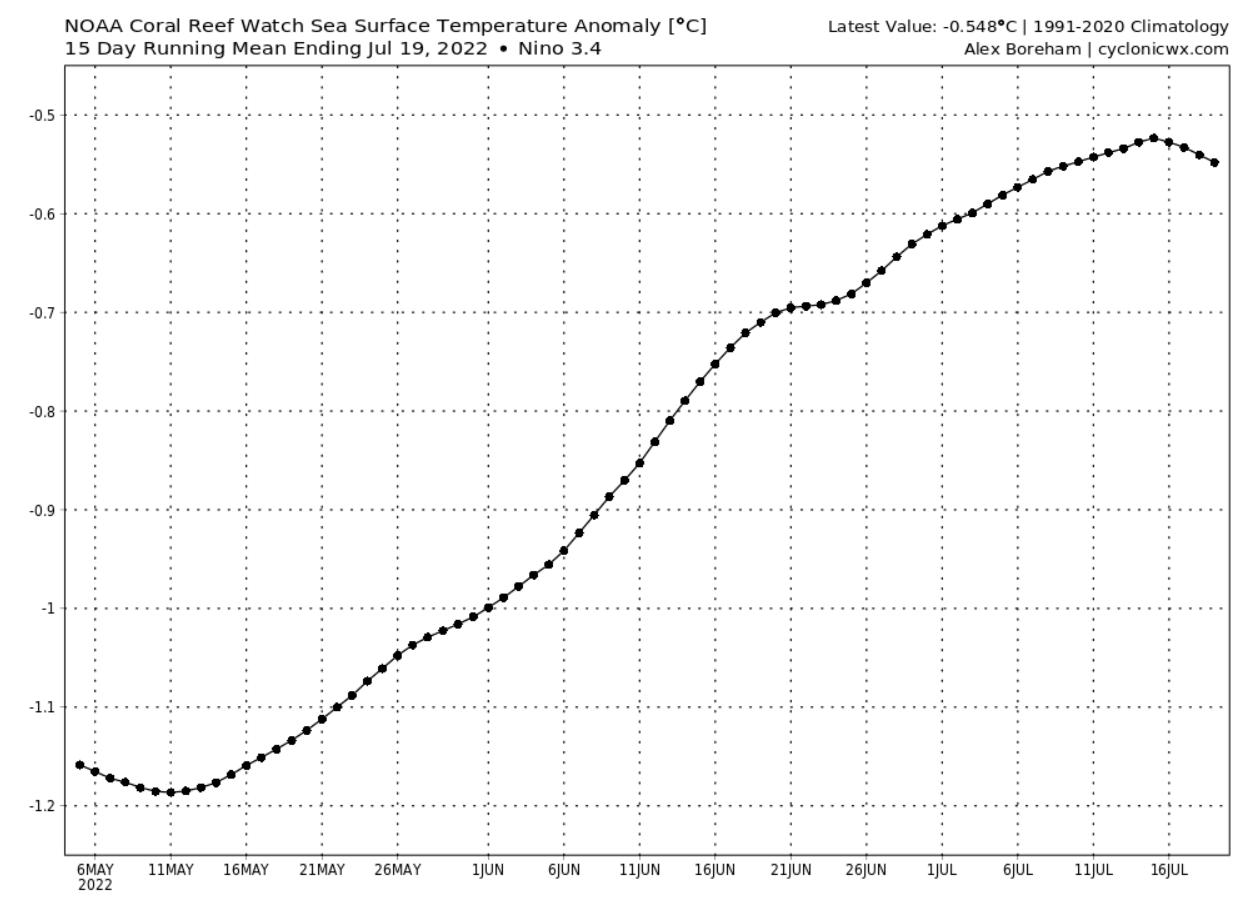
You can see this process on the graph below, which shows the temperature anomalies in the ENSO 3.4 region. Cold anomalies have weakened in the past two months but remain within the La Nina threshold (below -0.5).
But looking more closely at the latest anomaly analysis of the ENSO regions, you can see the cold anomalies returning in the central and western tropical Pacific. Some warm anomalies are present in the eastern region, where a subsurface Kelvin wave is emerging.
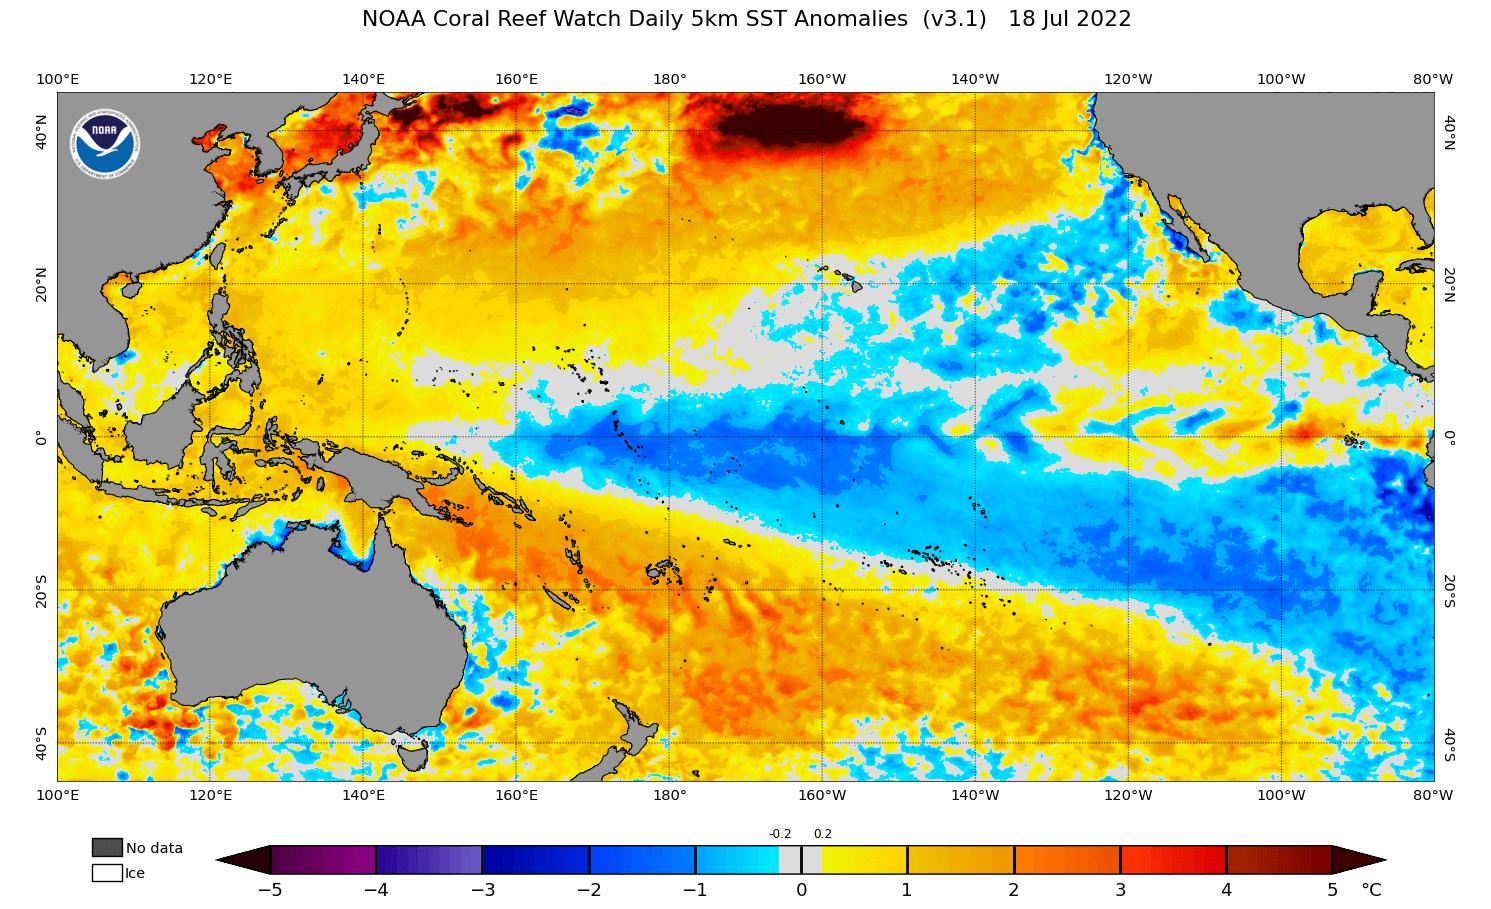
The graph below focuses on the western ENSO 4 region. We are now in a decent cooling episode after a temporary reduction of cold anomalies in June. This is mainly a result of stronger easterly trade winds in this region.

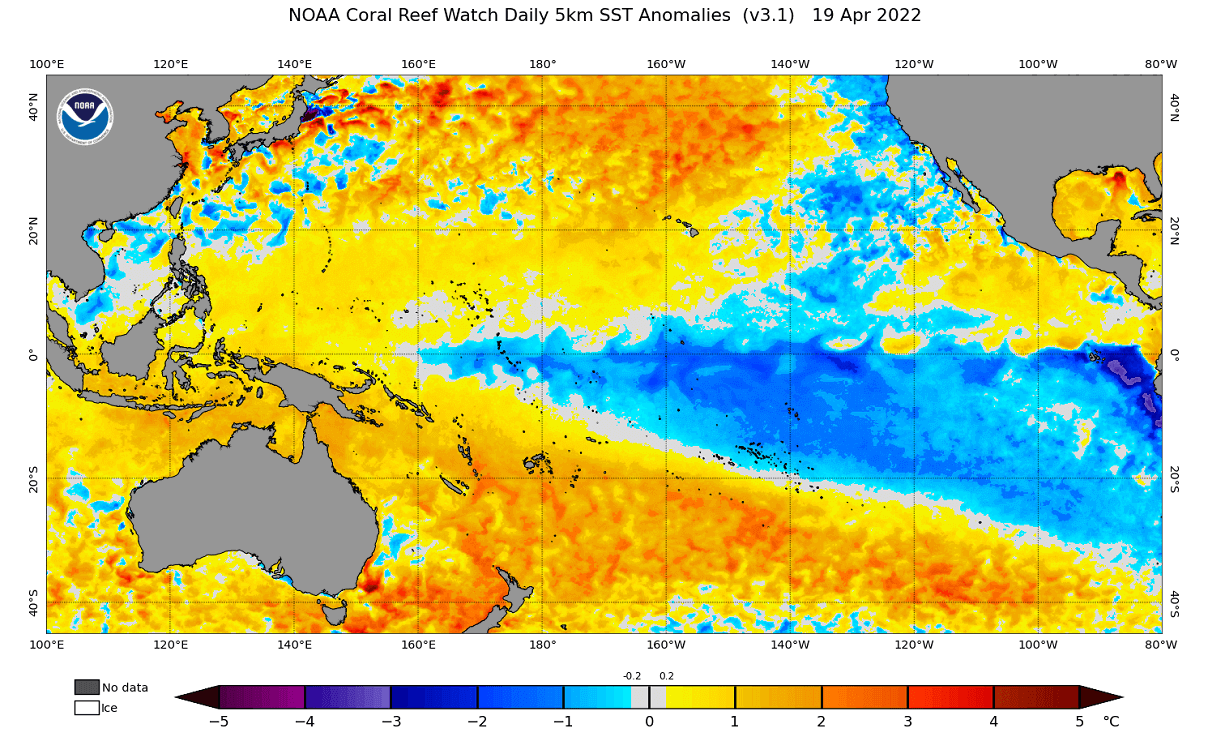
We have the ocean analysis from mid-April below. Cold anomalies were much stronger in the eastern tropical Pacific region. But the cold anomalies broke down in the central and western ENSO regions. Currently, the westerly ENSO 4 region is looking better and “healthy.”
Below we have a 15-day ocean temperature anomaly change. Again, we can see the mixed temperature changes in the easterly ENSO regions. But in the westerly region, there is still mostly continuous cooling.

But perhaps a stronger (invisible) process is developing below the ocean surface. The animation below shows the latest temperature anomalies by depth across the tropical Pacific Ocean. A warm Kelvin Wave was spreading below the ocean surface, eradicating the subsurface La Nina cold pool.

The Kelvin Wave was present at around 80-200m depth. It was pushed in by the westerly currents. It is now weakening as the burst of easterly trade winds is helping to push for subsurface cooling again.
But looking now at the latest high-resolution depth analysis under the ENSO regions, we see colder than normal temperatures below the surface returning in the central region. In addition, the currently emerging warm pool is seen mixing in with the cooler surface anomalies in the easterly parts.

One way to look at the whole ENSO region’s phase strength is the ocean heat content. This also considers the water temperatures at depth, not just at the surface.
And below, we can see the cold anomalies developing this Spring. The cold subsurface anomalies have weakened into early Summer, with the Kelvin Wave below the surface. But a new cold wave is taking over, as seen in the depth images above.
We can see the whole process better in the following image below. It shows the upper ocean heat anomalies across the tropical Pacific regions. We can see the warm Kelvin wave peaking in June, but it is now breaking down as the easterly Trade Winds re-intensify.

The subsurface cooling is part of the forecast, keeping the surface La Nina conditions active into Winter 2022/2023.
We know the current state of La Nina and how it got to this point. So it’s time we look at how it is expected to evolve further into the year and how it will impact our seasonal weather.
ENSO SEASONAL FORECAST
We will focus on the ENSO evolution through the late summer and early fall season. It will help us to understand the scale of the potential influence of La Nina during the cold season.
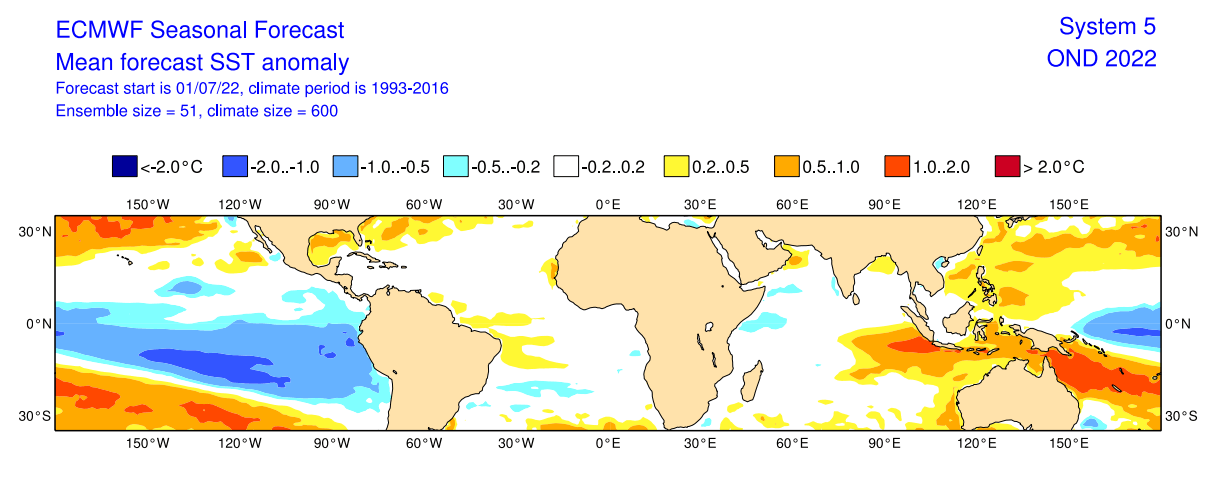
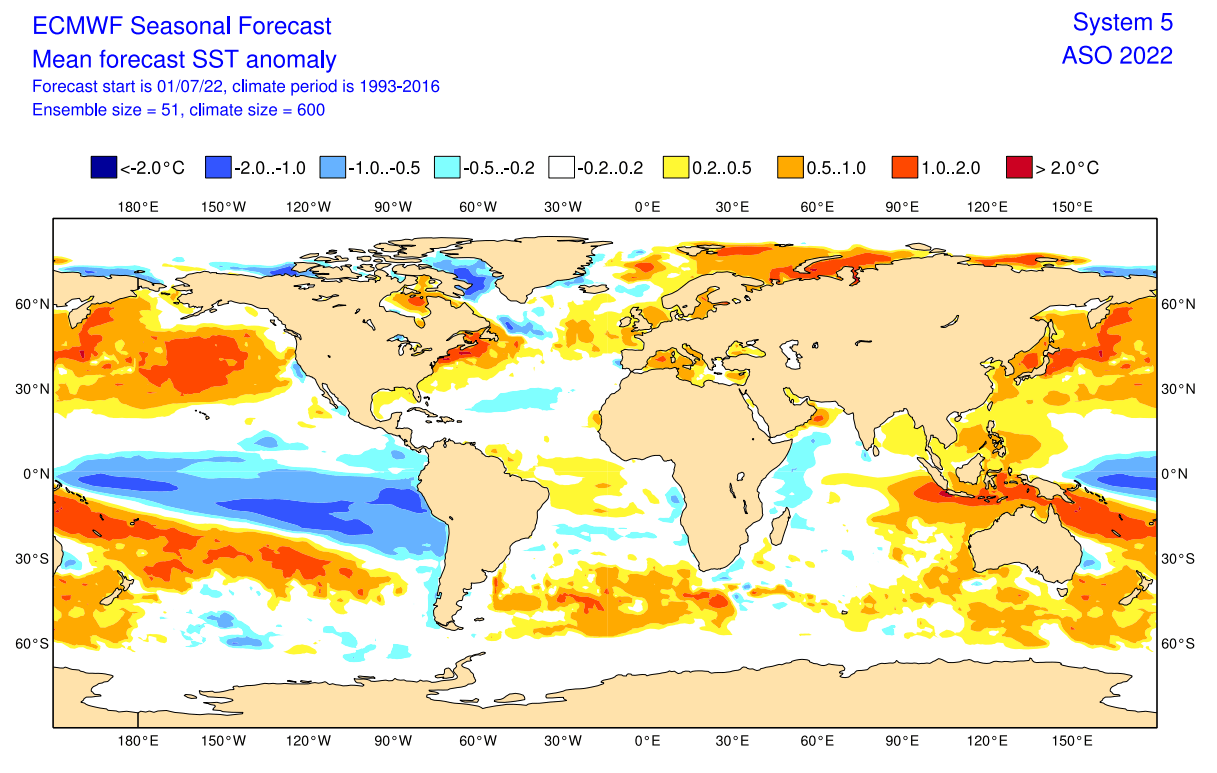
Below is the ocean temperature forecast for the Fall 2022 period from the ECMWF. It shows a continuing cold anomaly across the equatorial Pacific Ocean. In addition, some cold anomalies can be seen south of the Equator and towards the west, keeping this an active La Nina phase.
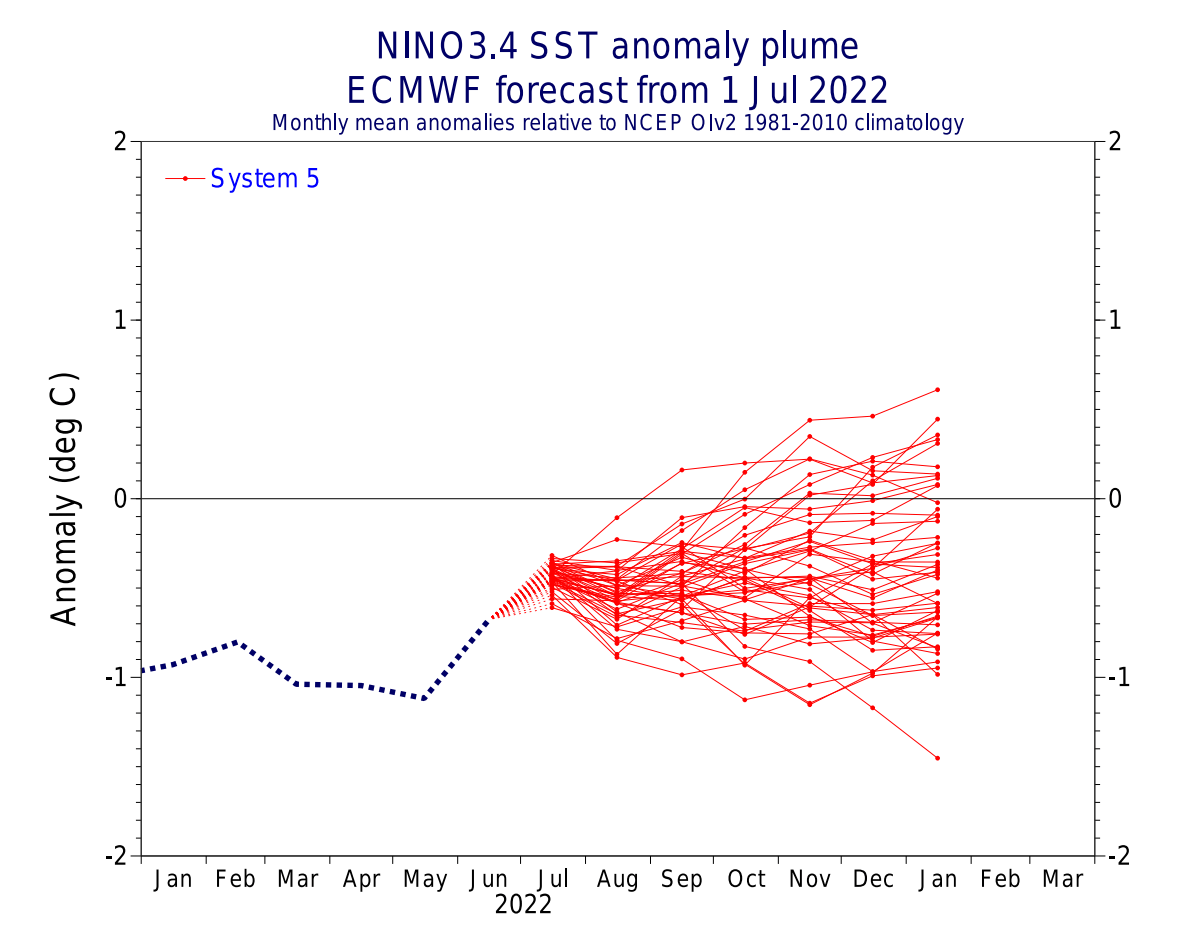
The ENSO analysis and ensemble forecast below from ECMWF shows the La Nina conditions from last Winter and lasting into Summer. However, the forecast does show a sustained cold phase into the Fall. There is less certainty going into Winter 2022/23, but more members currently support the negative phase.
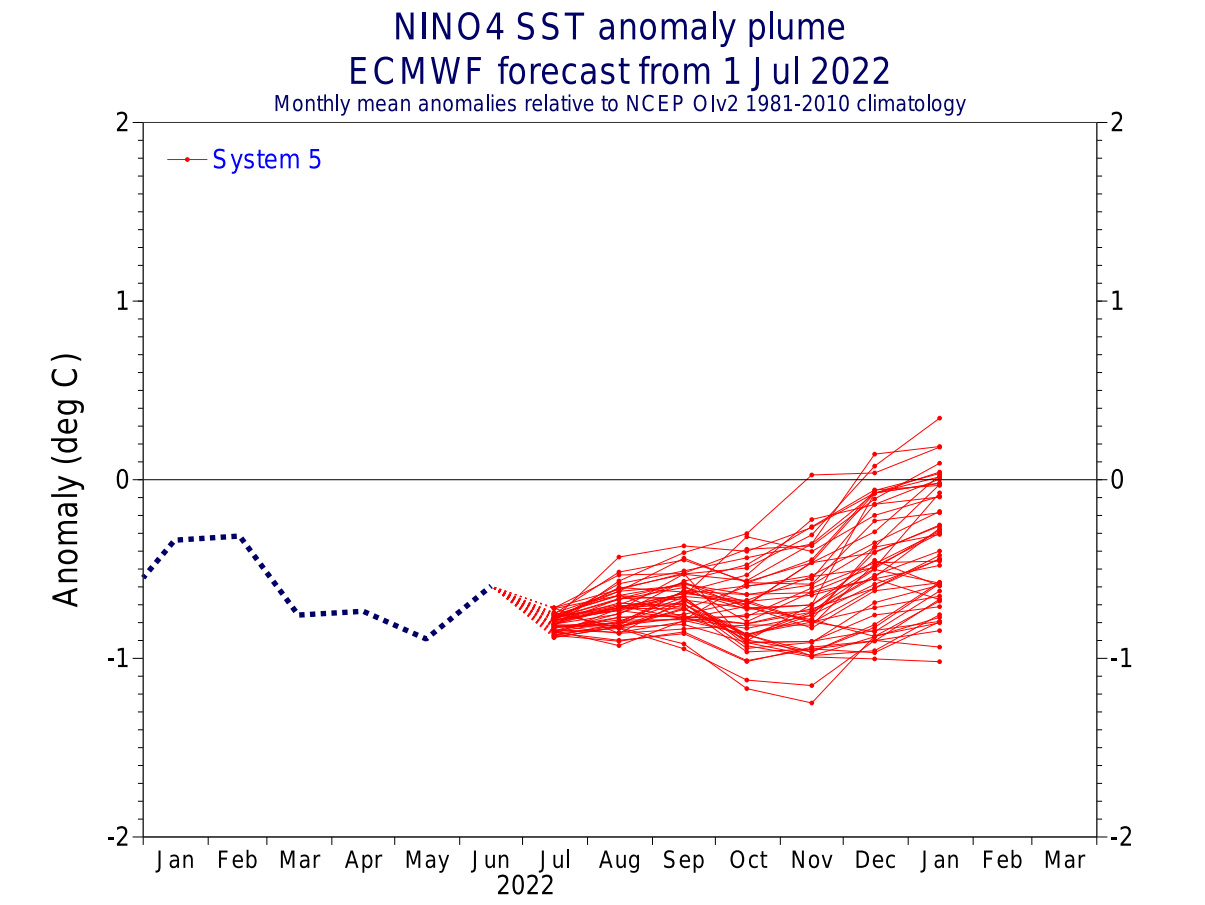
Looking at the western ENSO 4 region, it has a more sustained cold phase forecast. It shows that a west/central-based La Nina event will likely last over Fall and the following Winter.
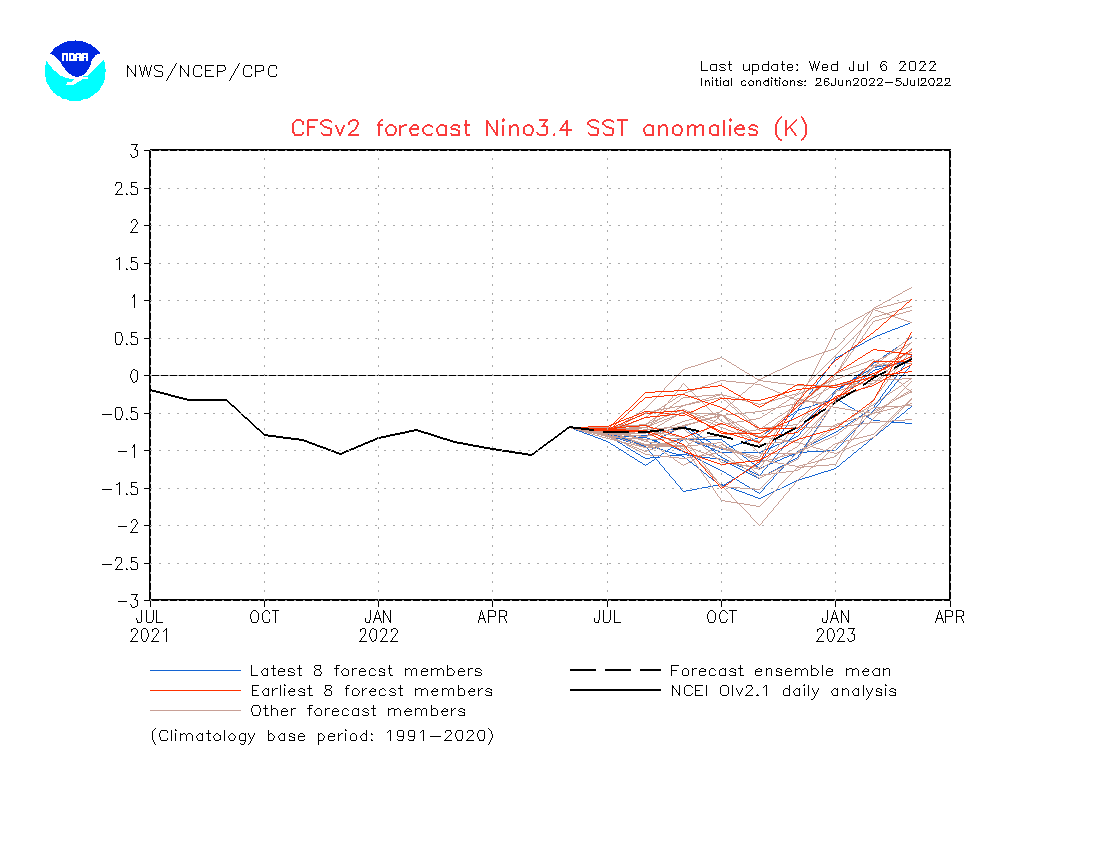
The ENSO forecast from the United States CFSv2 is similar. It shows the current cold anomalies to sustain La Nina conditions into next Winter. It hints at a breakdown of the La Nina during Winter, ending its unusual 3-year period.
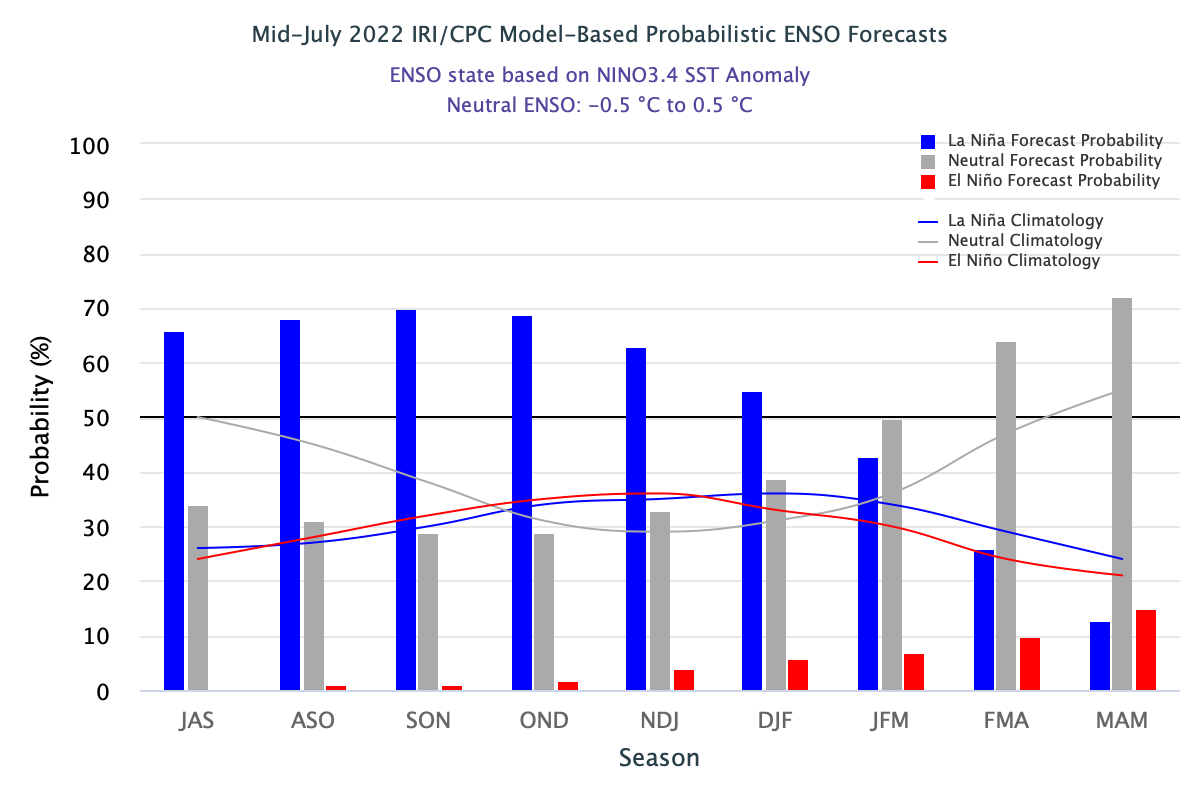
The CPC/IRI official probabilistic ENSO forecast shows the current La Nina lasting over Fall and Winter 2022/23. It is typical for a new phase to emerge in late summer/fall with seasonal pressure changes. But for now, the La Nina will likely continue into next Winter.
Below is an analysis and forecast image from multiple global seasonal models, updated this month. They show a consensus for the La Nina sustaining into the Winter. Going into 2023, the La Nina is likely to end, with its influence still lasting into Spring 2023.

But how does the La Nina event impact the seasonal weather?
LA NINA SEASONAL WEATHER
Based on all the available data, an official La Nina advisory is in effect, as explained in the statement by the NOAA’s Climate Prediction Center:
“La Niña is favored to continue through the Northern Hemisphere summer, with a 50-55% chance through the Fall. This month, the forecaster consensus predicts Niño-3.4 index values to weaken into the summer but remain below the threshold of La Niña.”
But what seasonal weather effects can we expect from the currently active La Nina?
Below is an image showing the average winter pressure pattern from multiple La Nina winters. The main feature is a strong high-pressure system in the North Pacific and low pressure over Canada.

Image by NOAA Climate
Looking closer at the La Nina cold season weather signature below, we can see its main feature, a persistent high-pressure system in the North Pacific. That shifts the jet stream from the northwestern United States down into the east, creating a “colder north/warmer south” weather pattern over the United States.
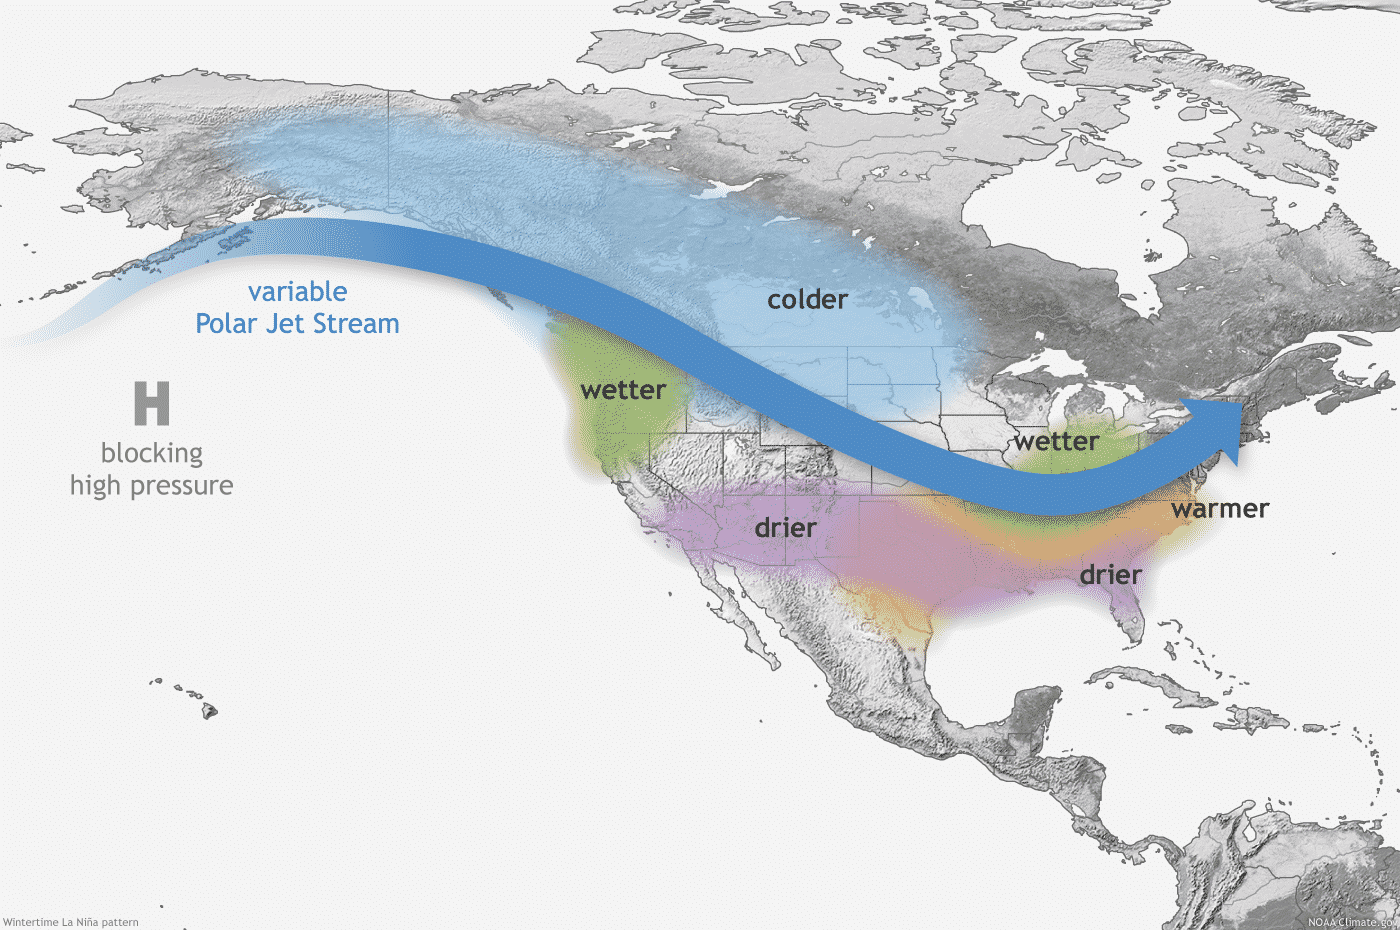
Image by NOAA Climate
Alaska, western Canada, and the northern United States typically get colder than normal temperatures during the cold season and more precipitation.
Southwestern and the southern United States usually experience warmer and drier conditions during a La Nina cold season.
But what can we expect from the La Nina influence during the rest of Summer?
The image below correlates the cold ENSO phase with the warm season jet stream. We can see a stronger jet stream over the northwestern United States and a weaker subtropical jet stream over the southern United States.

Historically, a high-pressure blocking system in the North Pacific is the most typical effect of a cold ENSO phase. We can see below that the North Pacific high-pressure tendency during a La Nina also exists during Summer. The high-pressure pattern extends from the North Pacific into the west/central United States.
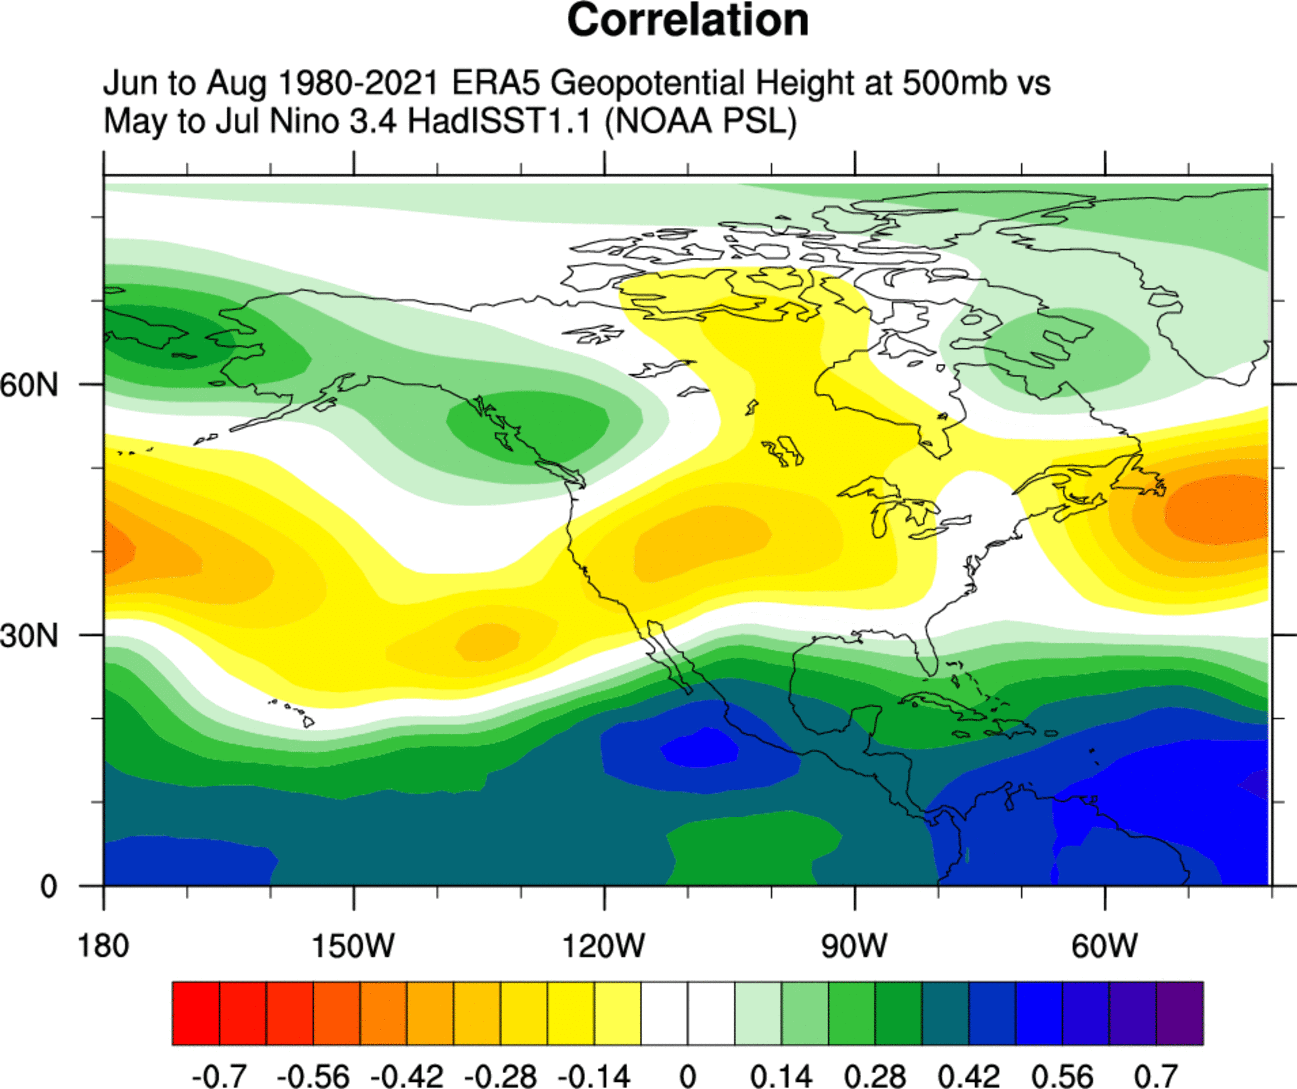
But we can also see a stronger high-pressure signal over the northeastern United States, centering into the North Atlantic to the east.
This segment focuses more on the Pacific/North American region because La Nina’s influence is most profound here during the warm season. Unlike in the cold season, there is much less (or none) of an actual direct weather pattern effect on the European sector.
Below are the Summer temperature and precipitation anomalies for the United States in Summers following an active La Nina phase.
We can see warmer temperatures over much of the country’s western half. Of note is a colder than the normal signal for the southeastern United States.
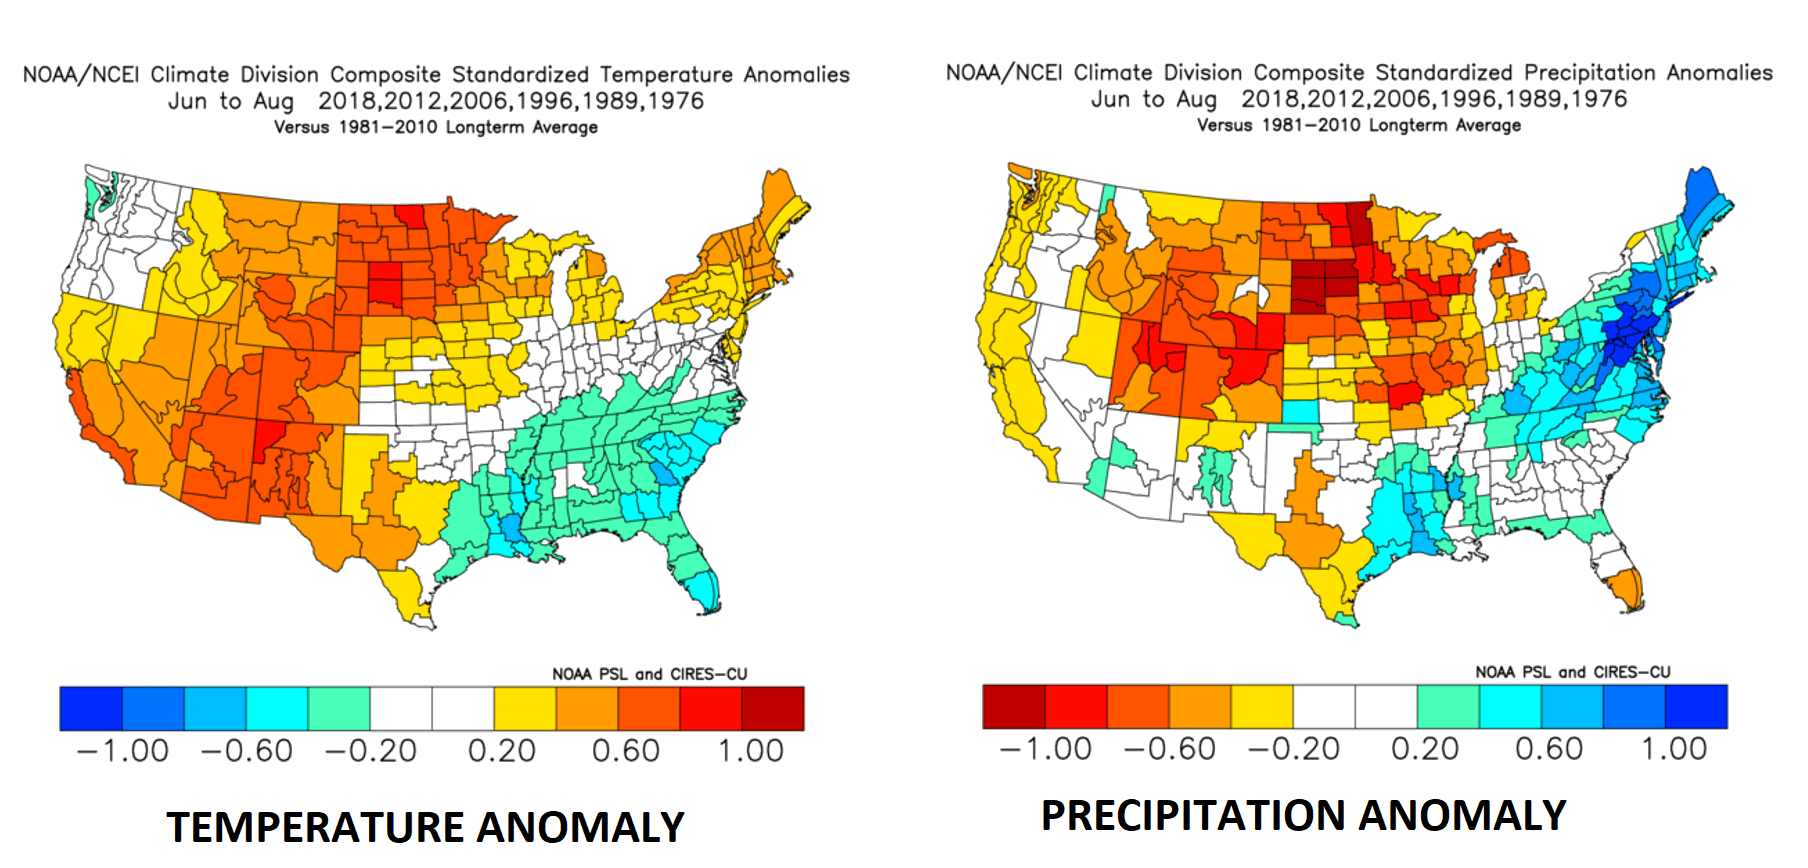
Precipitation-wise, we see a drier signal for a La Nina Summer over much of the north, central and western United States. However, more precipitation is hinted over the Ohio Valley, the northeastern United States, and the southeast.
These are patterns based on the historical data, combining previous such events. But now, we will look at the actual long-range forecast and see what the model calculations show regarding the La Nina long-range influence.
LA NINA 2022 LONG-RANGE WEATHER INFLUENCE
We will look at the seasonal trends for late Summer and early Fall 2022, using the ECMWF forecast. The period in question covers the August-September-October period (ASO 2022).
We typically use the ECMWF, which is often referred to as the most reliable model in the long-range category. In reality, a lot can change with the individual year/season. But generally, the ECMWF model is at the top regarding the skill.
The pressure pattern forecast from ECMWF below shows a La Nina high-pressure system remaining in the North Pacific. It extends over the United States into the North Atlantic and Europe.

As shown in the La Nina signal graphic above, a stronger high-pressure area covers the northeastern United States. As a result, it will have a regional effect on the weather development in the eastern United States and eastern Canada.
A low-pressure tendency is signaled over Alaska and Canada.
The global temperature distribution also shows the La Nina pattern. Over North America, we see warm pooling over the central and northeastern United States. In contrast, normal to cooler regions prevail over Canada and likely the northwestern United States.
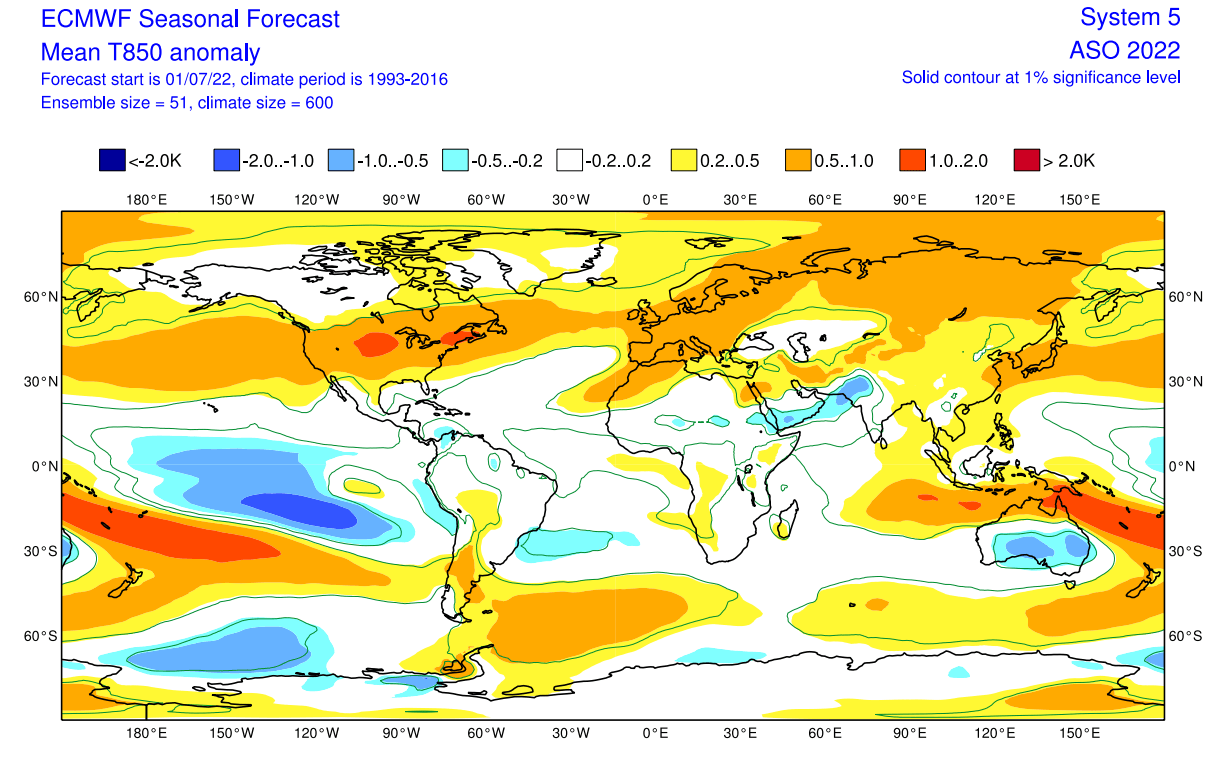
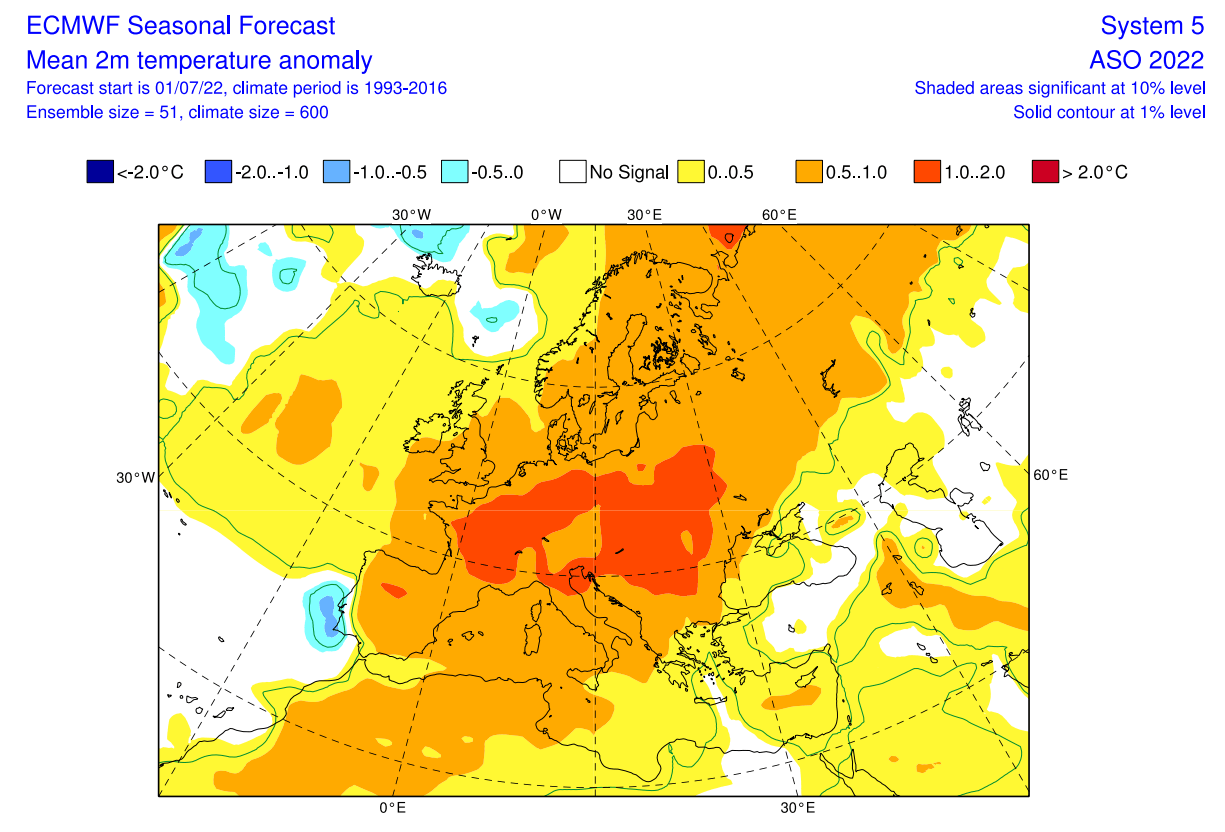
Europe features mostly warmer than normal conditions over the continent. Weaker warm anomalies are over far northern Europe, closer to the low-pressure area.
Looking closer at Europe, we see much warmer than normal weather over most of the continent. But the exception is far northwestern Europe, which will be under the influence of a low-pressure system.
Over North America, we can now better see the warm anomalies over much of the United States. Stronger warm anomalies are forecast over the Midwest and the northeastern United States.
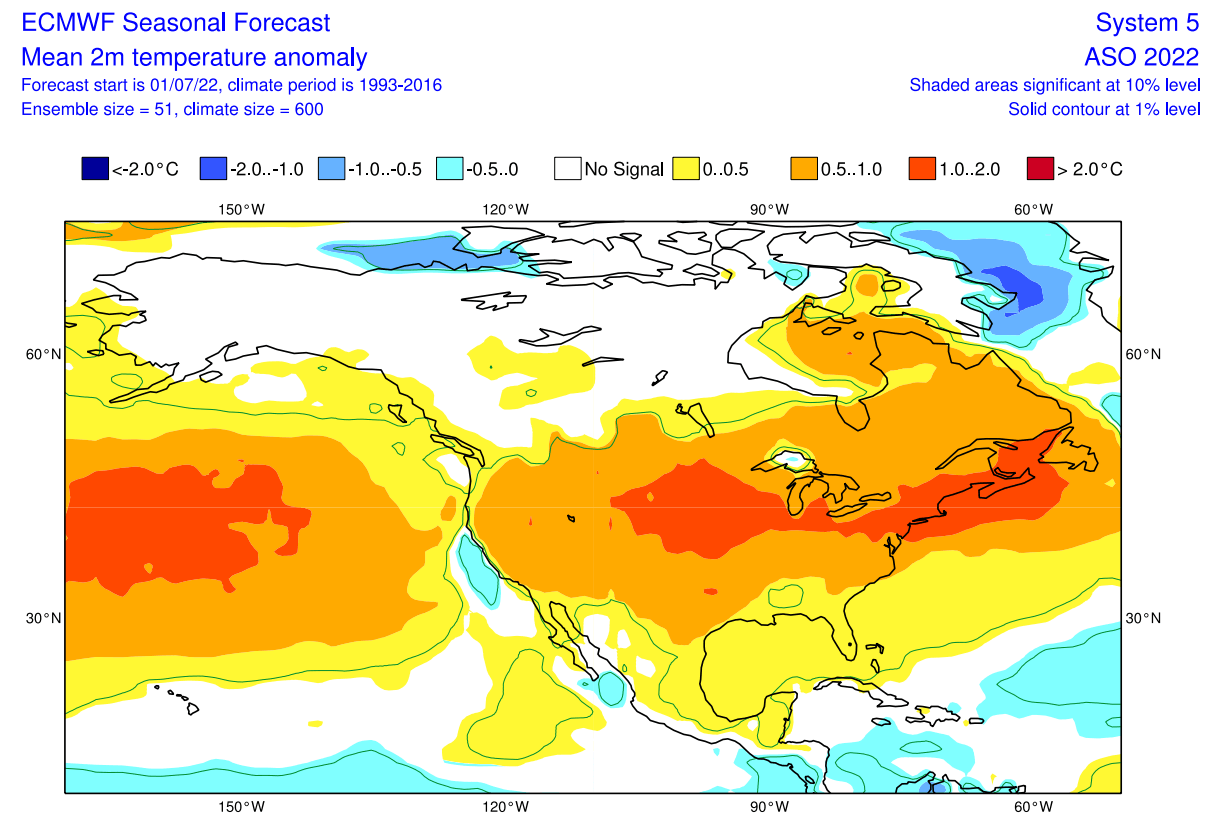
Warm anomalies are also forecast over eastern Canada. Central and western Canada is forecast with normal temperatures, under the more direct influence of a low-pressure system and the jet stream.
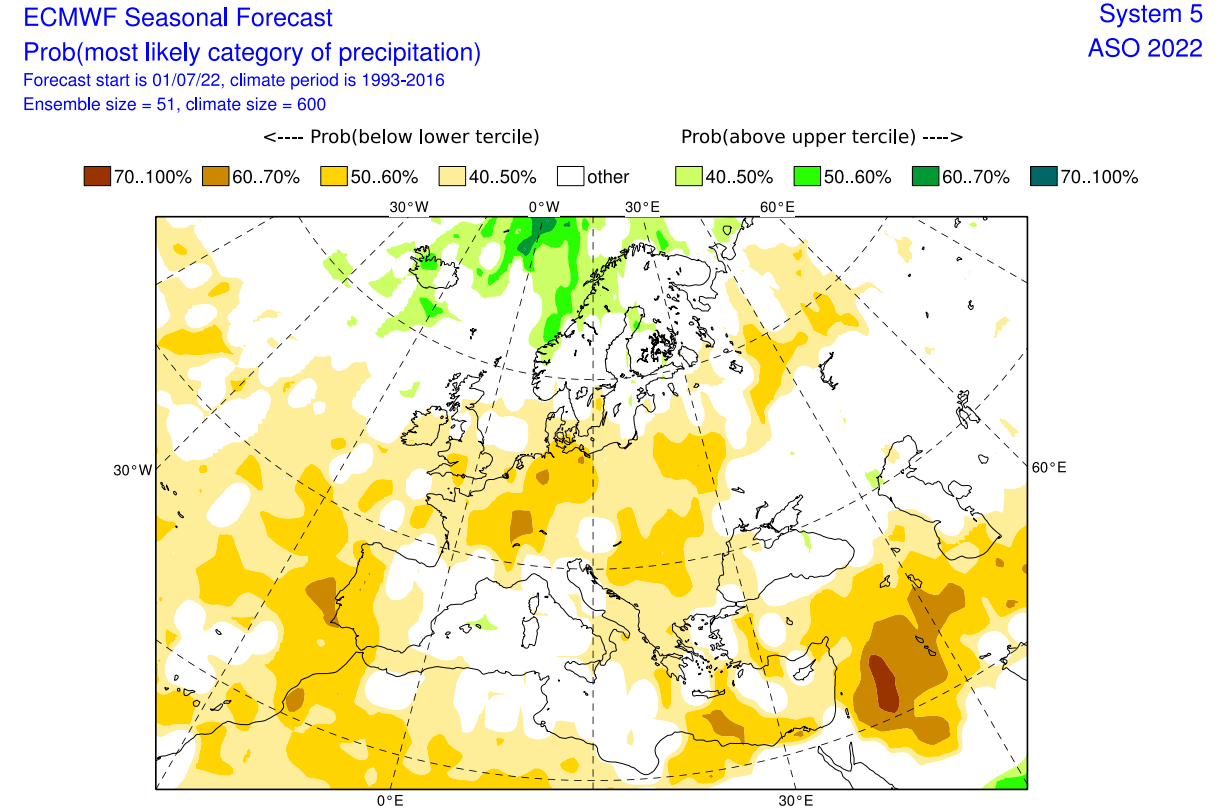
Precipitation-wise normal to wetter conditions will prevail over far northern Europe under the low-pressure zone. But the rest of the continent is expected to be drier than average, except for the western Mediterranean.
The precipitation forecast over North America shows drier conditions over the parts of central and northern United States. But parts of the southeastern and southwestern United States and eastern Canada have a higher chance of wetter conditions.
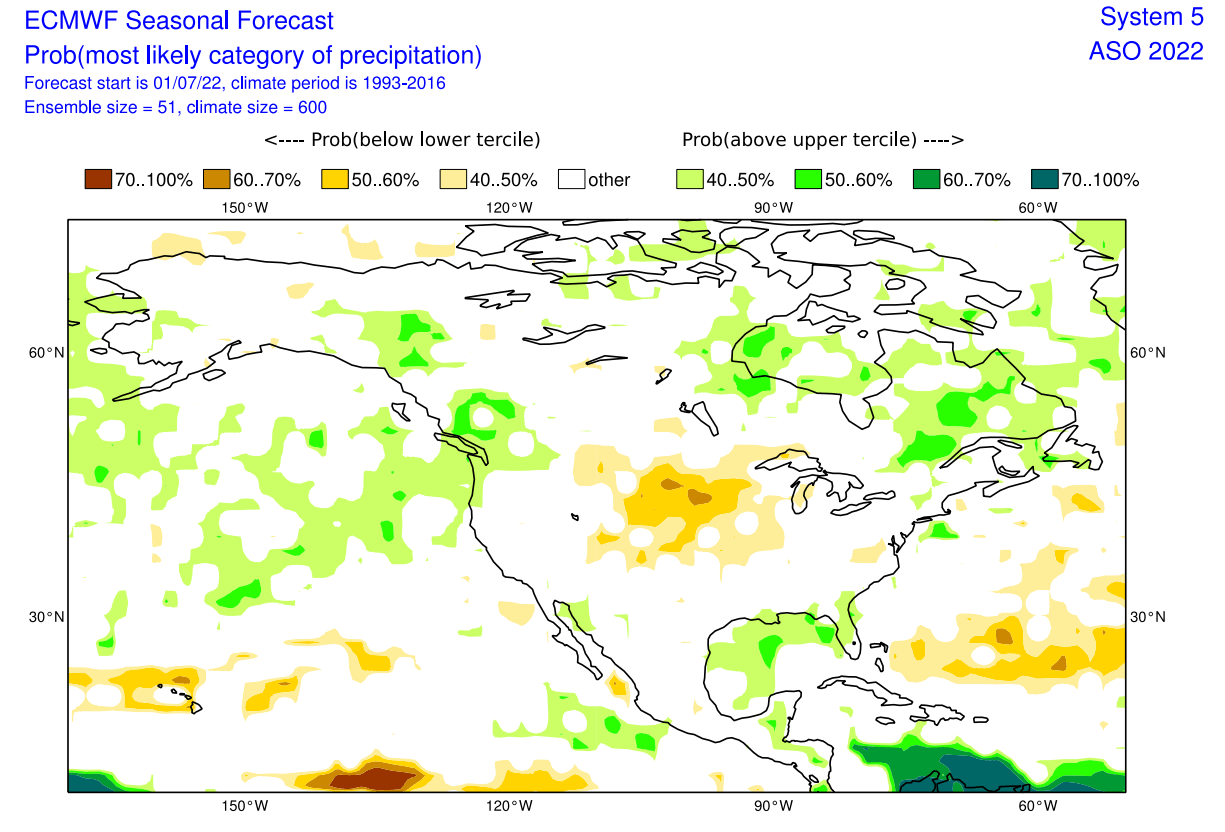
This distribution is somewhat in line with the warm season La Nina influence we have seen above, where the east and the southwestern United States can have more precipitation. Conversely, the drier zones move into central and northern regions.
Looking at the NOAA official Summer temperature outlook for the same period, most of the United States is warmer than usual. The main warm anomalies can be found in the western half of the United States and the northeast.
Forecast by NOAA/CPC
The official precipitation forecast is similar to the model forecast. We see an equal-to-higher probability for more precipitation over parts of the eastern United States. But most of the central United States is forecast to have drier conditions.

The problem with precipitation in a La Nina Winter season is typically the persistence of drought conditions in the southern and western United States. So we will look closely at precipitation in the upcoming Fall and Winter forecasts.
ATLANTIC HURRICANE SEASON 2022
We cannot go by the Atlantic hurricane season when discussing La Nina. There is a well-known influence of La Nina on the hurricane season, as we have different atmospheric conditions.
But it is well-known that La Nina influences the hurricane season, providing certain atmospheric conditions that favor an active season.
The image below shows La Nina’s influence on the Atlantic hurricane season. The main effect is weaker upper-level winds over the main development region; thus, the wind shear is lower, and the atmosphere supports the strengthening of tropical systems.
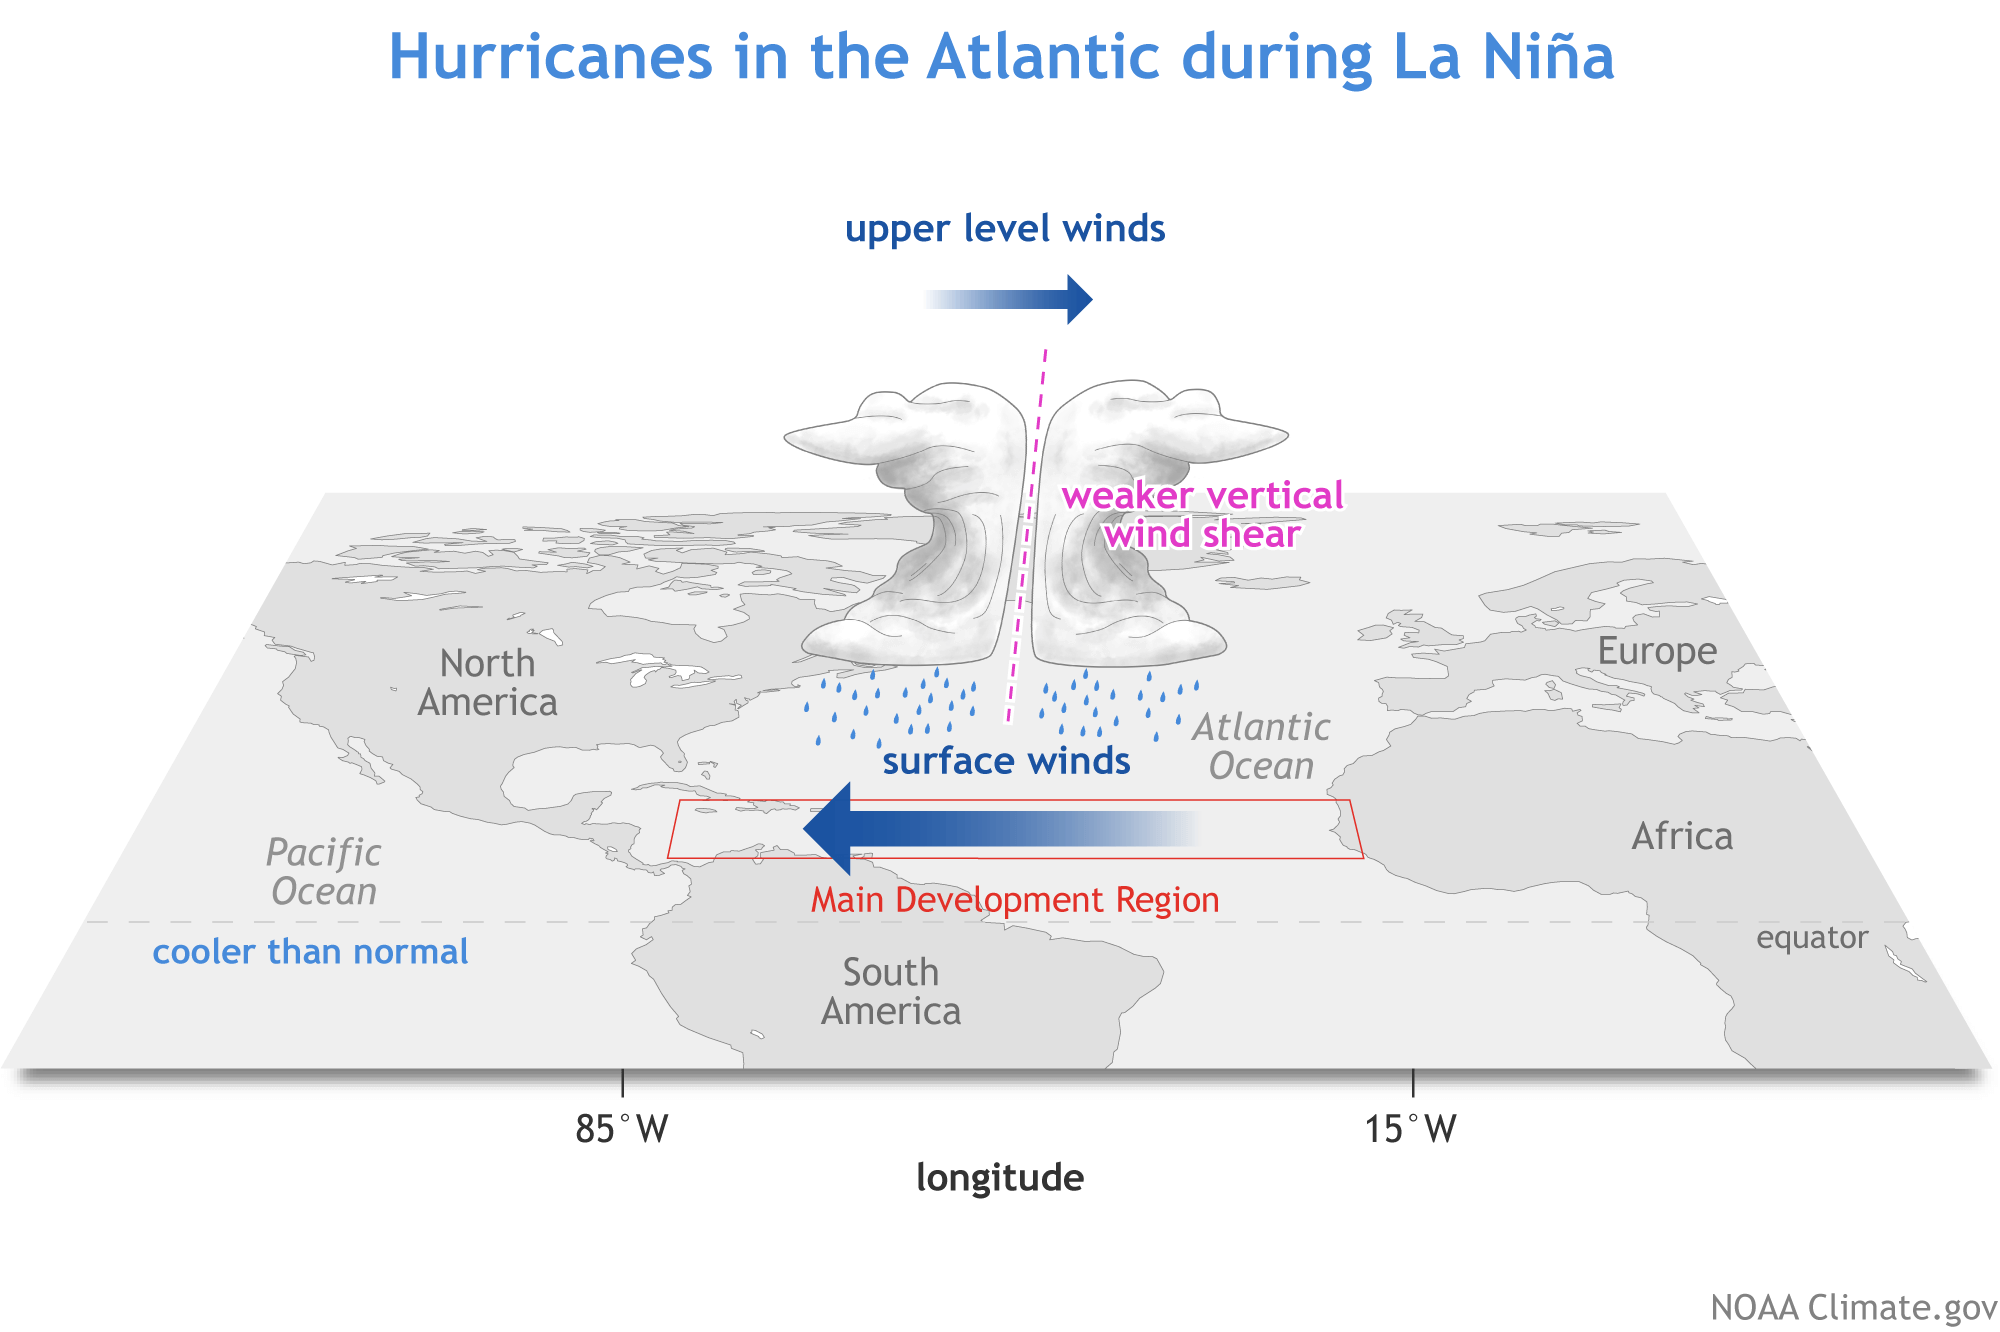
Lower shear means the storms can organize more rapidly and have less interference. Combined with warmer than usual oceans for more energy, it supports easier development and stronger tropical systems.
The latest ocean temperature forecast from the North American NMME system shows the active cold anomalies in the ENSO region. But in the tropical Atlantic Ocean, the forecast shows average ocean temperatures.
An active cold ENSO phase means less wind shear and more atmospheric instability over the Atlantic development region.
We can track the activity by looking at the precipitation forecast from the Canadian CanSIPS model. It does not tell us the number of tropical systems but can show us where more/fewer storms will pass over.
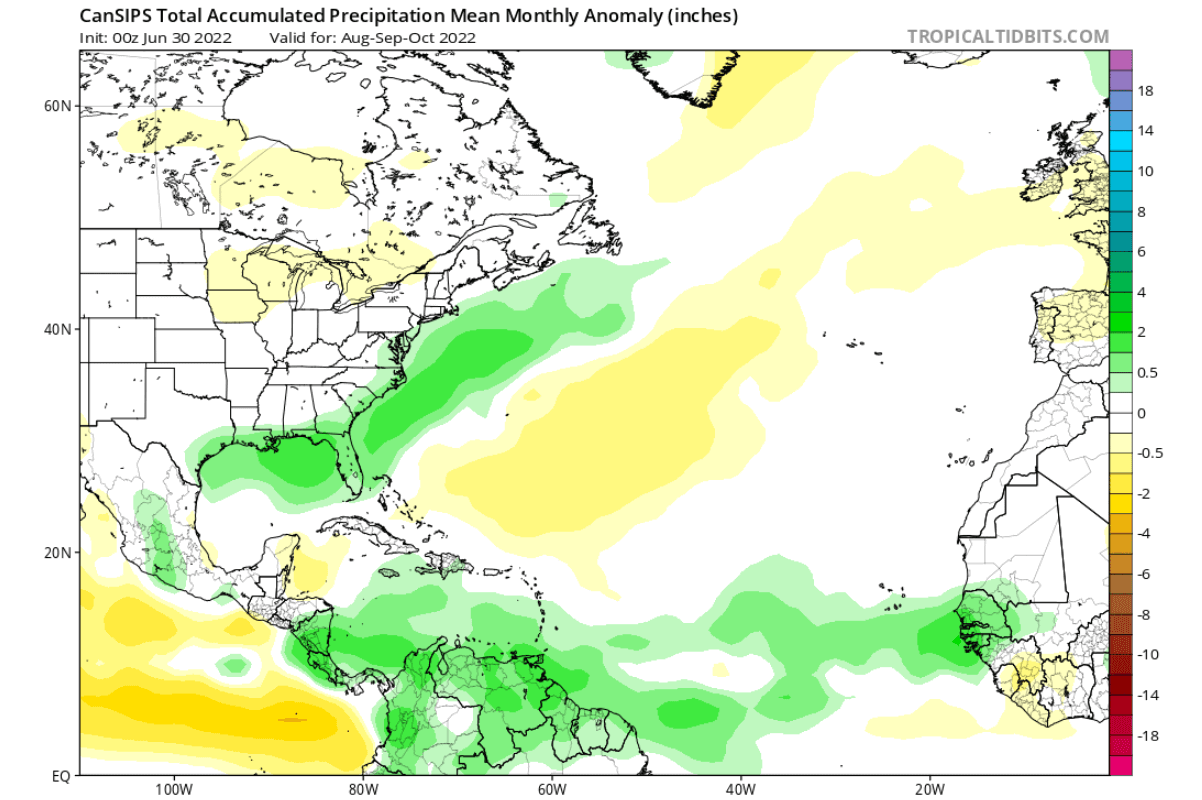
You can see a very obvious trail of more precipitation across the tropical Atlantic, curving up into the Gulf of Mexico and up along the east coast of the United States. It can signal more storms, with favorable conditions to support strengthening and longevity.
Looking at the actual ECMWF forecast for Accumulated Cyclone Energy (ACE), we see an above-normal forecast for the Atlantic hurricane season. It can mean either a higher number of medium-power systems or a few major hurricanes that can quickly boost ACE.

Accumulated cyclone energy (ACE) is a metric that expresses the energy of a tropical cyclone during its lifetime. We can combine the total energy from all systems to compare different seasons and estimate their activity. But this does not mean much when it comes to landfalls.
A hurricane season with low total ACE can have 2-3 hurricane landfalls in the United States. On the other hand, a season with high ACE can have a higher number of storms that mainly stay out in the open waters.
A more direct forecast from ECMWF below shows enhanced activity (red) in the Gulf of Mexico. It also shows an increased frequency of tropical storm events along the east coast of the United States.
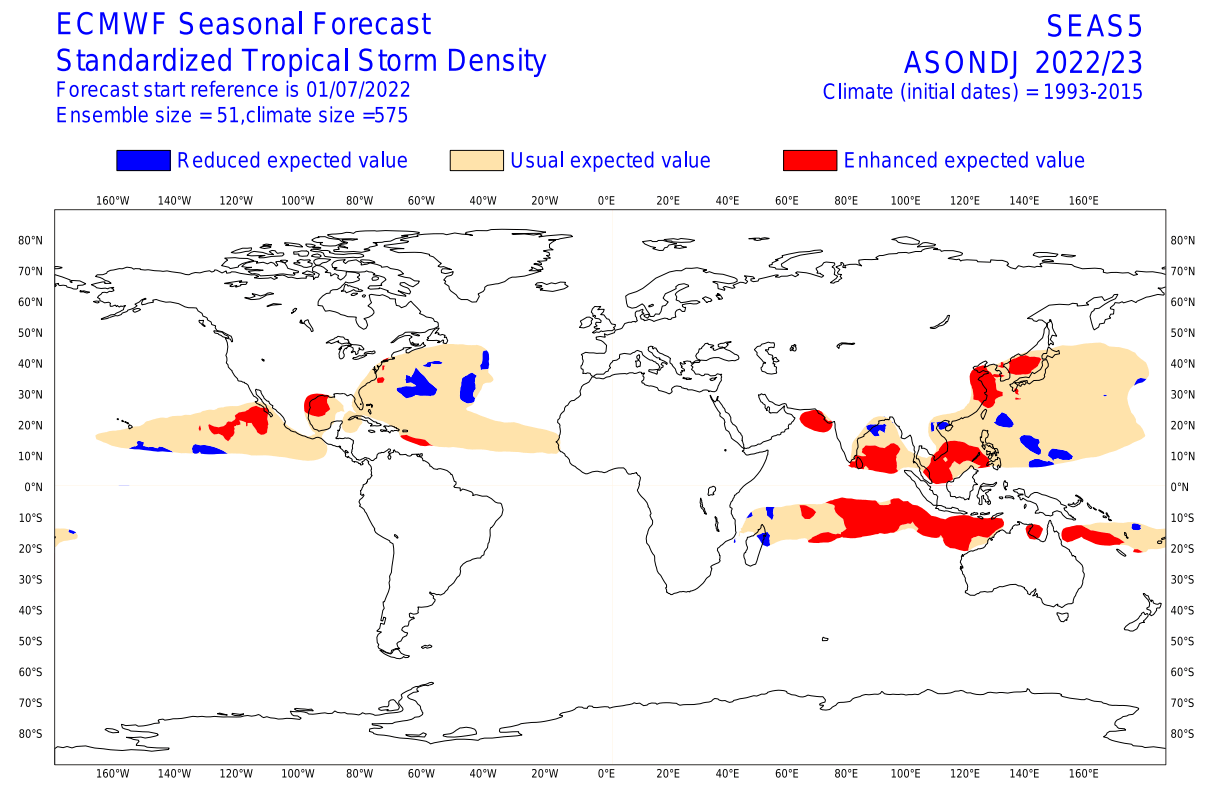
Image by ECMWF
Based on the state of the ocean and the atmosphere, we can see potentially above-normal activity during the peak part of the hurricane season. Historical data and seasonal model forecasts confirm this development, increasing the confidence for an active hurricane season.
It is impossible to say at this point how many landfalls we will see on the coast of the United States. But with a higher number of tropical systems, the chance of landfall increases.
We have published a dedicated Atlantic hurricane season forecast, which we will link at the bottom of the article.
We will keep you updated on the global weather development, so make sure to bookmark our page. Also, if you have seen this article in the Google App (Discover) feed, click the like (♥) button to see more of our forecasts and our latest articles on weather and nature in general.
SEE ALSO: