LATEST UPDATE March 6th: The Stratospheric Warming is now underway, with the latest forecasts showing a Polar Vortex core will bring unseasonably cold air into the United States and eastern Canada later next week
New forecast data has confirmed a Stratospheric Warming event set to unfold in mid-February. This high-energy event will heavily destabilize the Polar Vortex, disrupting the northern circulation. While these events typically signal an Arctic outbreak period, the 2026 transition is facing an atmospheric interference that is complicating the late-winter outlook for the United States, Canada, and Europe.
The downward impact of the stratospheric warming will meet a counter-force in the lower atmosphere, clashing with the Madden-Julian Oscillation (a powerful tropical atmospheric wave). This will temporarily shield parts of the central and eastern U.S. from the stratospheric collapse, leading to a period of above-normal temperatures even as the Polar Vortex breaks apart above.
But this atmospheric interference is not expected to be permanent, and the connection between the stratosphere and the surface is forecast to re-establish, potentially opening the door to new rounds of cold air in last third of February and early March over the United States, Canada and parts of Europe.
Polar Vortex: Understanding the High-Altitude Winter Engine
Our main goal is to share weather information, forecasts, and also to explain complex weather phenomena like the Polar Vortex in simple terms for everyone to understand. For this reason, we include a short section explaining what the Polar Vortex is and why it is crucial to monitor its activity.
In simple terms, the Polar Vortex is a broad winter circulation over the northern (and southern) hemispheres. You can imagine the Polar Vortex as a spinning wall over the polar regions, rising from the surface into the stratosphere (over 50km/30 30miles high), trapping the cold polar air inside.
Below is the Polar Vortex schematic, divided into two layers that we monitor each winter: the stratosphere and the troposphere. The first is at a higher altitude, and the second is at a lower altitude. The Polar Vortex extends across both layers, but with a different shape, strength, and impacts.
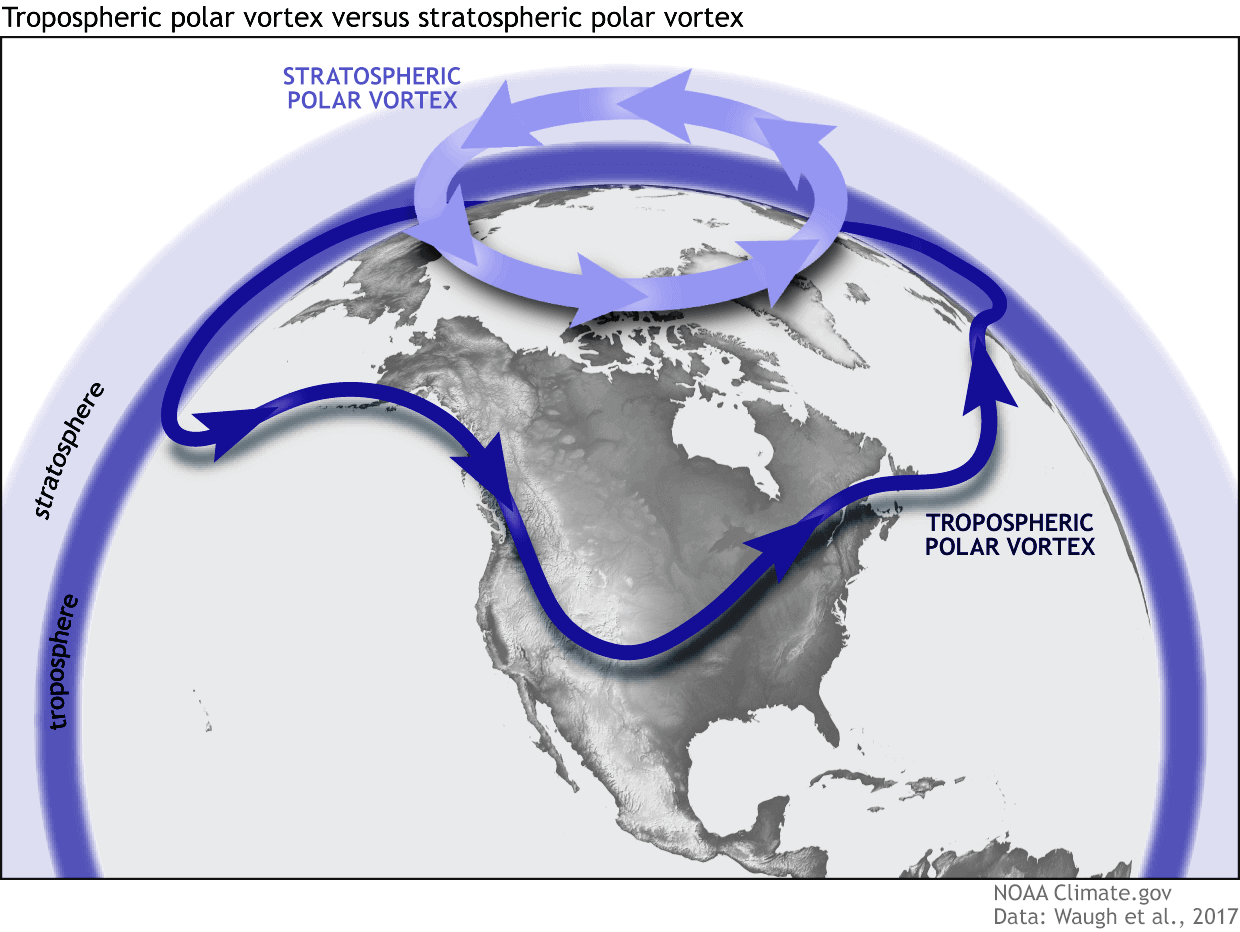
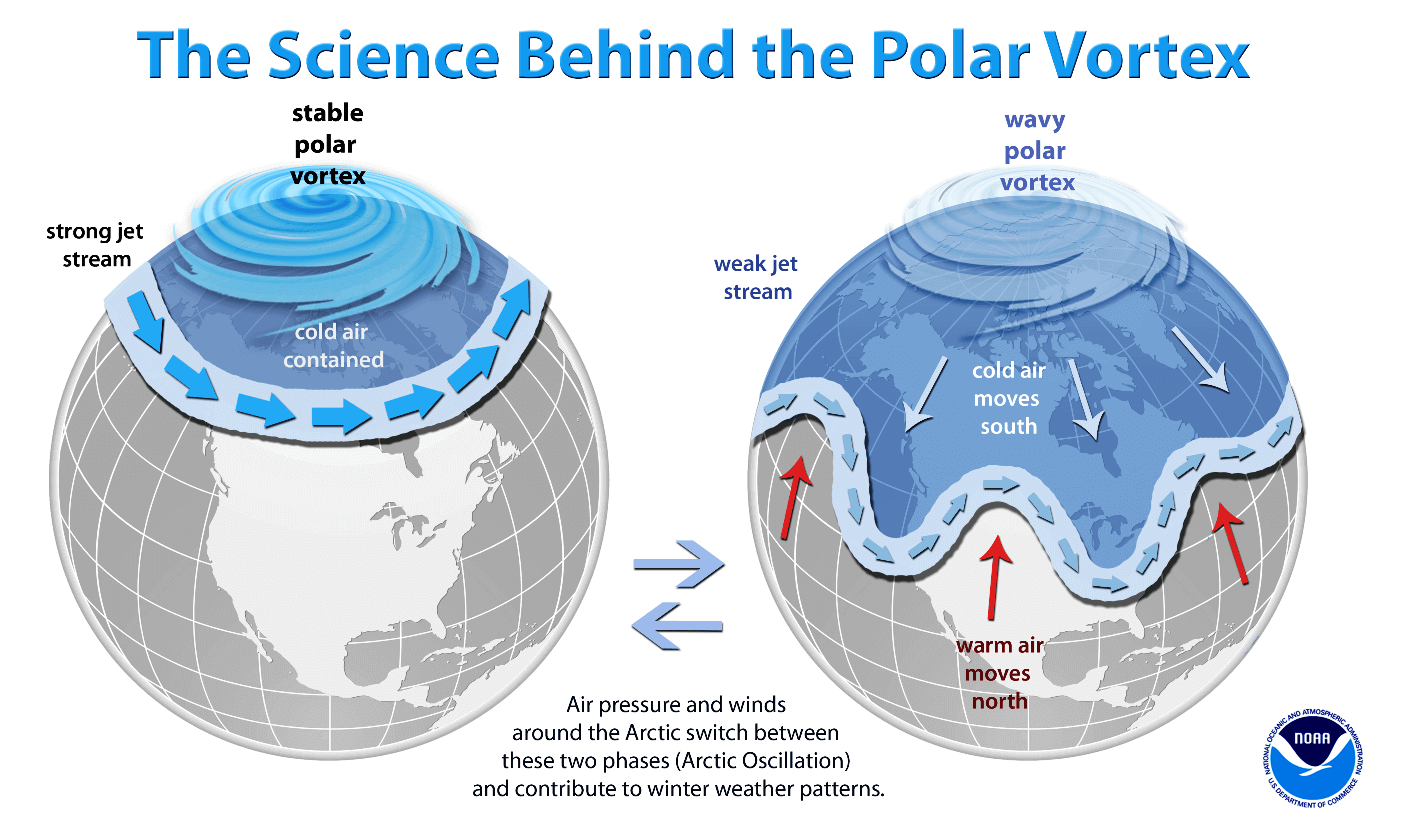
This is why we separate the whole Polar Vortex into an upper (stratospheric) and a lower (tropospheric) part. A strong Polar Vortex locks the colder air into the polar regions, preventing it from spilling out into lower latitudes. This creates milder conditions for most of the United States and Europe.
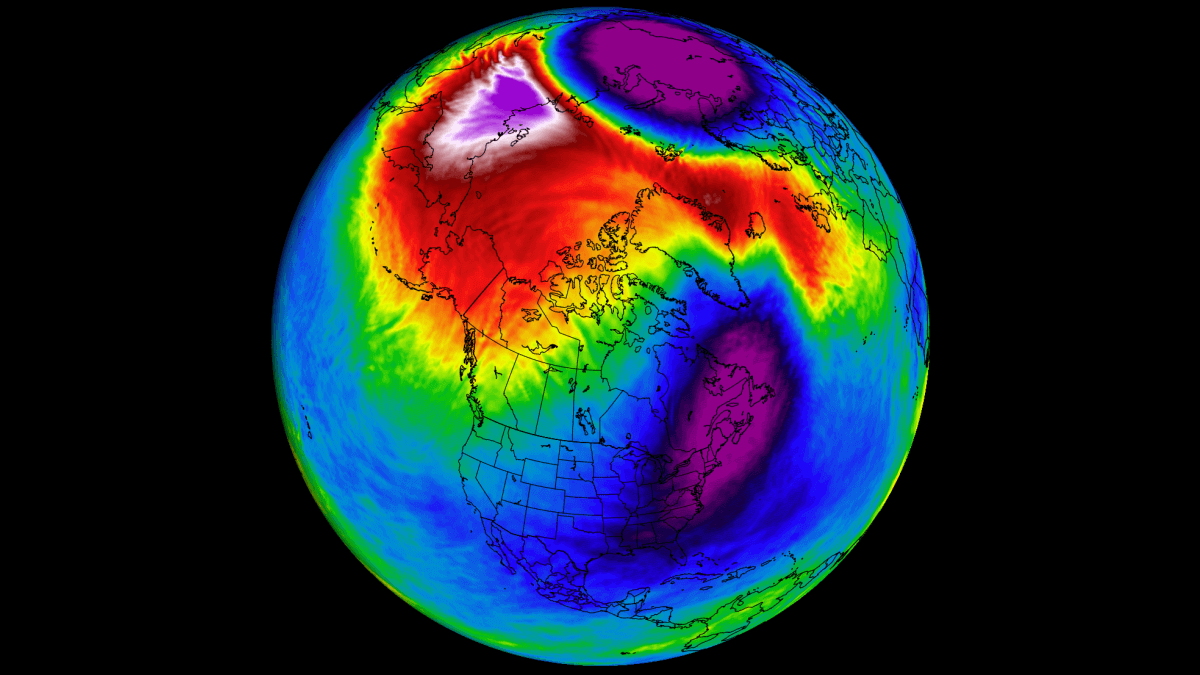
But when the Polar Vortex is disrupted or collapses, it can no longer contain cold air, releasing it outward toward the mid-latitudes. This allows the cold air to spill into the United States and other mid-latitude regions. Below is an example from NOAA of how a disrupted Polar Vortex releases cold polar air into the United States or Europe.
If you like cold winter weather across the United States, Canada, or Europe, this weak/disrupted Polar Vortex is exactly what you want to see. But a disrupted Polar Vortex does not guarantee cold in every single area of the mid-latitudes.
The disruption usually arises from a rise in stratospheric pressure and temperature, known as a Stratospheric Warming (SSW) event, or from other dynamics.
To show the Polar Vortex in its true form, we produced a high-resolution video below that reveals its 3D structure. This video shows the disruption of the Polar Vortex structure from a Stratospheric Warming event over the coming days.
The start of this Polar Vortex disruption phase already comes with another round of colder air over parts of the United States, but with above-normal temperatures also expanding over North America.
A Disrupted Core: Tracking the Current Polar Flow into North America
When analyzing the Polar Vortex in the stratosphere, we like to use simple maps showing pressure and temperature at that level, and also graphs that show the wind strength around the Polar Vortex. This provides insight into its current state and its potential influence on lower levels.
Below is the latest analysis and forecast of the mid-stratospheric winds around the Polar Vortex. Lines show the most recent forecasts, which indicate a clear and continuous weakening of the stratospheric Polar Vortex.
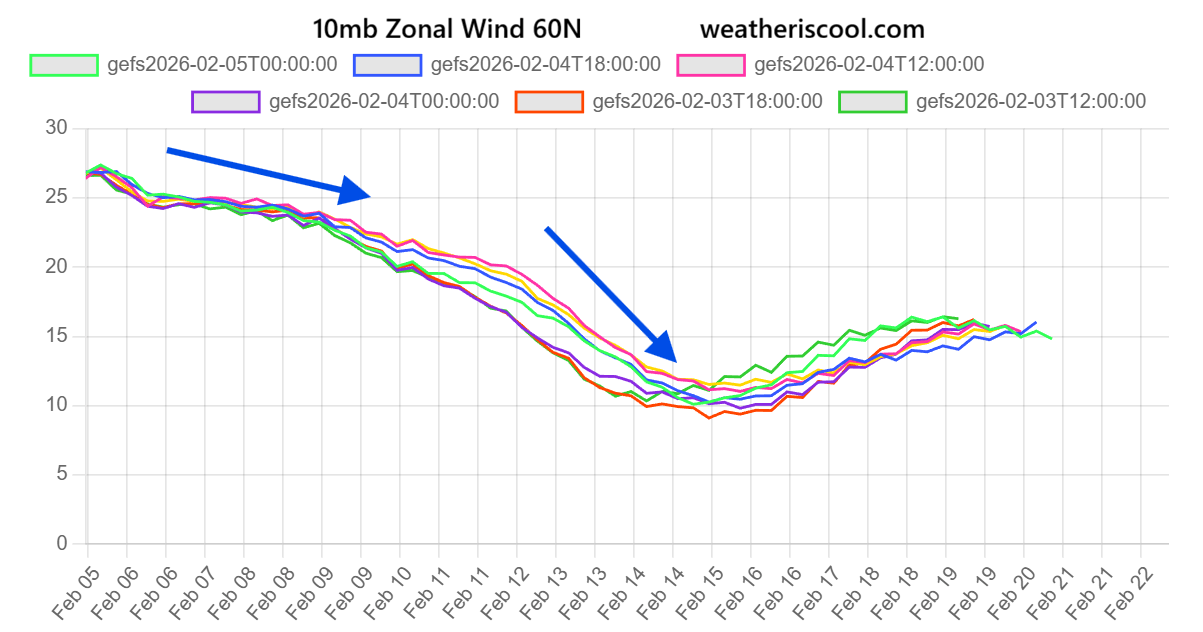
The main weakening is around the 15th, but we are already entering a prolonged seasonal weakening of the Polar Vortex. This is powered by a stratospheric warming event.
Below is the latest analysis for the mid-stratosphere at the 10mb level (30km/18.5miles height). You can already see a compressed, elongated Polar Vortex, which is under attack by two strong stratospheric high-pressure areas. This continues to hold the polar Vortex core over North America in this early phase of the event. Image by weatheriscool.com
This is the onset of the sequence of events that will weaken and disrupt the Polar Vortex, along with the stronger stratospheric warming wave.
The forecast image below shows the pressure anomaly forecast for the lower stratosphere at the 50mb level (20km/12.4 miles). You can see two high-pressure areas, creating a split Polar Vortex core, with one side being pushed into North America. This supports a northerly flow at surface levels into the United States.
For these events, we like to use the analogy of a balloon, which also elongates if we squeeze it or forms two bulges.
You can see this deformation in the Polar Vortex 3D analysis below. High-pressure areas with warming are compressing the Polar Vortex, elongating its structure. This causes the Polar Vortex to push its lower foot into North America, allowing a strong northerly flow with cold air to spill into the eastern United States, Canada, or parts of Europe.
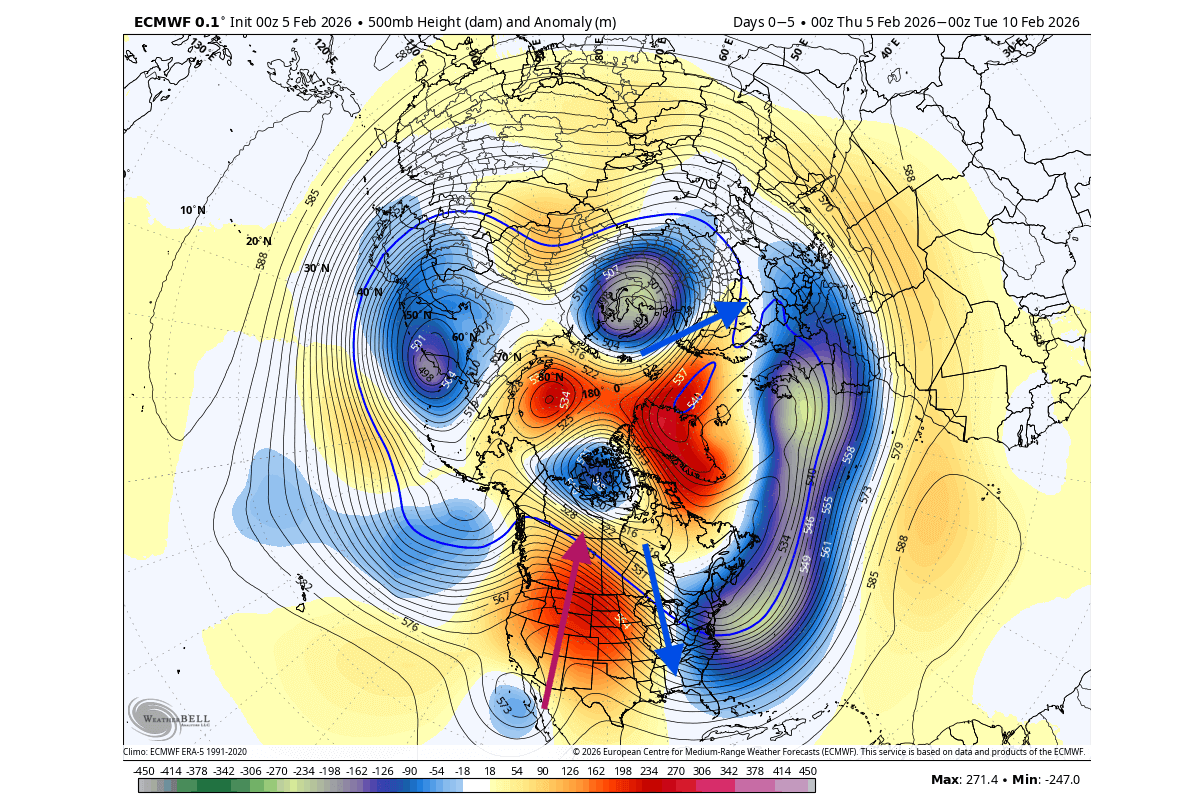
If we now look at the lower pressure levels, the day 1-5 forecast below shows a disrupted Polar Vortex pattern, reflecting the 3D analysis above. The main low-pressure area sits from the eastern United States towards western Europe. This allows colder northerly flow into the eastern United States, but holds a milder pattern for western Europe.
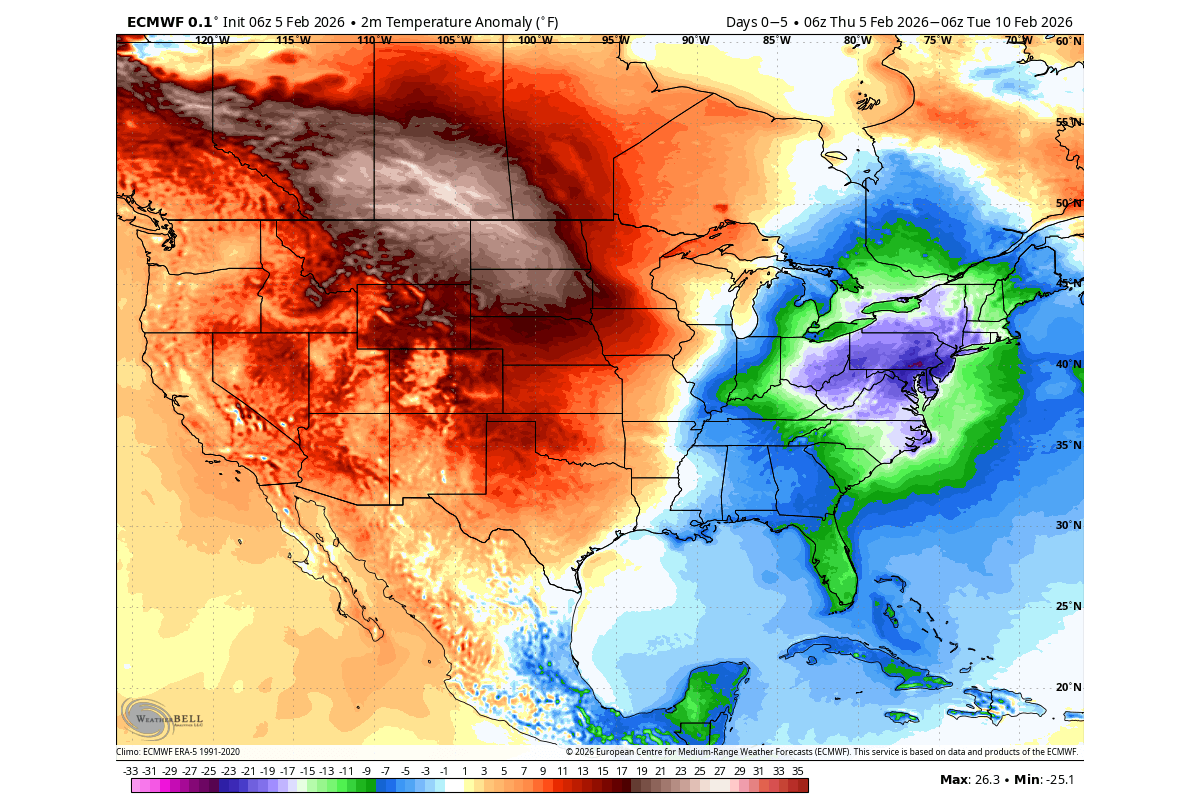
The surface temperature forecast for the next 5 days shows a polar air anomaly over the eastern parts of the United States. Single-digit temperatures are forecast over the Midwest and the northeastern U.S., with lows from -5°F to -10°F. But a high-pressure anomaly in the west brings a strong wave of above-normal temperatures into western and central U.S. and southwestern Canada.
This polar airmass will bring proper winter weather to a large part of the United States. In the image below, you can see the forecast for the Winter Storm Severity Index for days 1-3, based on official NOAA data. It shows the coverage of expected winter weather across the Midwest, the eastern, and the northeastern United States.
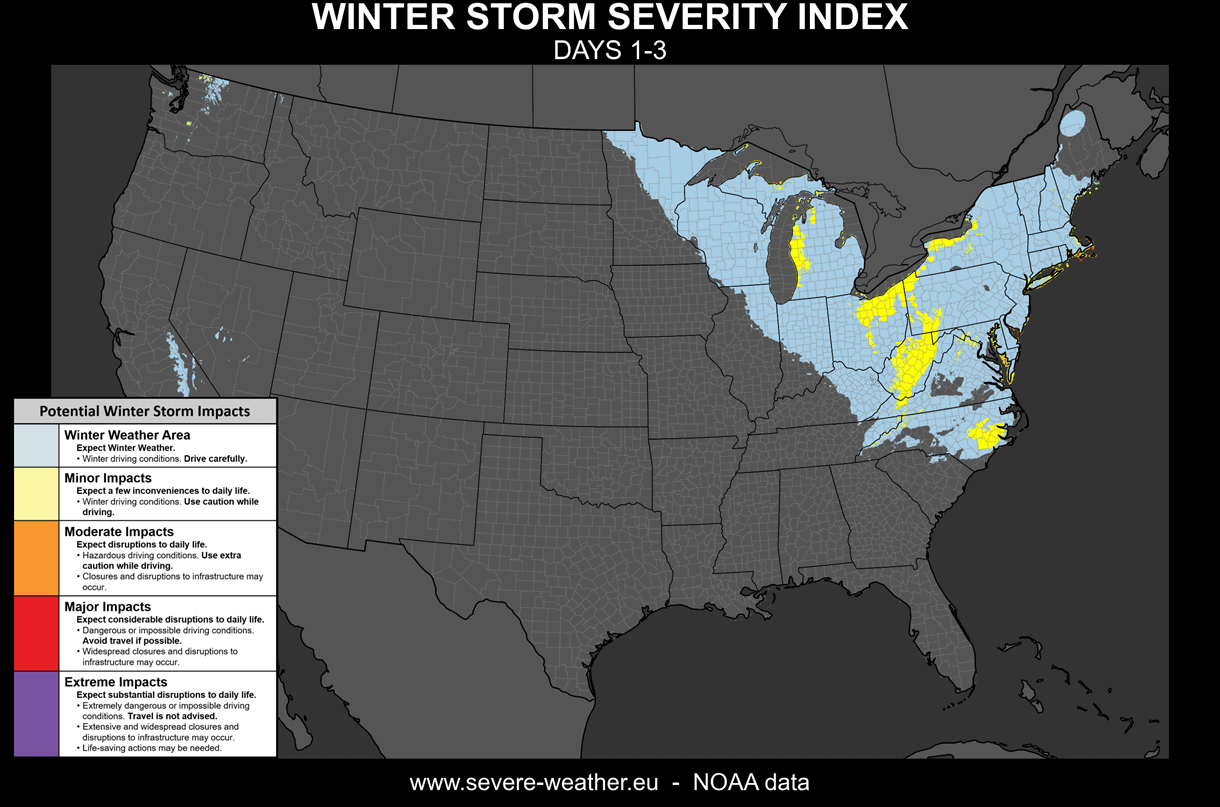
While this index shows combined winter weather impacts with precipitation and strong winds, the actual cold can extend further out.
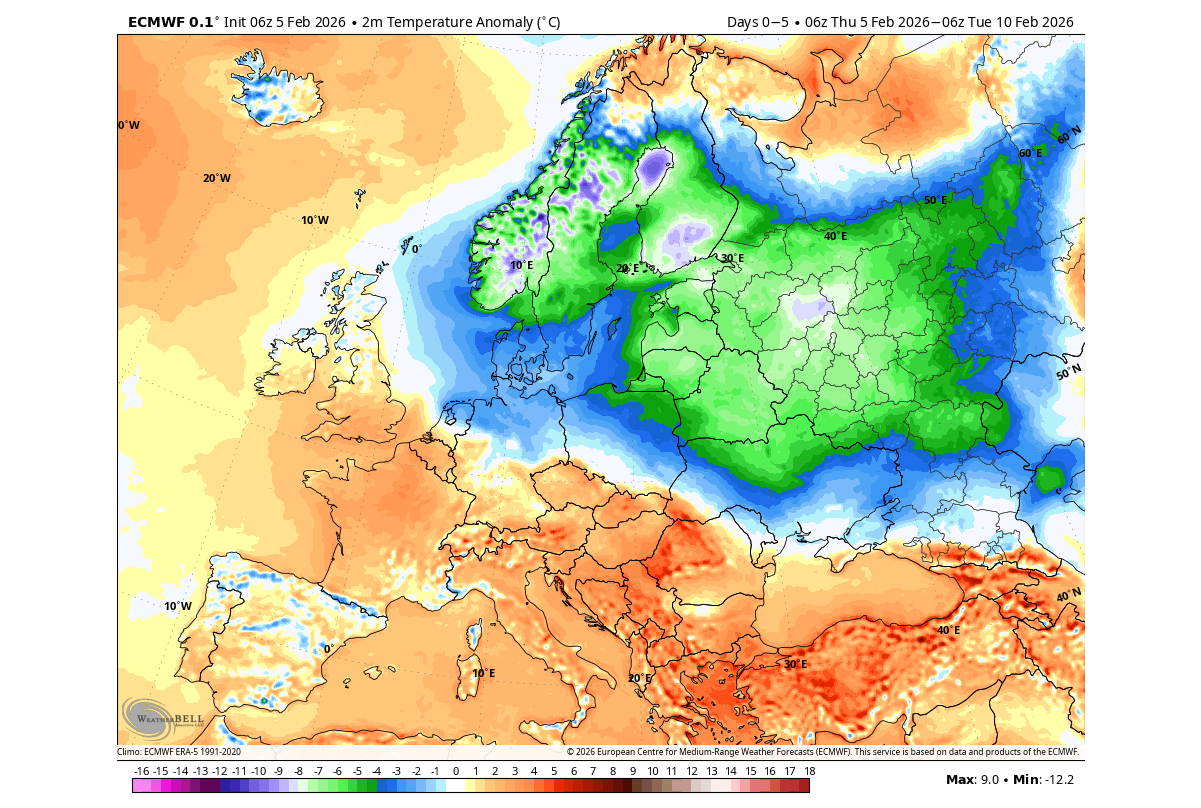
The forecast also shows colder polar air over the northeastern parts of Europe. But a low-pressure system in the Atlantic keeps preventing this cold airmass from moving further towards the central and western parts.
Looking at the second week of February, the cold pattern is forecast to ease off over the eastern United States, with normal to cooler temperatures over the northeast. But an expanding area of high pressure is forecast to bring a mild airmass into the east-central United States and into southern Canada.
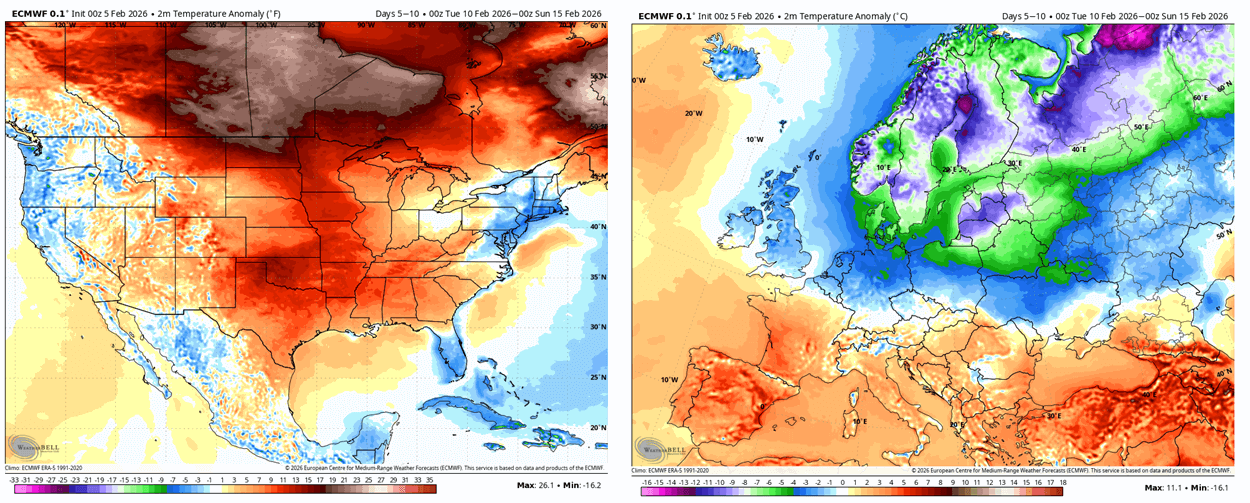
Over Europe, the cold area over the northeast gets another boost from the cold polar airmass. This time, it’s trying to expand into northwestern Europe towards the UK and Ireland, and into north-central parts.
This is linked to the Stratospheric Warming event that will unfold at this time. But, as you will see, the potential outcome is beginning to change across the Northern Hemisphere due to previously undetected pressure interference in the lower levels of the atmosphere.
The Mid-February Event: A Stratospheric Warming Phase Begins
A stratospheric warming event is a rise in stratospheric pressure and temperature, which disrupts the Polar Vortex. These events can collapse and split the Polar Vortex, creating a major weather shift in the surface levels, but can have varying effects across the hemisphere.
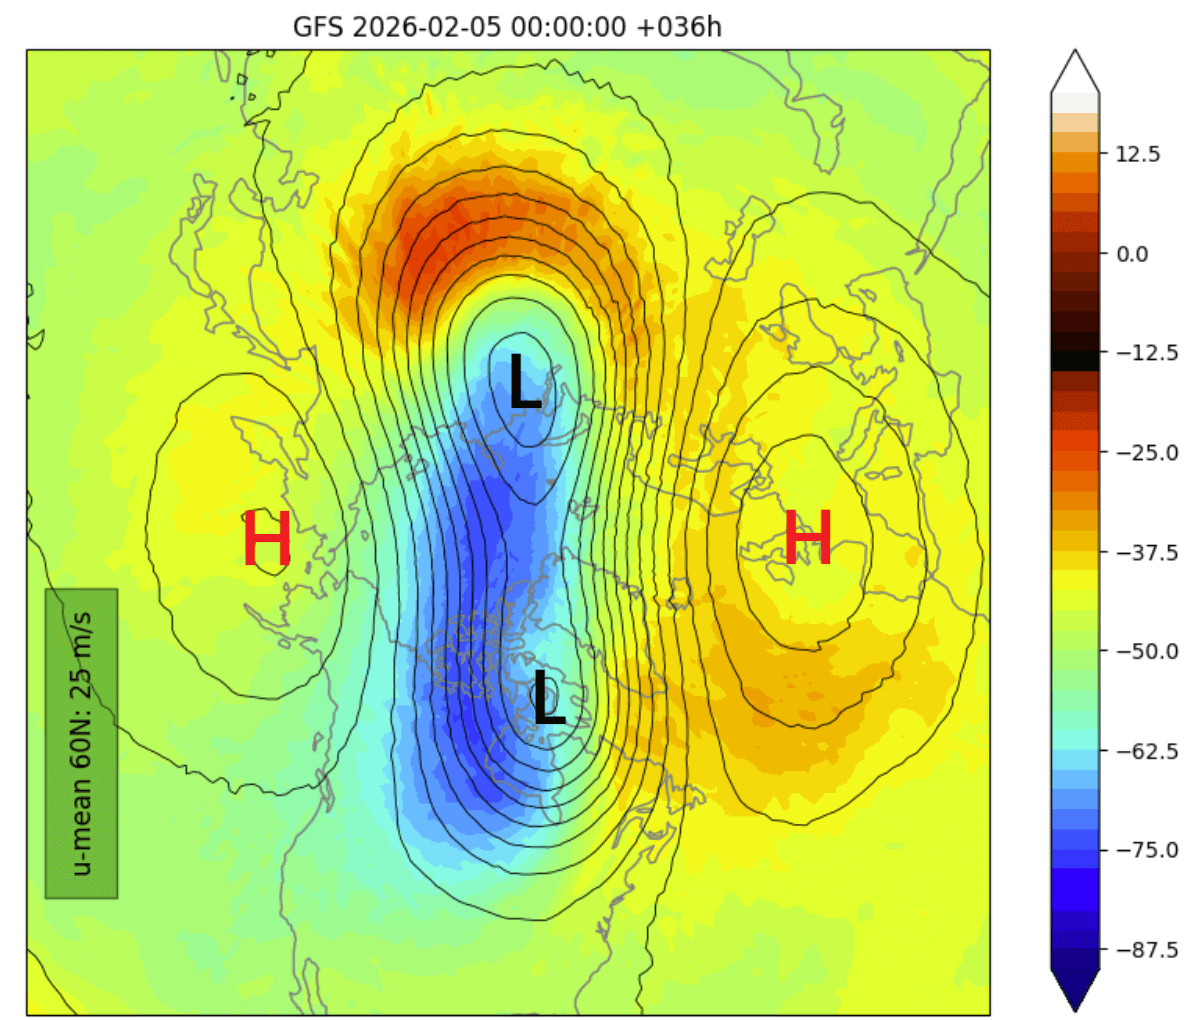
Below is the day-10 pressure and temperature forecast in the stratosphere at the 10mb level (30km/18.5miles height). You can see two low-pressure areas (L) of the Polar Vortex, split apart by the strong warming wave and a stratospheric high-pressure anti-vortex (H).
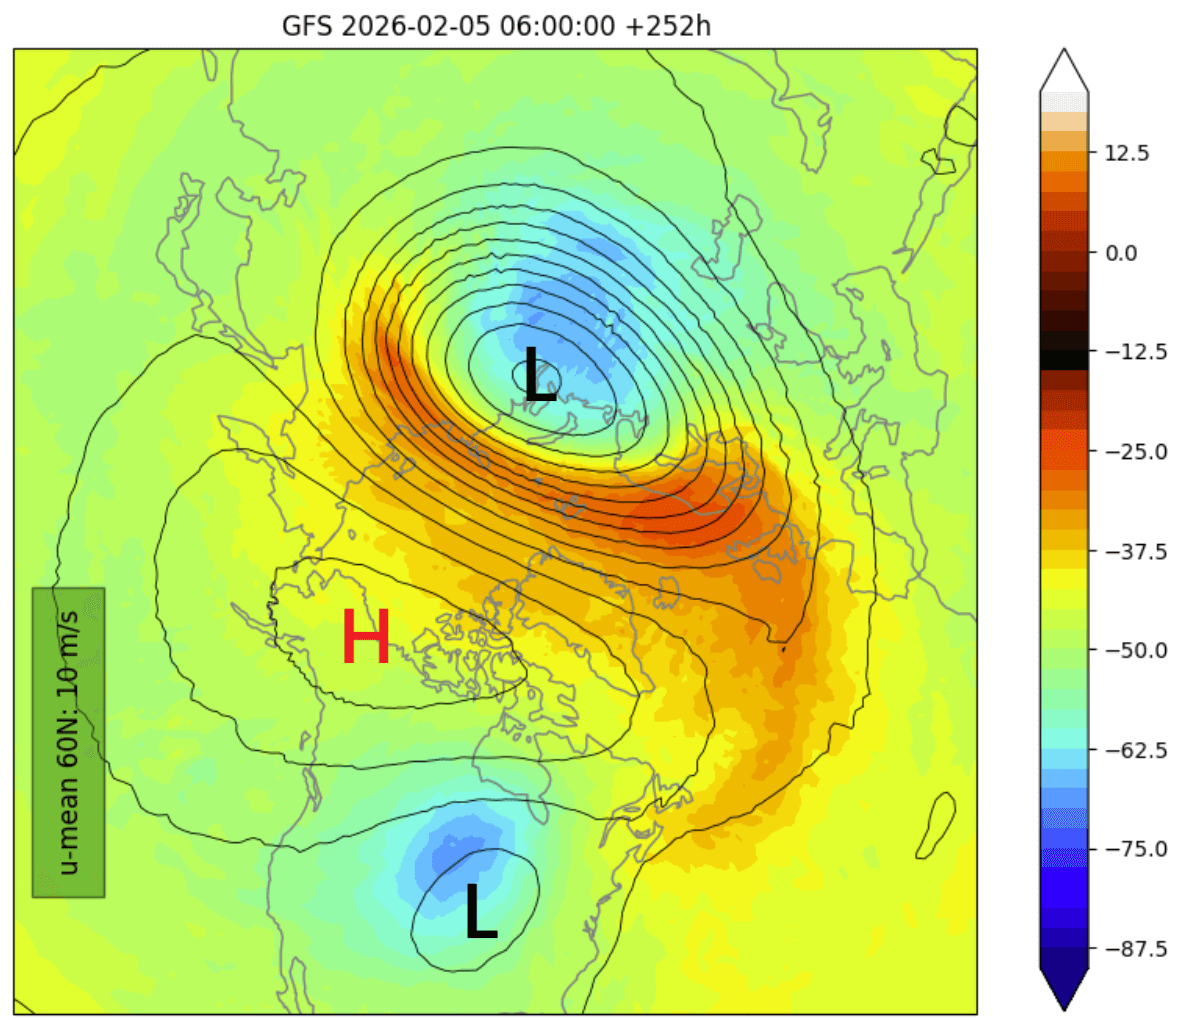
The early forecasts were calling for both cores to be of similar strength, which would have more direct implications on the lower levels. But as the forecast gets nearer and we gather more data, we now observe a displacement of the main Polar Vortex core into the eastern hemisphere.
The real extent of the stratospheric warming event is usually revealed by the temperature anomaly, which shows just how much warmer the stratosphere has become. Below is the day-10 forecast for the same 10mb level, and it shows a strong warming wave, with temperatures peaking near 40 degrees C above normal.
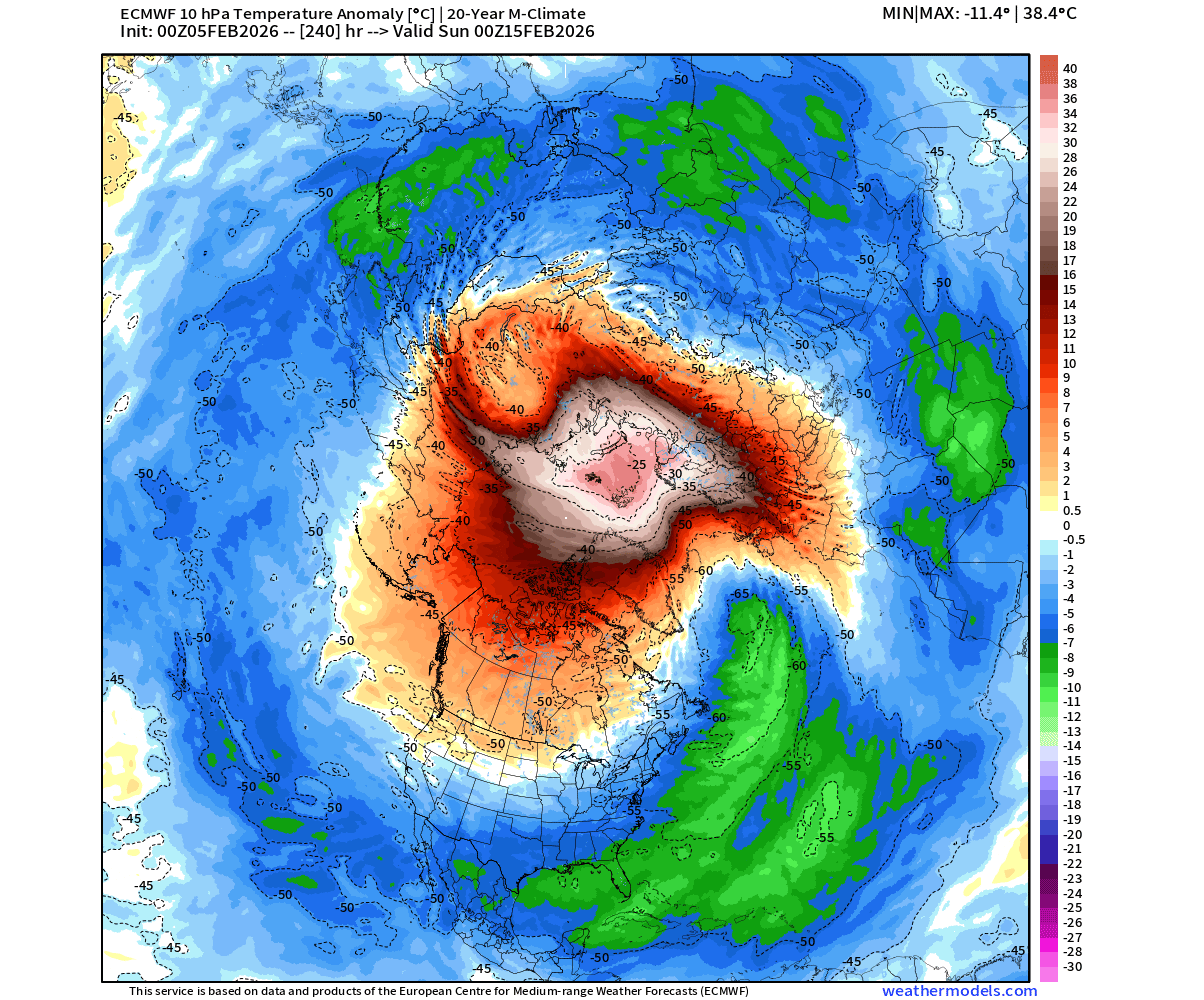
The pressure and temperature anomalies in the stratosphere show a proper, strong stratospheric warming event, but without a wind reversal at this phase of the event.
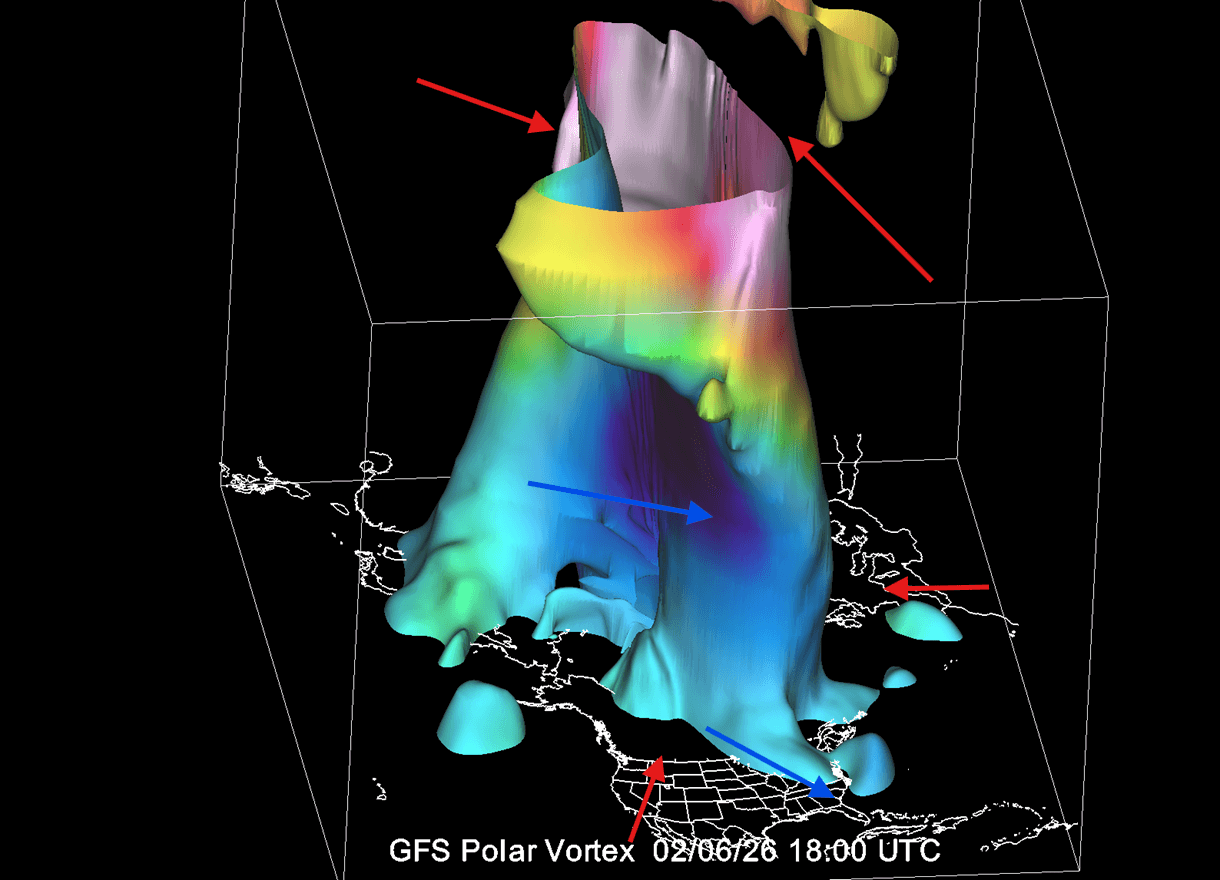
Below is a 3D forecast of the Polar Vortex for mid-February, during this stratospheric warming event. You can see a disrupted and split structure of the Polar Vortex with warming waves on top. But notice how one side of the Polar Vortex, despite being split, shows to be fully disconnected over North America. This was not noted in the previous forecasts, and for a good reason.
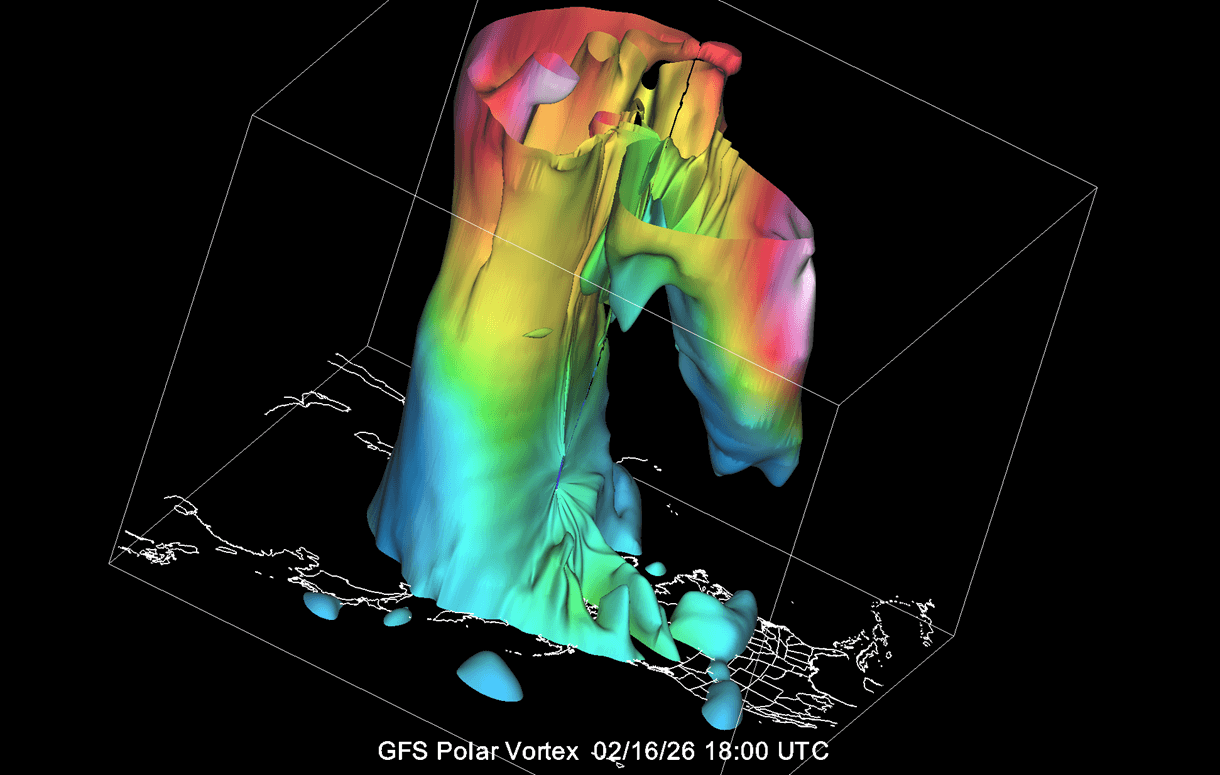
While the stratospheric Polar Vortex is connected to the lower levels, some parts can lose the connection. And usually, the reason is in the lower levels, “denying” the potential downward connections, also known as a “decoupling”.
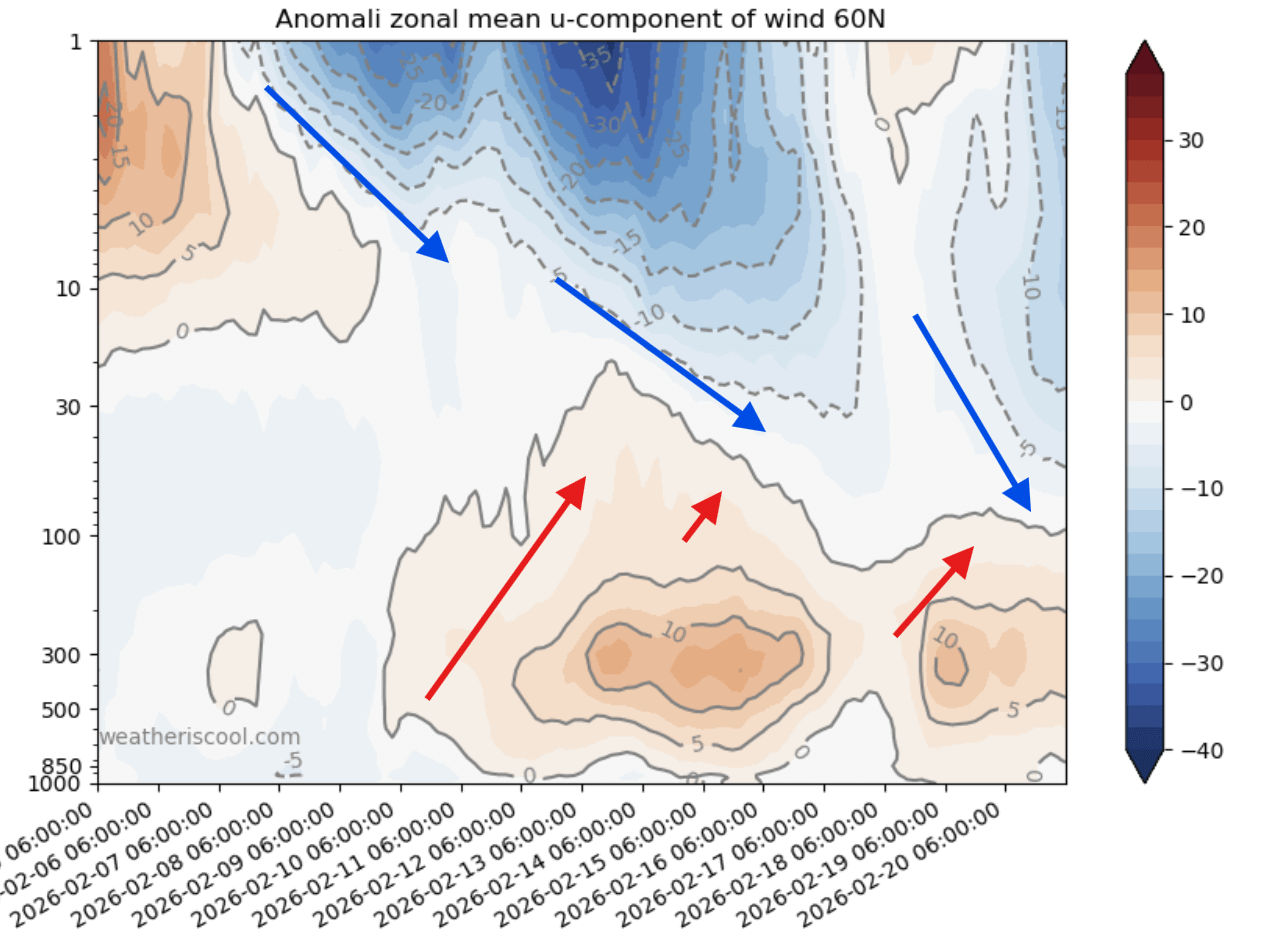
Below is the wind anomaly forecast from the surface up to the top of the stratosphere. You can see the expected stratospheric anomaly creating a wind disruption down from the stratosphere. But as you can see, there is a stronger jet stream in the lower levels, preventing an immediate downward impact of this Polar Vortex disruption.
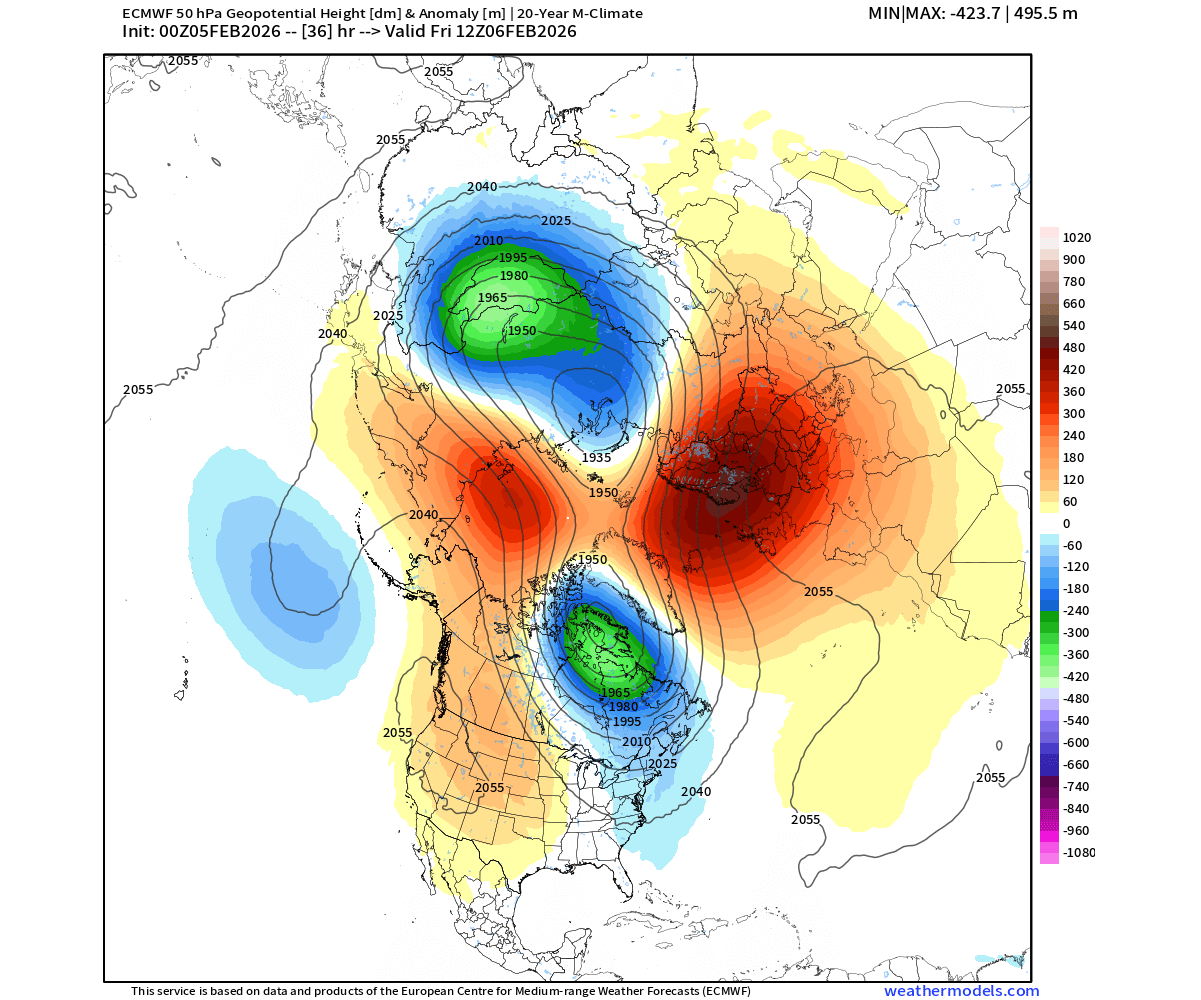
Below is the lower stratospheric pressure anomaly forecast, around the level where both anomalies meet. This reveals the main Polar Vortex core at this level was pushed out into the eastern hemisphere, with a high-pressure anomaly building over North America at this level of the lower stratosphere. This promotes above-normal temperatures over the central and eastern U.S. while allowing cold to still build over western Canada.
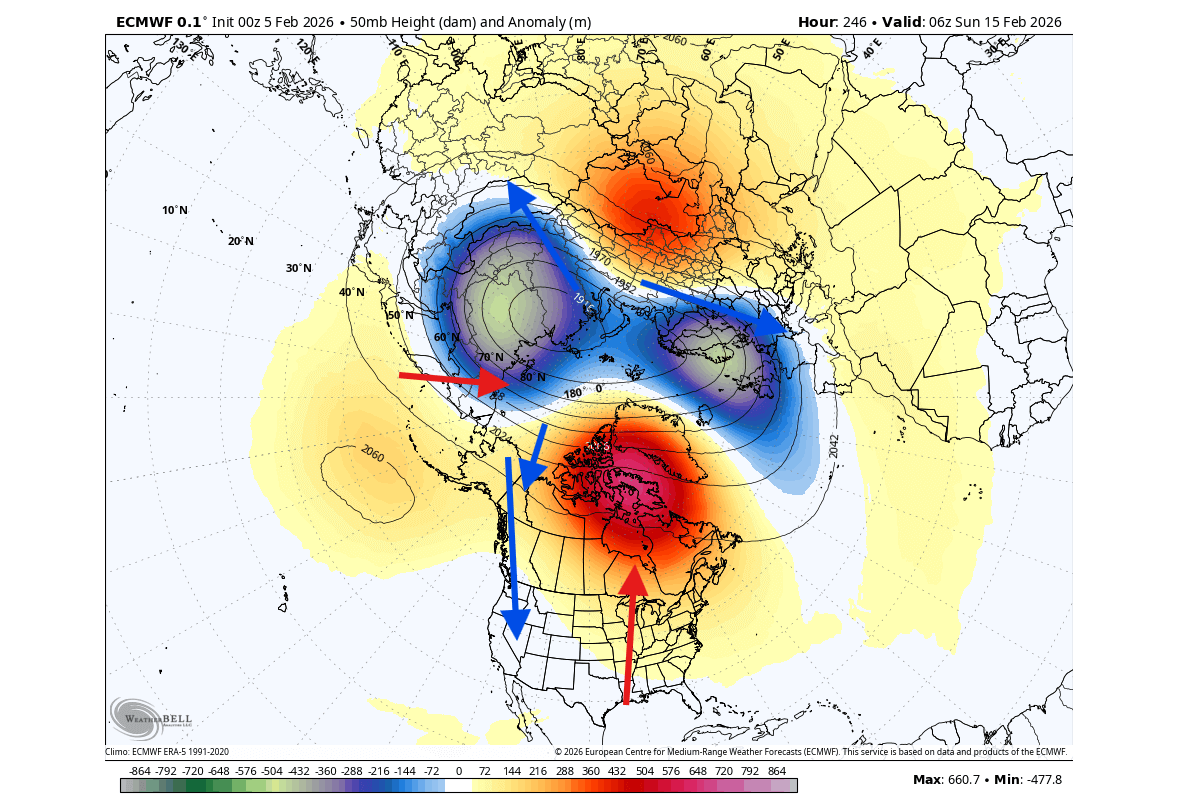
This is something that early forecasts did not show, and it is because of pressure interference from the lower levels, with an anomaly in the North Pacific.
Atmospheric Interference: How the MJO is Colliding with the Stratospheric Warming
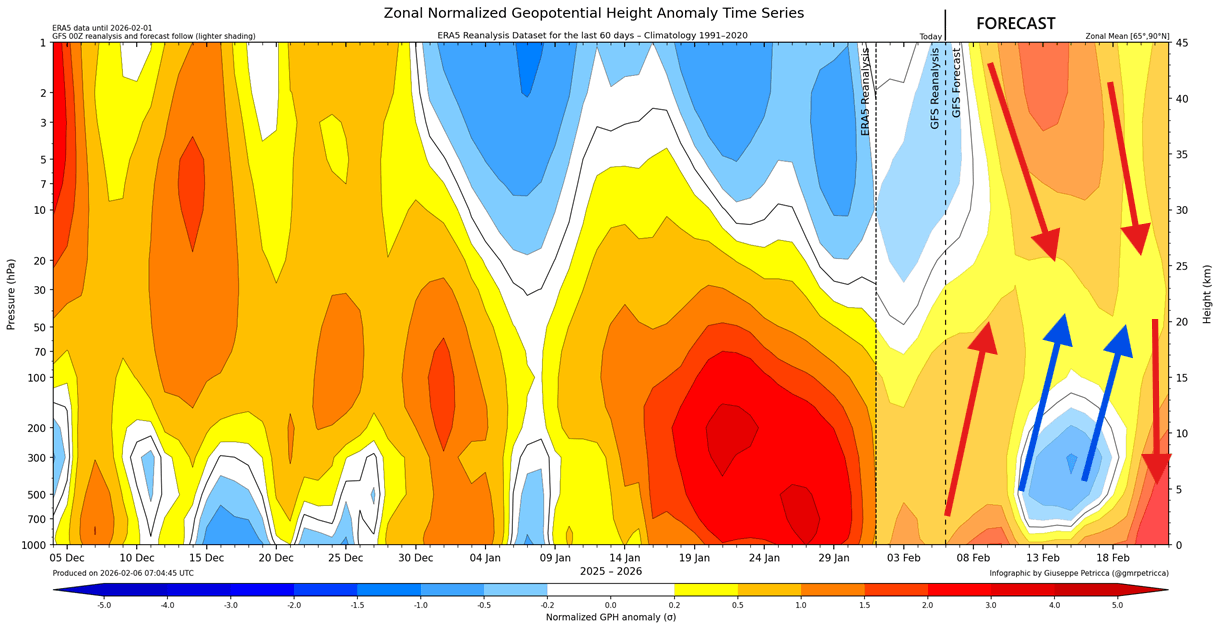
The image below shows a vertical structure of the atmospheric pressure anomalies, from the surface up to the top of the stratosphere. In the GFS forecast part, you can clearly see the stratospheric warming anomaly pushing downwards, but it is met with a low-pressure counter-force in the lower levels, tho not lasting very long. Image by @gmrpetricca
This setup represents a rare configuration that weather models are struggling to resolve in the medium-extended range. The most likely culprit behind this comes from the tropical variability, which drives invisible wave-like features in the atmosphere. The largest and most dominant source of tropical variability is the Madden-Julian Oscillation, known simply as MJO.
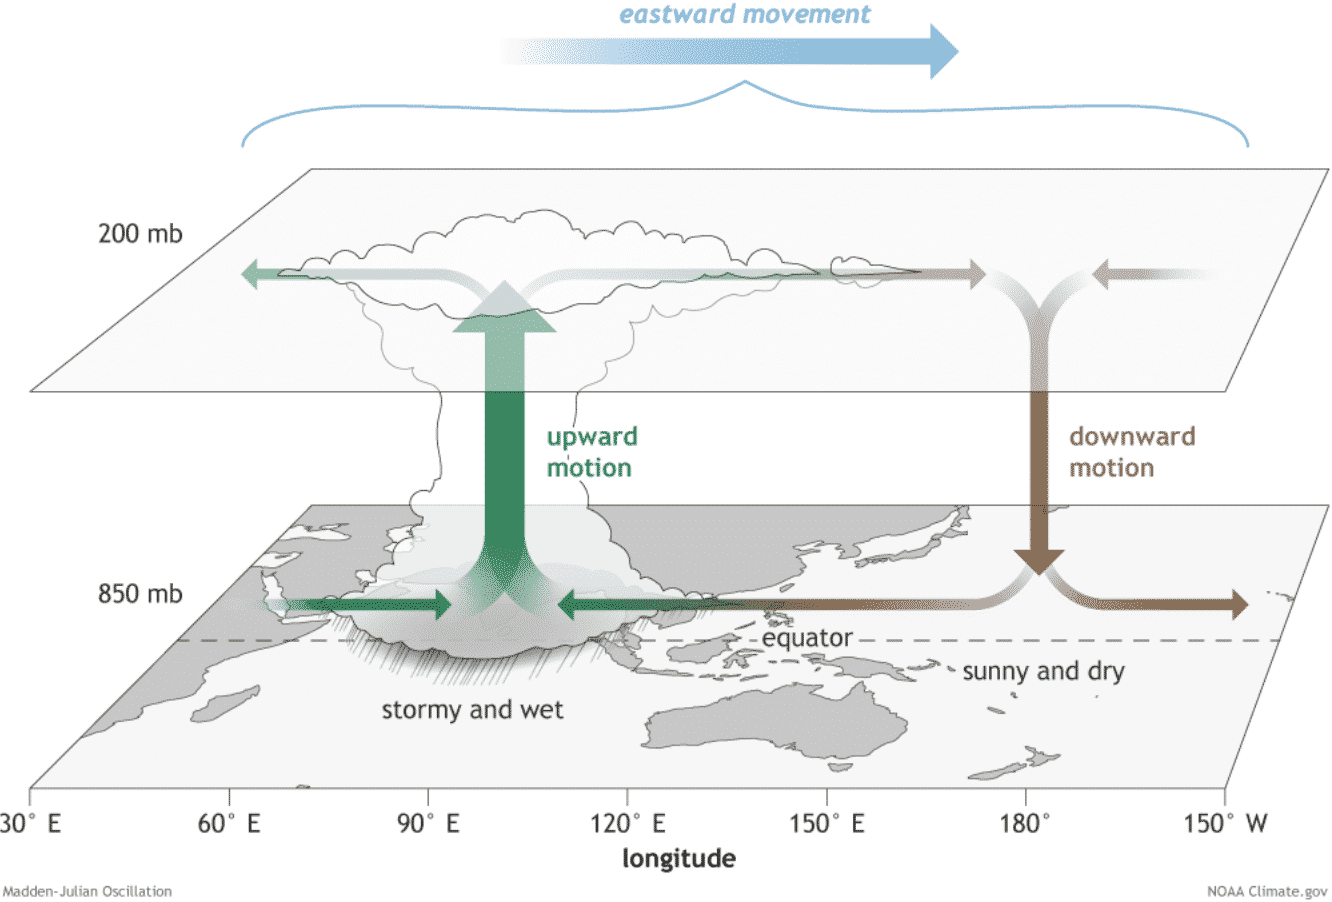
The MJO is a massive eastward-moving disturbance (wave) of thunderstorms, clouds, rain, winds, and pressure anomalies. It works like a “mini-ENSO” and can cause all sorts of atmospheric interference, which the models have a hard time detecting at medium and extended range, as it’s just a wave of storms and clouds.
The MJO consists of two parts: one is the enhanced rainfall (wet) phase, and the other is the suppressed rainfall (dry) phase. The graphic below shows the basic dynamics of this wave. Increased storms and rainfall on one side and reduced storms and drier weather on the other side. This impacts the atmospheric motion and energy transfers on both hemispheres.
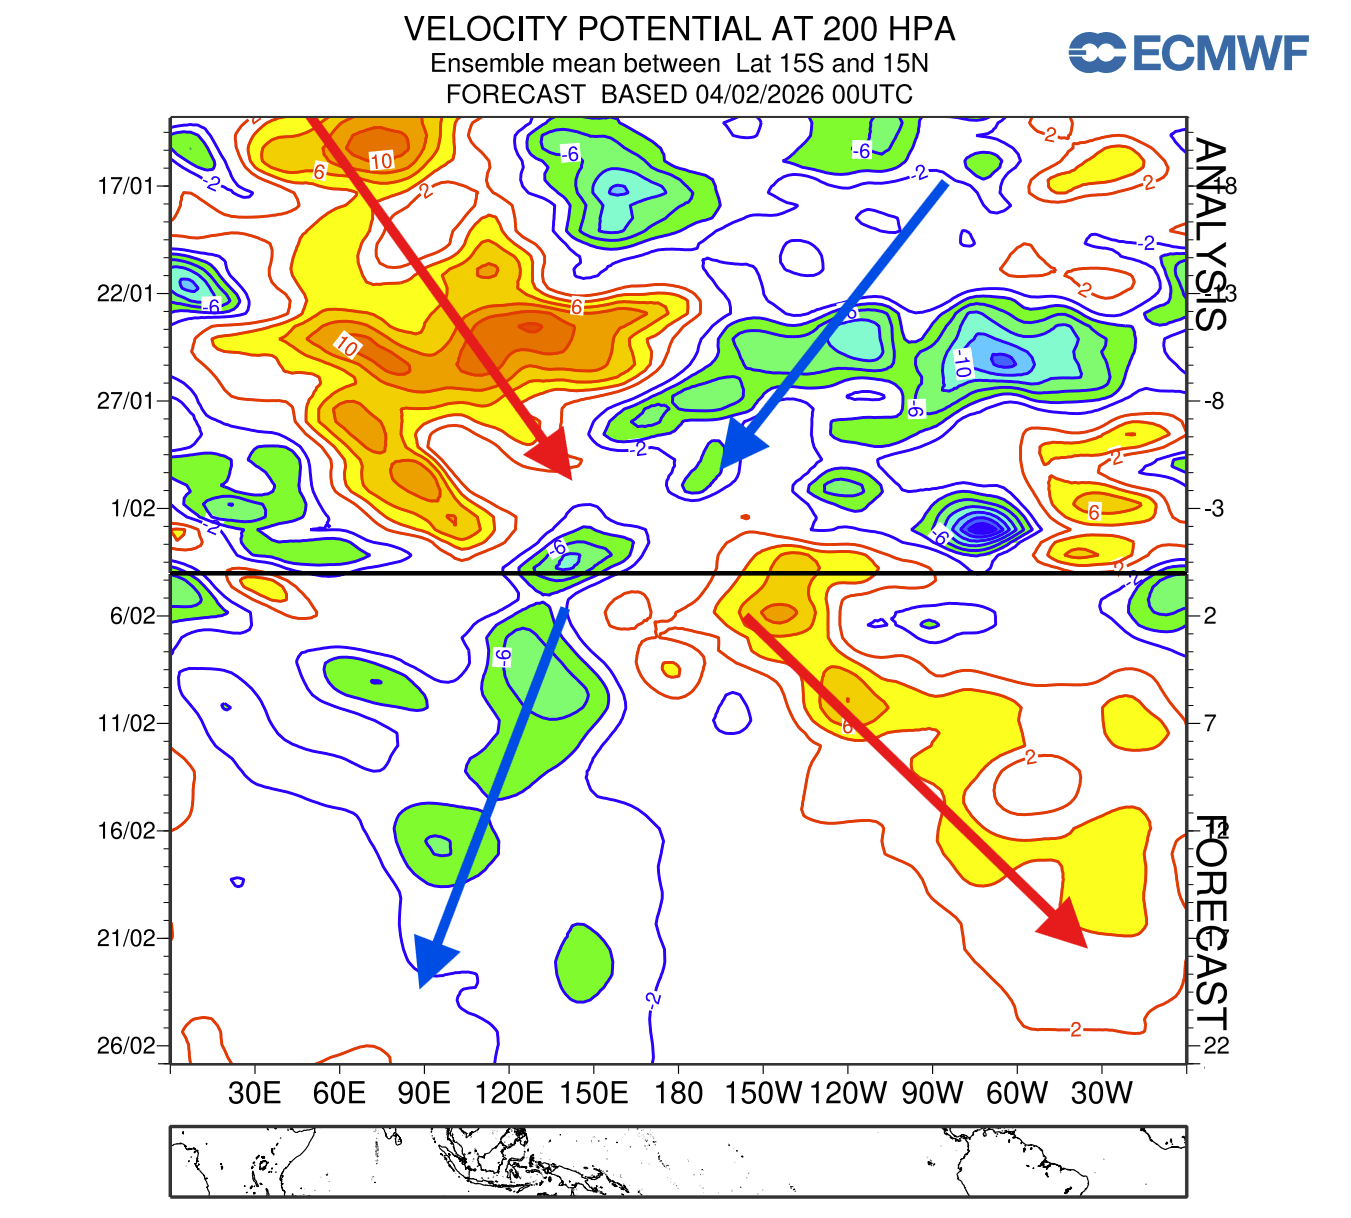
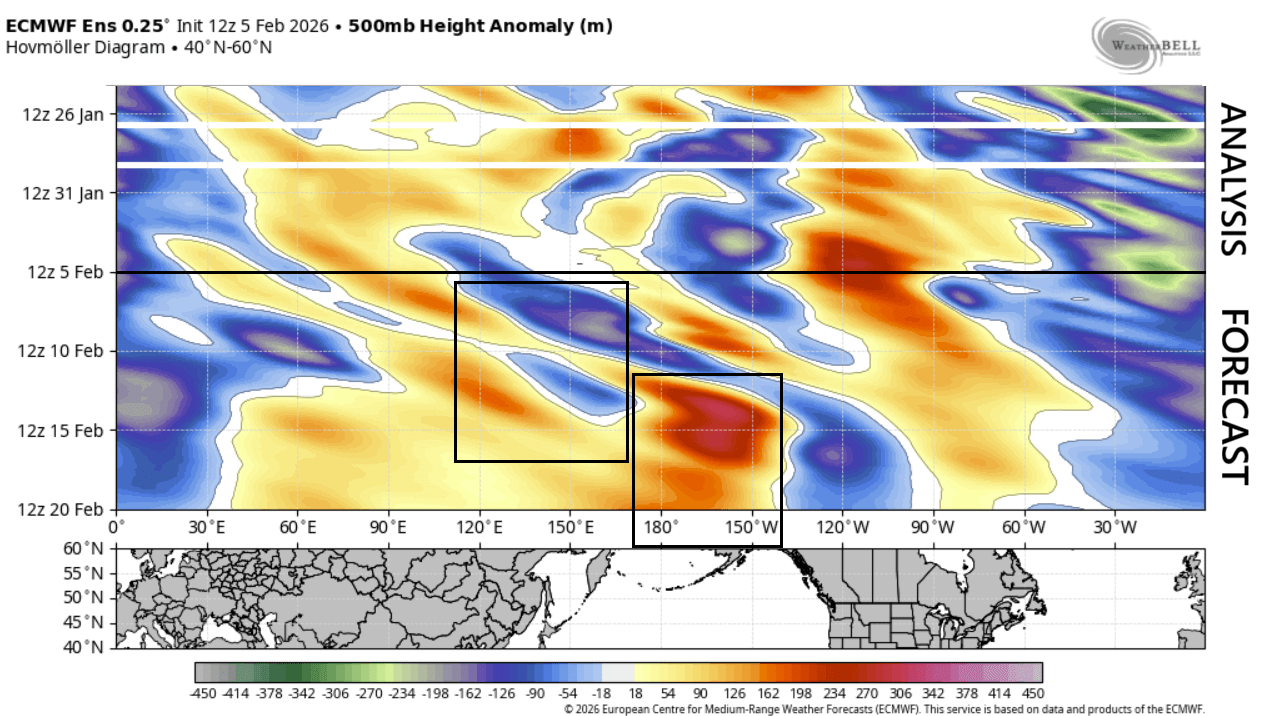
We can track the MJO wave by looking at the larger-scale air movement and the areas where the air is rising and where it is subsiding. The ECMWF forecast below shows just that: a wet phase (cold colors) and the dry phase (warm colors). You can see the cross-pattern from the analysis into the forecast, showing a clear MJO progression at the exact time of the stratospheric warming.
This final effect is more clear when we look at the pressure anomaly analysis and forecast for the mid-latitudes. You can see the progression of pressure waves, which result in a high-pressure anomaly in the North Pacific. That drives a deep low over the western United States, countering the stratospheric warming effects during this period.
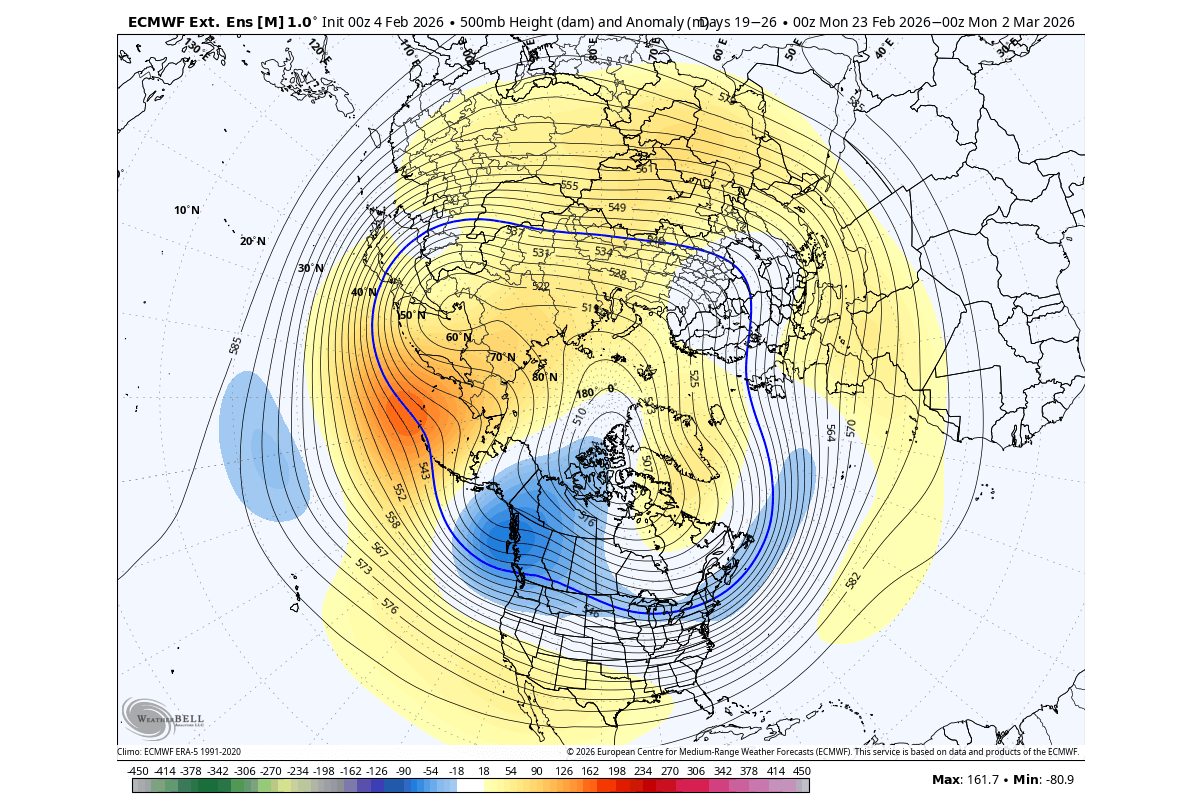
The lower atmospheric interference can be seen in the day 10-15 pressure anomaly below, from the ECMWF ensemble forecast. While a blocking high over northeastern Canada and Greenland persists, a strong high-pressure area in the North Pacific maintains a low-pressure trough over the western United States.
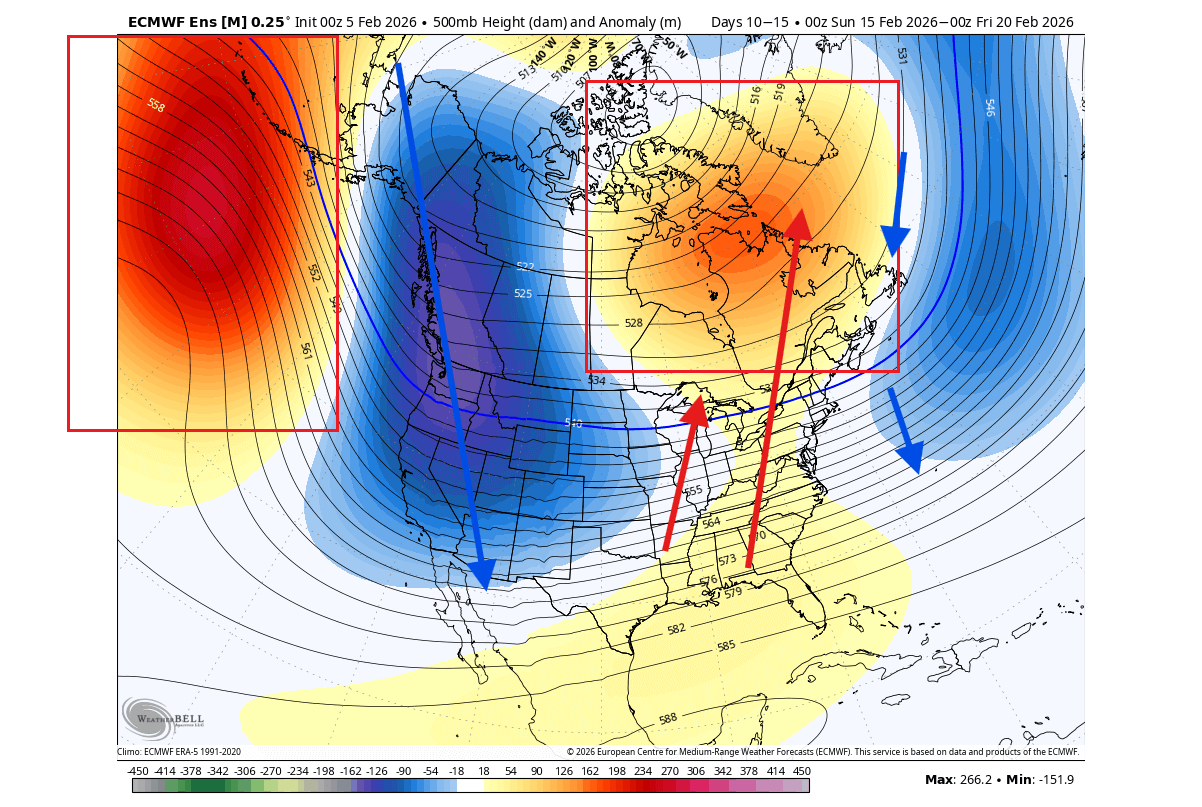
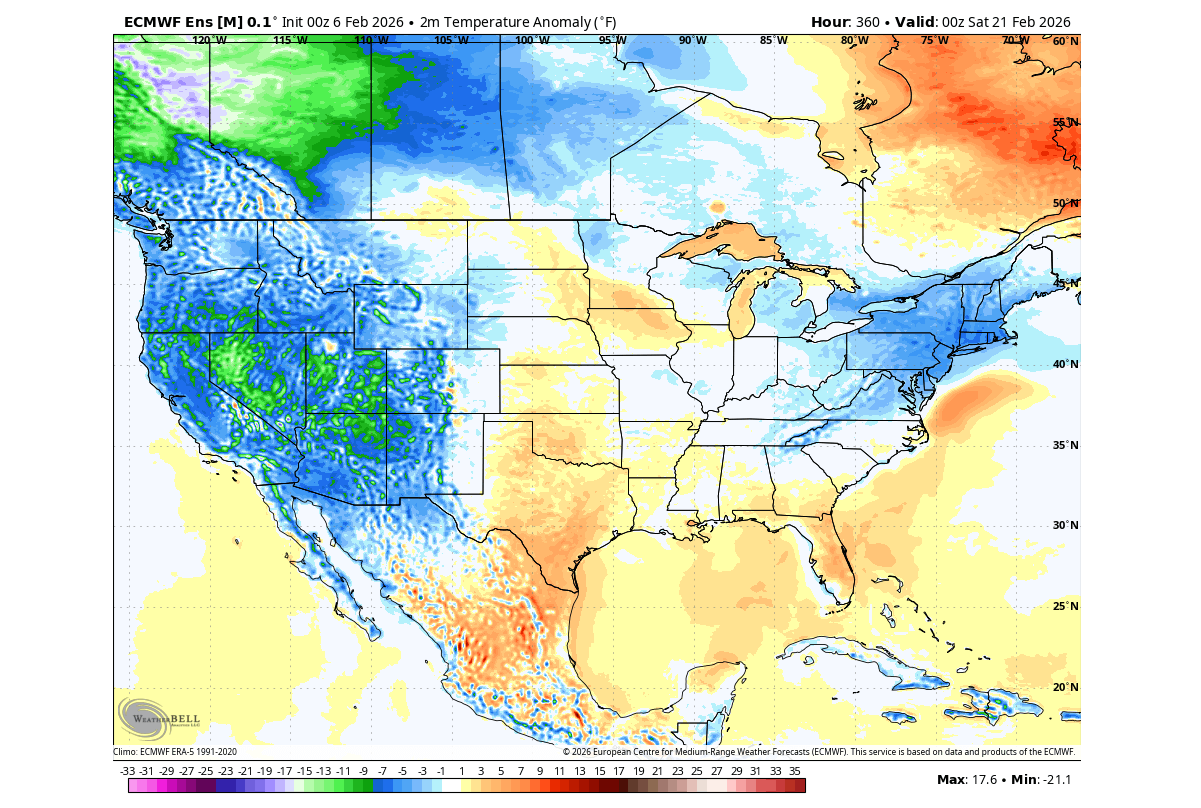
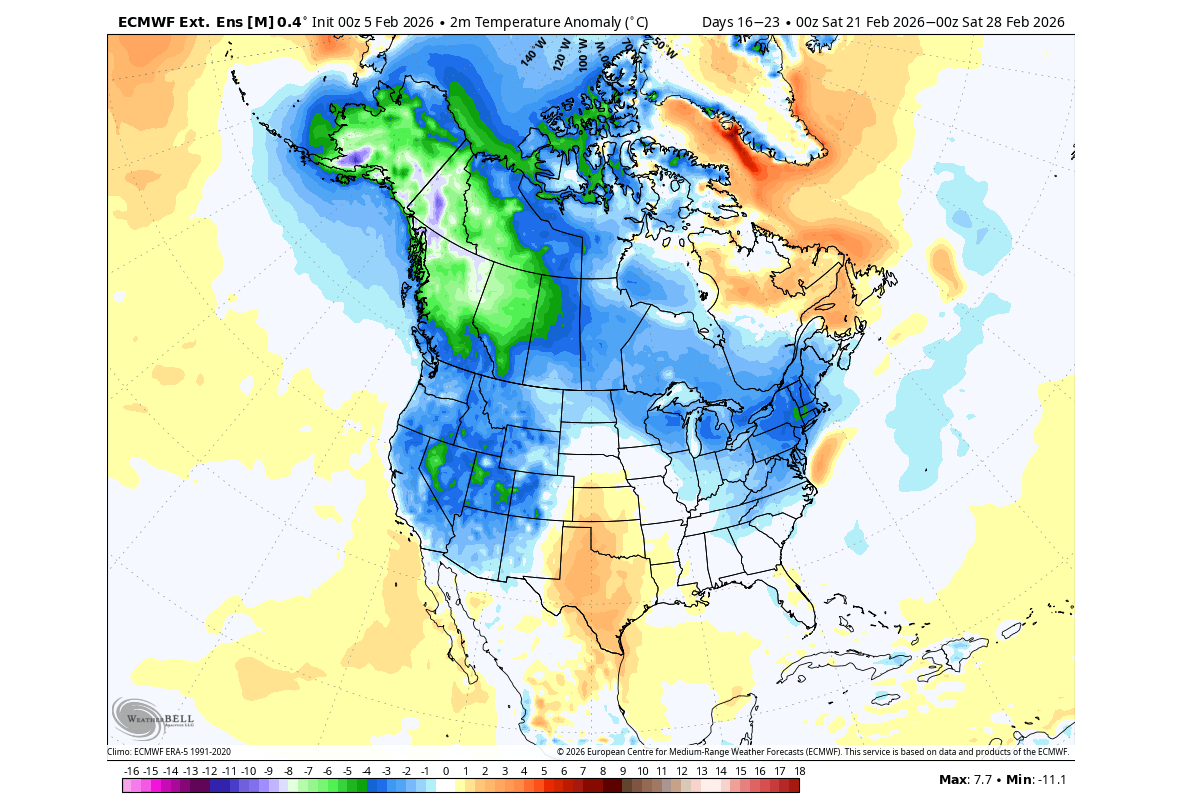
This causes a period of above-normal temperatures over much of central and eastern Canada, and also over the central and eastern United States. But due to the low-pressure zone over the west, the forecast shows a northerly flow and a colder airmass from western Canada into the western United States.

But the latest morning ensemble guidance from ECMWF already shows a pattern reversal over the United States and Canada by the start of the last third of February. This confirms the transitional nature of the MJO wave interference, ending with the dissipation of the anomalous warmth and the temperature drop returning.
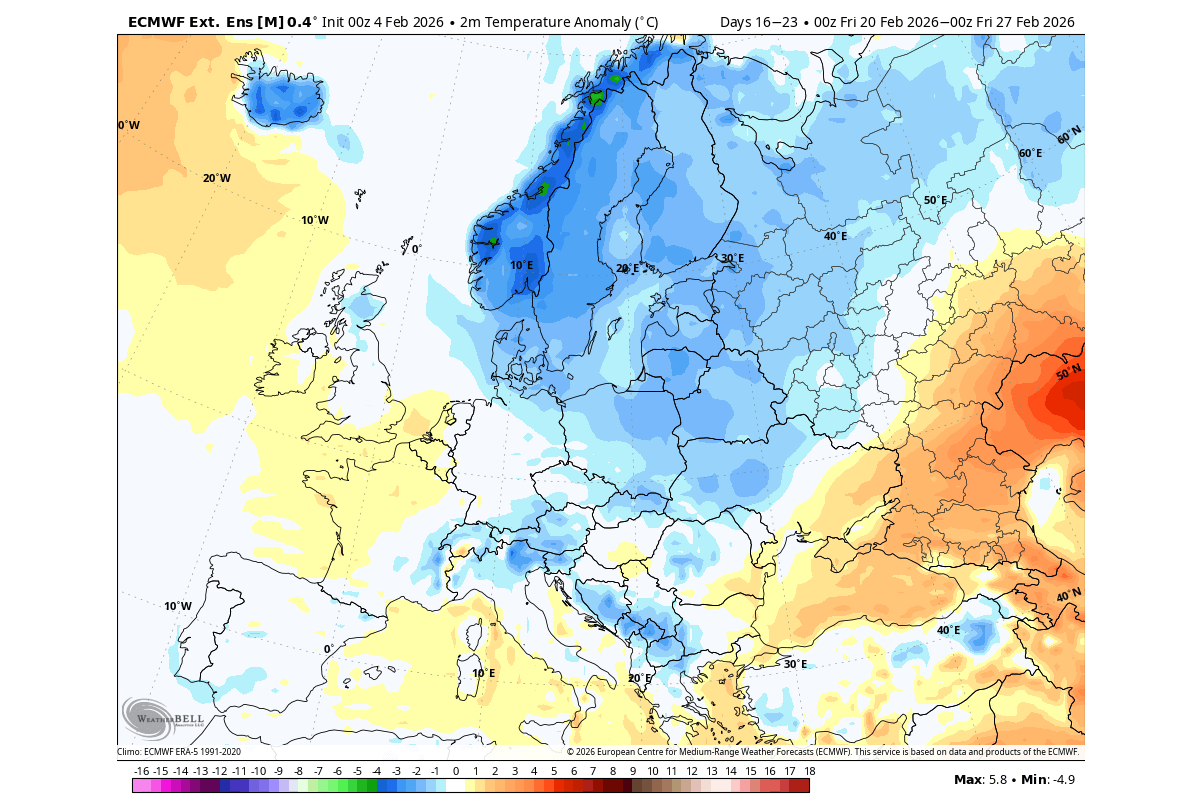
Over Europe, however, the ensemble forecast shows the colder air reaching further towards the west into the UK and into the central parts. The main cold airmass remains stable over the north and northeast, but a break in the Atlantic pattern can allow below-normal temperatures to spread across the continent to the west.
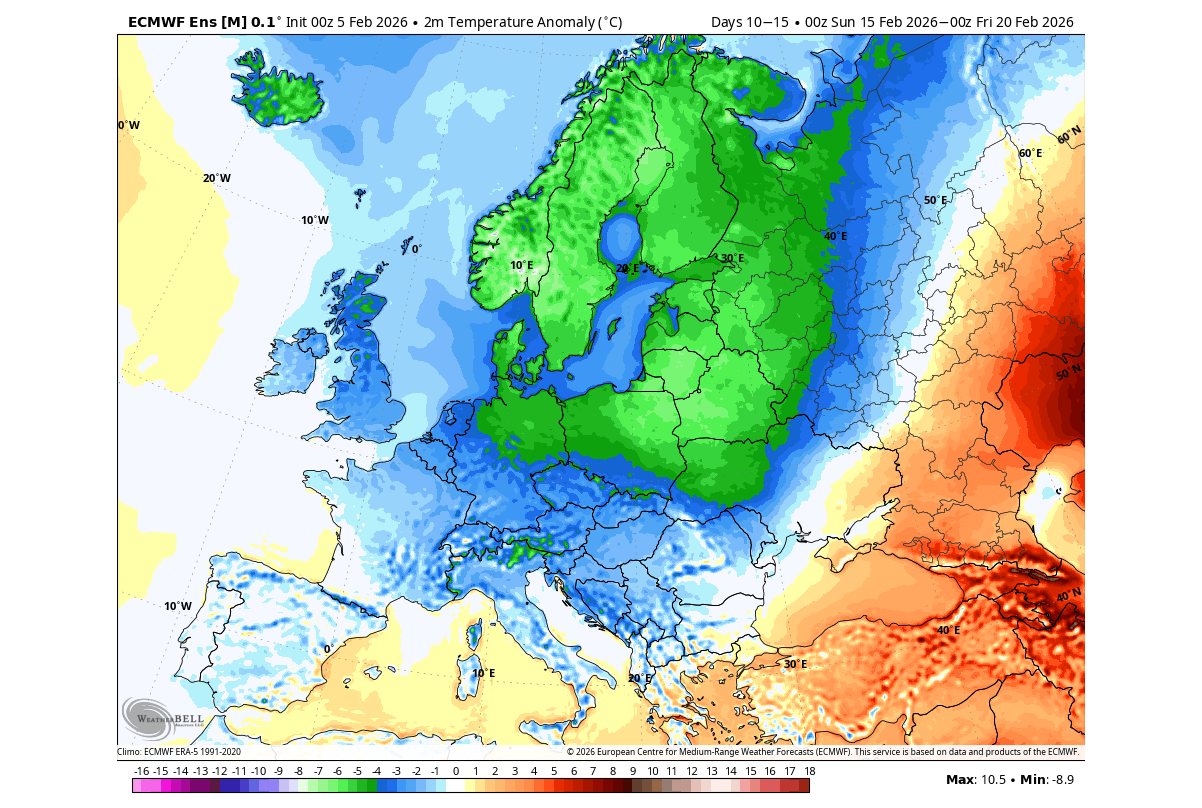
This is also in part because the main Polar Vortex core will shift into the eastern hemisphere. This helps to push the colder airmass closer to Europe, not directly affected by this MJO wave at the same time as North America.
In many cases, the MJO waves can bring cold weather into the United States on their own. But in this case, the timing of the stratospheric warming makes this “clash of titans” a rare weather case, and causes a temporary interference and counter-effect between the two impacts over North America.
But the effects of the MJO are not permanent, and they do tend to weaken as the wave moves away. For this reason, the extended range forecasts already show the return of the more typical post-SSW patterns in the last third of February and into early March.
The Late-Winter Outlook: Will the Cold Return Following the SSW Event?
As we go into the extended range, we have to add a disclaimer: The images below show the week 3-4 forecast trends. At this range, we do not look at the temperature in New York or Miami on March 7th at noon, but we look at the broad pressure anomalies across the Northern Hemisphere.
The goal is to identify the expected signals following a stratospheric warming event and other anomalies. This can confirm that a specific pattern is developing on a weekly timescale across the Northern Hemisphere.
Looking at week 3 first, this takes us into the last third of February, after the 20th. It shows the high-pressure anomalies pulling to the north, and the low-pressure area returning over the northern and eastern United States. This is something we would expect to see, with a stratospheric warming impact making its downward connection again, after the MJO wave passes.
A low-pressure area extends across the Atlantic towards Europe, but is cut off by a high-pressure ridge, bringing mild conditions into the southwestern parts. But a more local impact seems to be due to a low-pressure area over the northeast, impacting the northern and central parts of Europe.
The temperature anomaly forecast for the same period shows a cold pattern across western Canada and the western United States. But the forecast trend also shows the colder air anomaly returning into the northern, eastern, and northeastern United States. The southern Plains remain under normal to warmer temperatures.
Across Europe, the temperature anomaly forecast for the last third of February shows the colder airmass sitting over the north. We can see some extensions towards the central parts, which are likely individual events with a cold front passage.
Looking ahead into early March, the ECMWF ensemble temperature forecast shows a similar colder trend for the eastern United States. We can also see below-normal temperatures over western Canada, extending into the western United States.
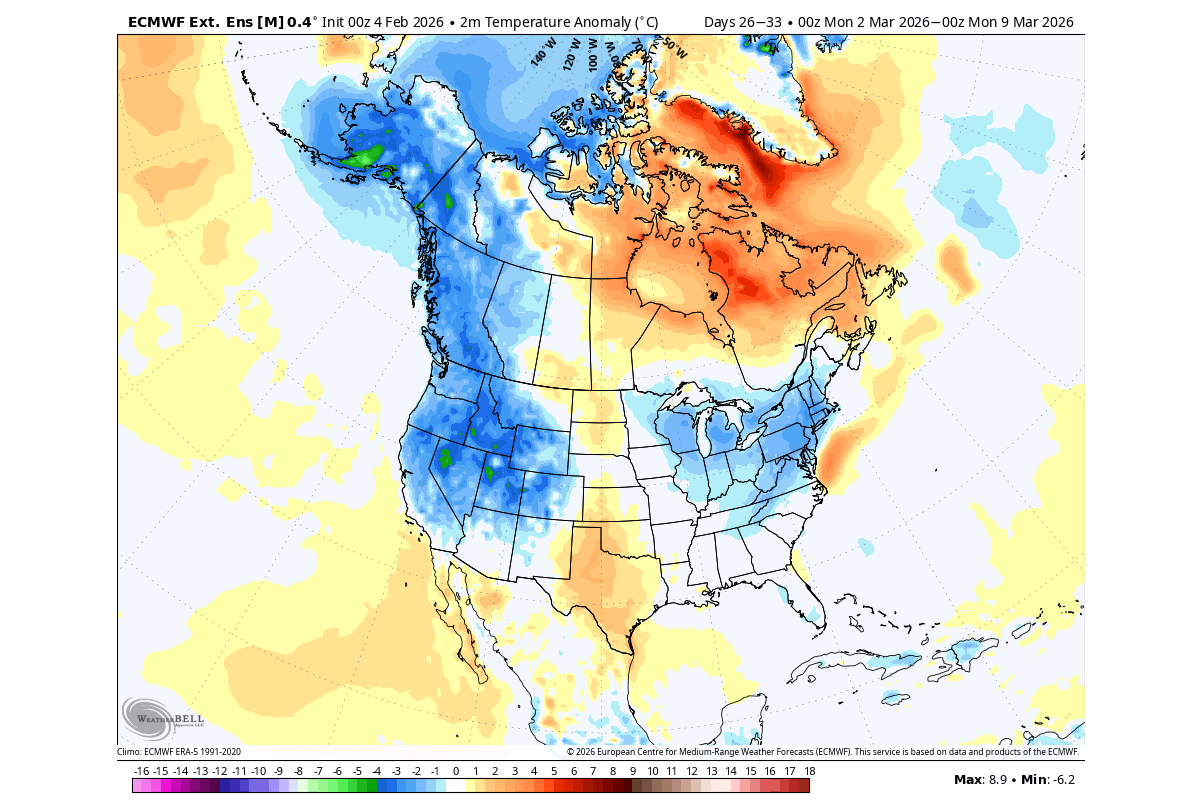
This is a pattern that the extended ensemble forecast often likes to show. Once the period gets closer, the cold more often stays on the eastern side of the United States and western Canada, with a connection corridor.
But as we have seen earlier above in the article, a pressure interference can shift the anomalies by several hundred or a thousand miles/kilometers.
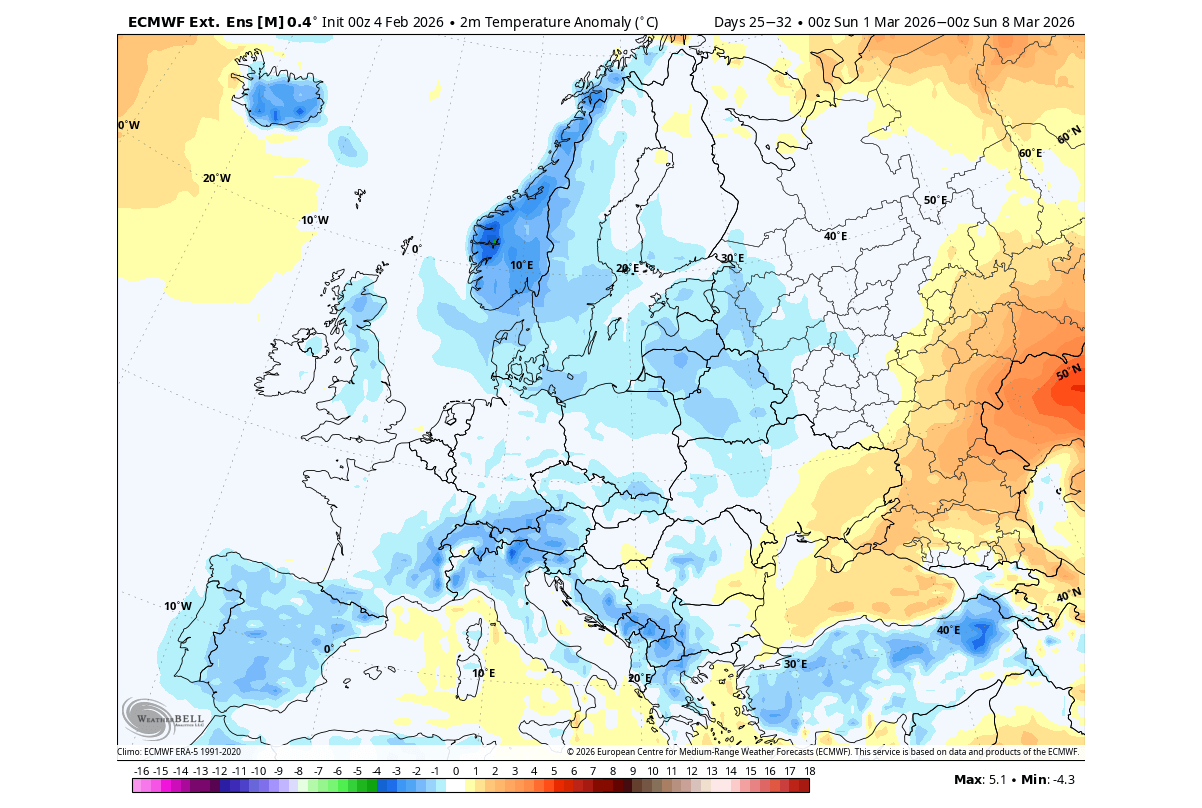
Over Europe, the early March temperature trend is trending cooler over a larger part of the continent. This would be expected after a Stratospheric Warming and a Polar Vortex collapse. The anomalies are usually not strong in this range, because the forecast is “averaged out” the further out we go.
This article is based on the latest available model/ensemble data, and we will continue to release weekly updates on this developing Polar Vortex situation.
We will keep you updated on the global weather pattern development, so don’t forget to bookmark our page. Also, if you have seen this article in the Google App (Discover) feed, click the like button (♥) there to see more of our forecasts and our latest articles on weather and nature in general.
The main forecast images in this article are from WeatherBell and weathermodels.com, using a commercial forecaster license.
Don’t miss:
La Niña is Dissolving Rapidly, Marking the Start of a Major Atmospheric and Oceanic Shift for 2026