The Southern Hemisphere is currently in its Winter season, and the latest forecasts show strong warming waves in the Stratosphere above the South Pole. Stratospheric warming events are rare in the Southern Hemisphere but are usually very powerful and are known to have a global impact, likely even on the northern Winter season.
The Southern Hemisphere does not experience these winter stratospheric warming events so often, with only a few known events in the past decades. We just recently had a stratospheric warming event in the Northern Hemisphere, affecting the late winter and spring weather patterns.
We will look at the current stratospheric warming waves forecast to develop. We will also look at some of the unusual effects a full stratospheric warming event can have on the Northern Hemisphere, or even on the northern winter season, in special cases.
POLAR VORTEX CIRCULATION
The driving force behind these events is the Polar Vortex. To understand it, it’s usually best to visualize it. But to keep it simple, it is just a name that describes the broad winter circulation over the northern (and southern) hemispheres.
Below, you can see a 3-dimensional image of the Polar Vortex. The vertical scale is greatly enhanced for better visual presentation. It nicely shows the otherwise invisible structure of the Polar Vortex, connecting down to the lower levels, the pressure systems, and the winter weather patterns below.
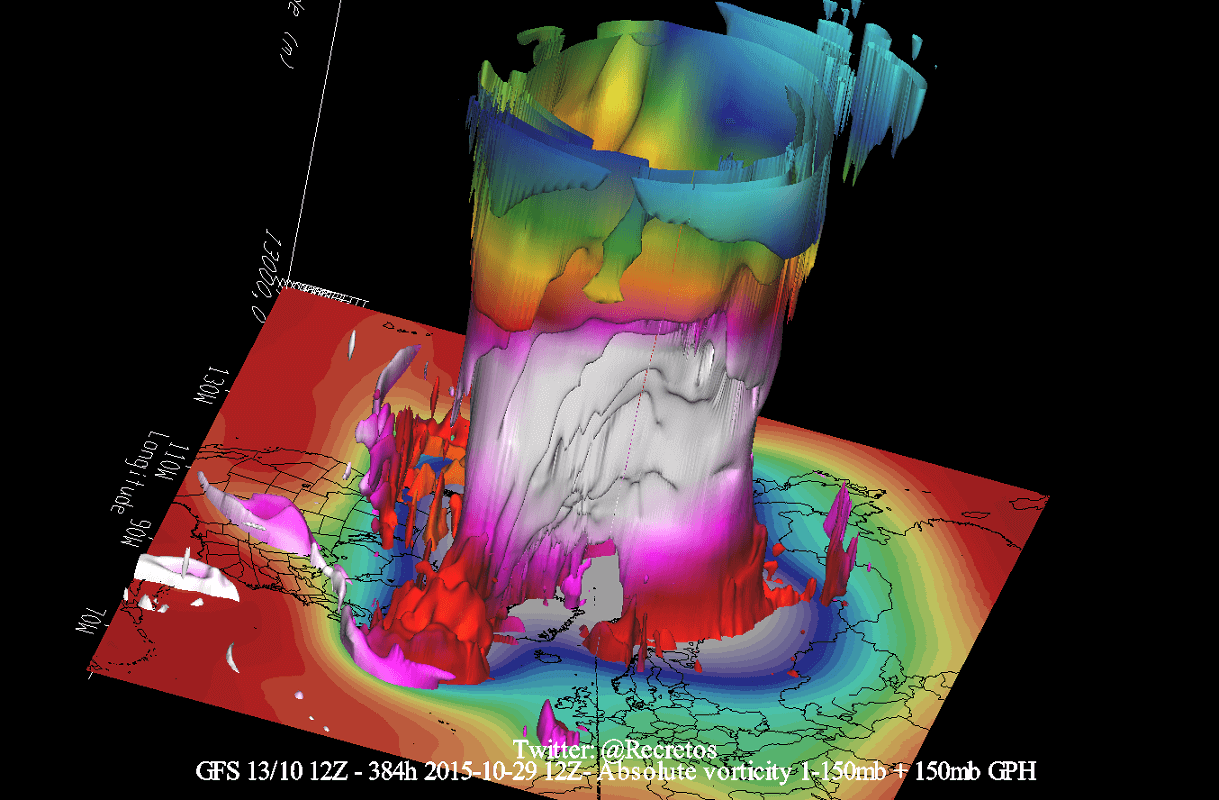
Overall, the Polar Vortex behaves like a very large cyclone, with some even calling it a “stratospheric hurricane”. It covers the whole north pole down to the mid-latitudes. It is connected through all atmospheric levels, from the ground up, but can have different shapes at different altitudes.
For this reason, we separate the entire Polar Vortex into an upper (stratospheric) and a lower (tropospheric) part. They both play their roles differently, so we monitor them as two separate systems. But it’s very important how both parts are connected. Image by NOAA-Climate.
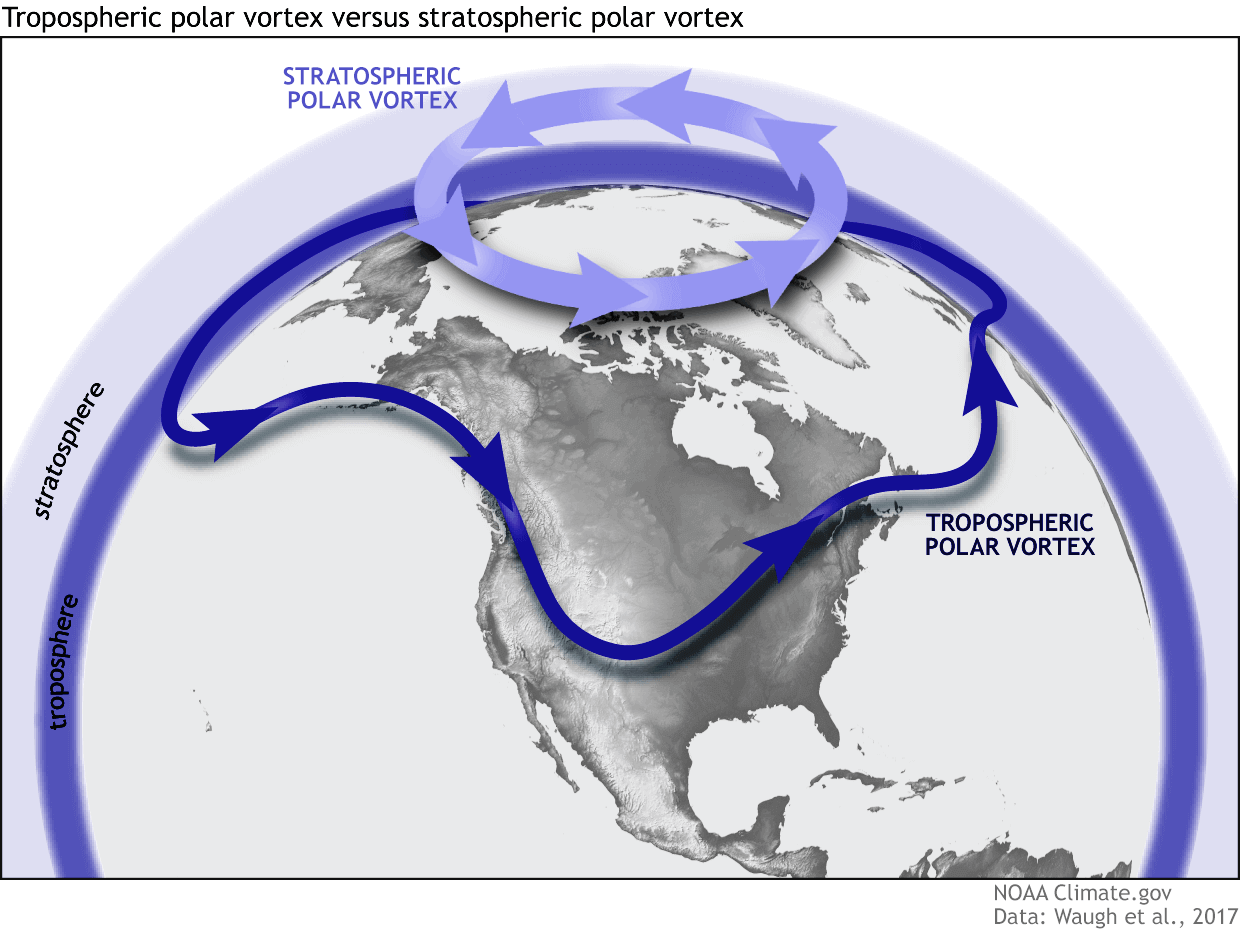
The upper (stratospheric) part is more circular and symmetrical as it spins higher above the ground, with fewer obstacles in its flow.
To simplify, all you need to know is that the upper and lower parts of the Polar Vortex are connected. Changes in the upper part can significantly impact weather anomalies in the lower parts of the atmosphere and the weather we experience at the surface.
Below is an image that shows the Polar Vortex at different altitudes. The closer we go to the ground levels (on the left side), the more deformed it becomes due to the complex terrain and the strong weather fronts and systems that deform it.
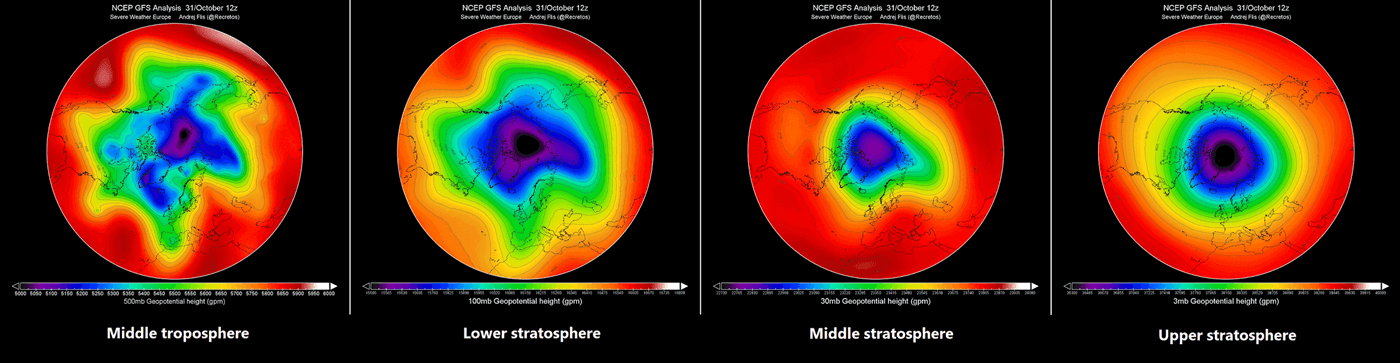
This process is exactly the same in the Southern Hemisphere. But there is much less terrain there, so there are fewer disruptions of the stratospheric Polar Vortex.
In this article, we will analyze a forecast barrage of Stratospheric warming waves over the Southern Hemisphere. The event itself occurs exactly the same way as over the Northern Hemisphere and can grow in strength over time.
STRATOSPHERIC WARMING EVENT 2025
In mid-March, a strong Sudden Stratospheric Warming event (SSW) began over the Northern Hemisphere. As the name suggests, this event brings a rapid rise in pressure and temperature in the stratosphere. When strong enough, this event can collapse the Polar Vortex circulation, impacting the weather patterns below up to several weeks.
Below is the mid-stratosphere (31km/18.5miles) analysis from mid-March. It shows the stratospheric high-pressure system (H) taking over the polar regions and splitting the Polar Vortex into two separate cores (L). This is the stratospheric warming even at its peak power, with the warming wave completely taking over the mid-stratosphere.
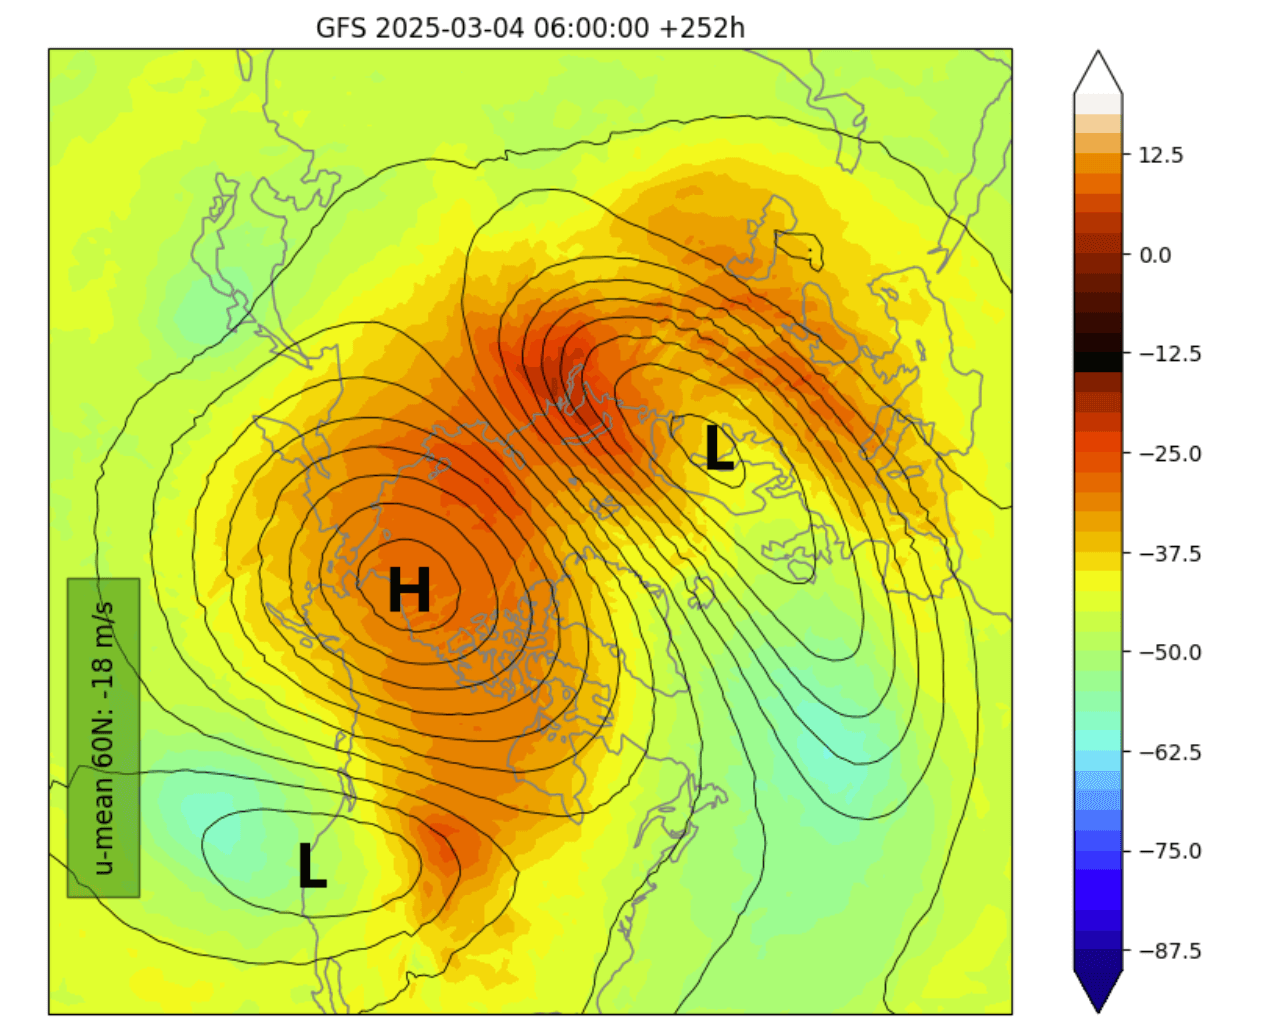
Such a strong, warm anomaly can only be caused by stratospheric warming events. This event was unusually strong for this time of year, compared to previous early spring SSW events.
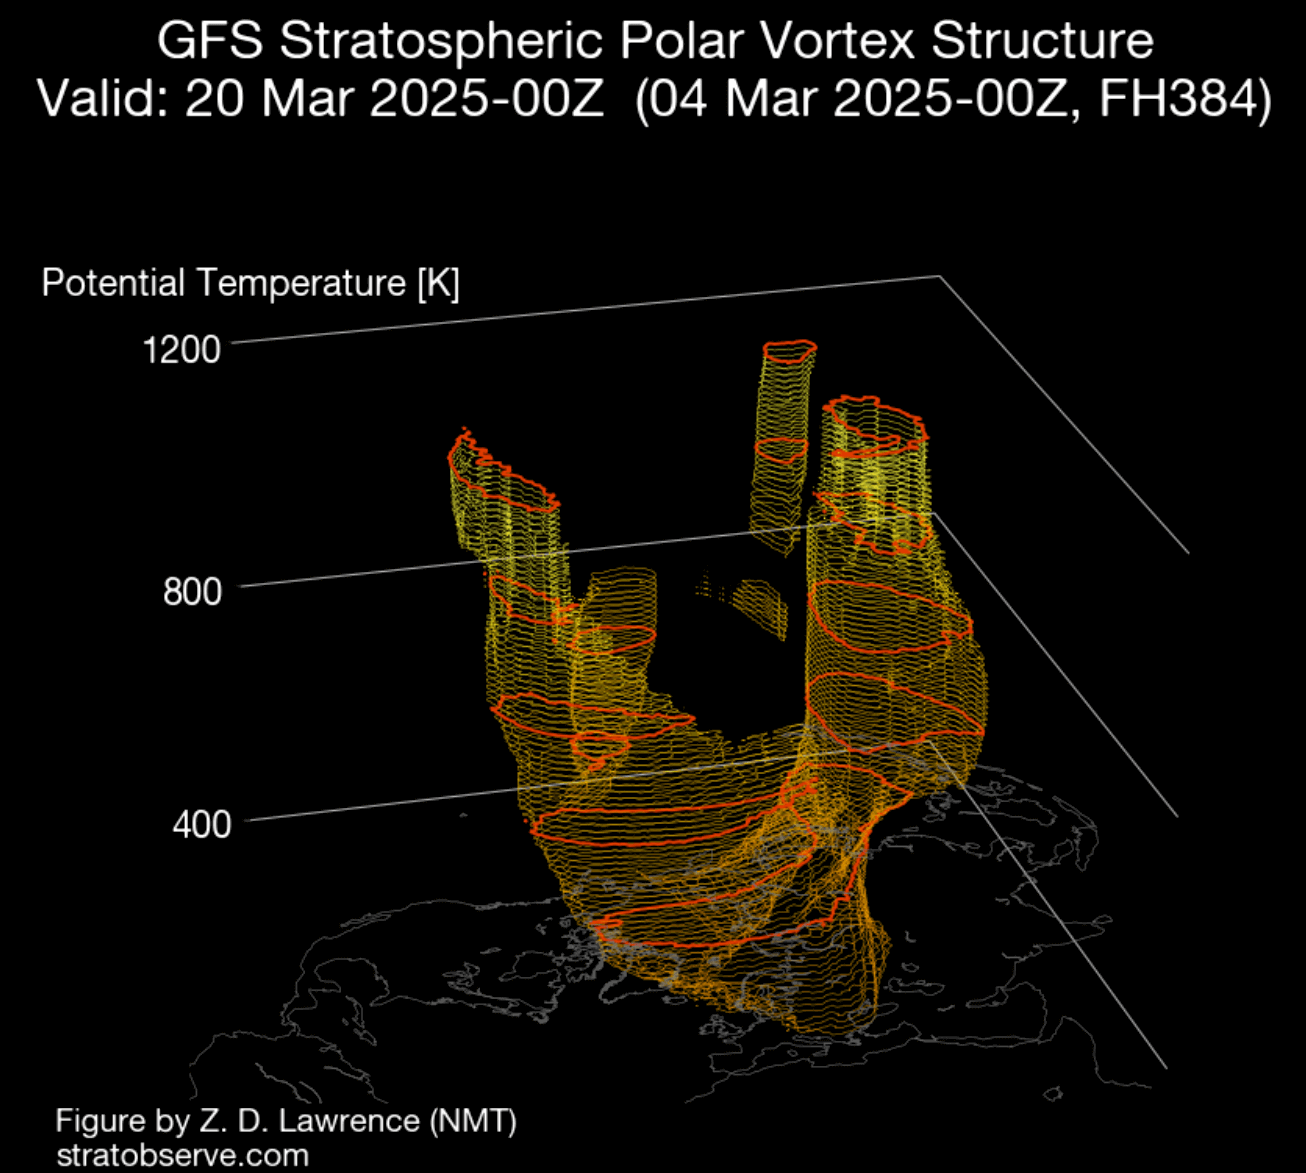
Below is a 3D vertical structure analysis of this event, where you can see the stratospheric warming impact in full effect. The image shows a deformed and broken shape of the Polar Vortex. You can also see a “void” in its central area, which is the presence of a high-pressure anomaly and the warming wave that broke down the Polar Vortex.
This had a big impact on the atmosphere. Below you can see an image with pressure anomalies in the lower half of the atmosphere. Negative values indicate lower pressure (blue anomalies), and positive values indicate higher pressure (red colors). You can see a strong high-pressure anomaly in the stratosphere from early March all the way into mid-April.
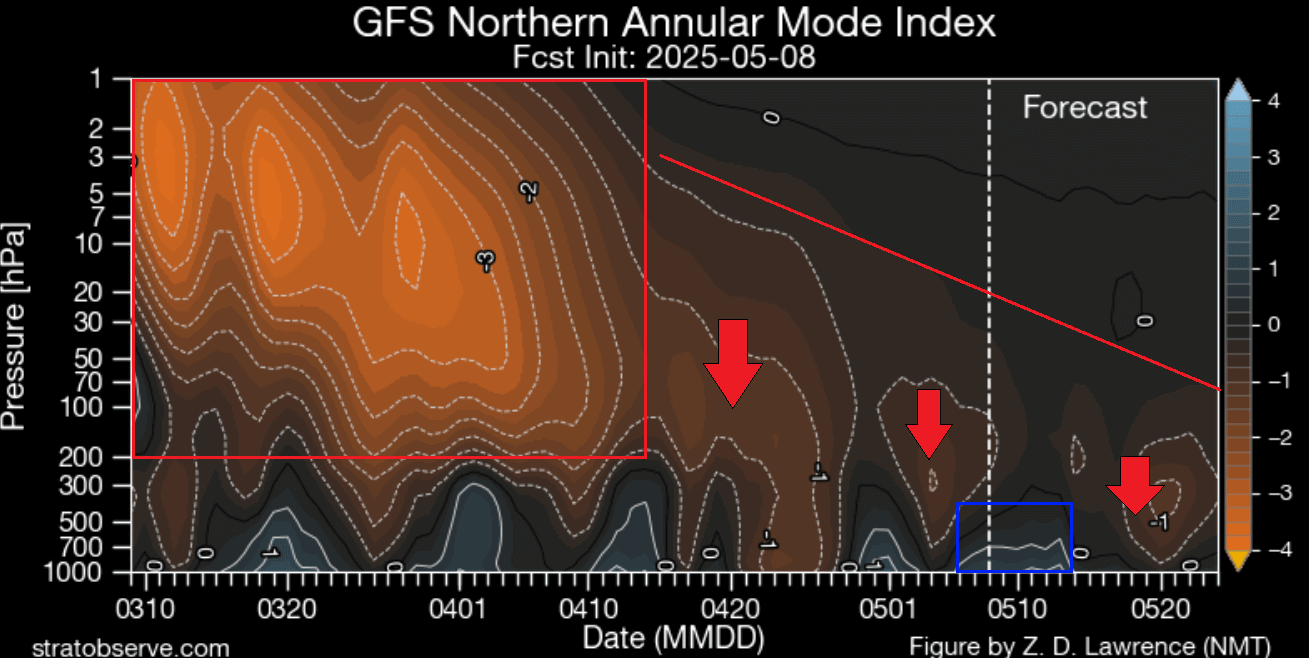
That large mass of high pressure is the stratospheric warming anomaly, and you can see how its impact slowly moved downwards to the weather layer (below 100-200hPa). It impacts the lower levels in waves, playing a role in the surface weather patterns.
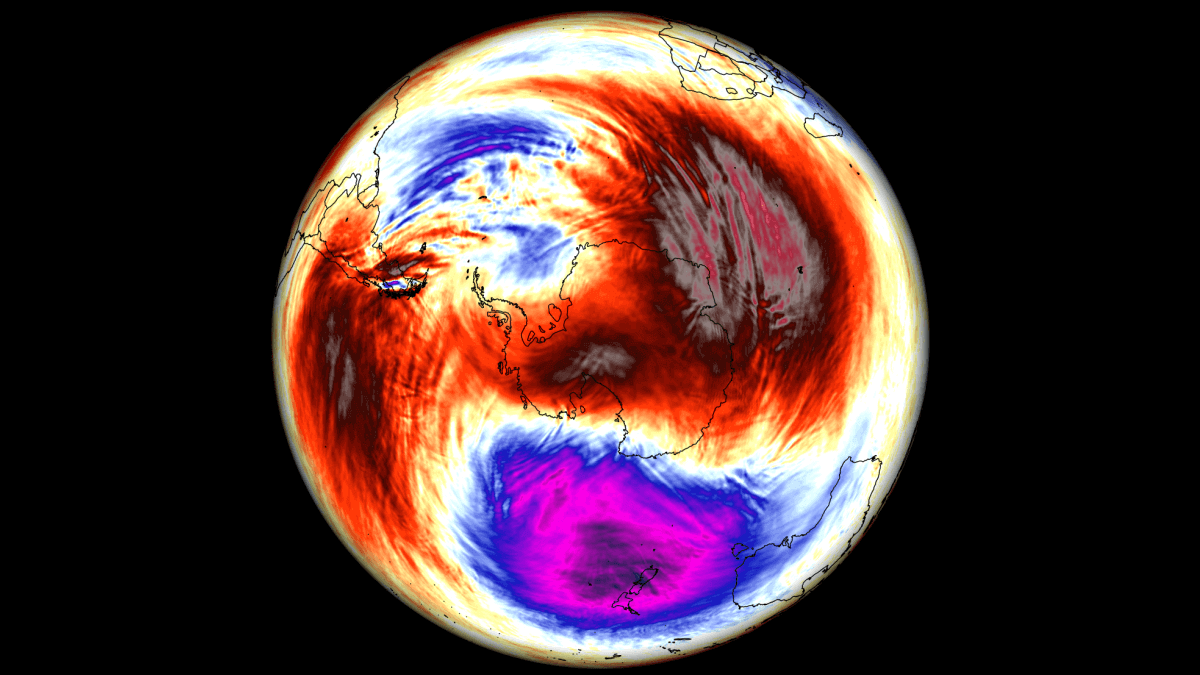
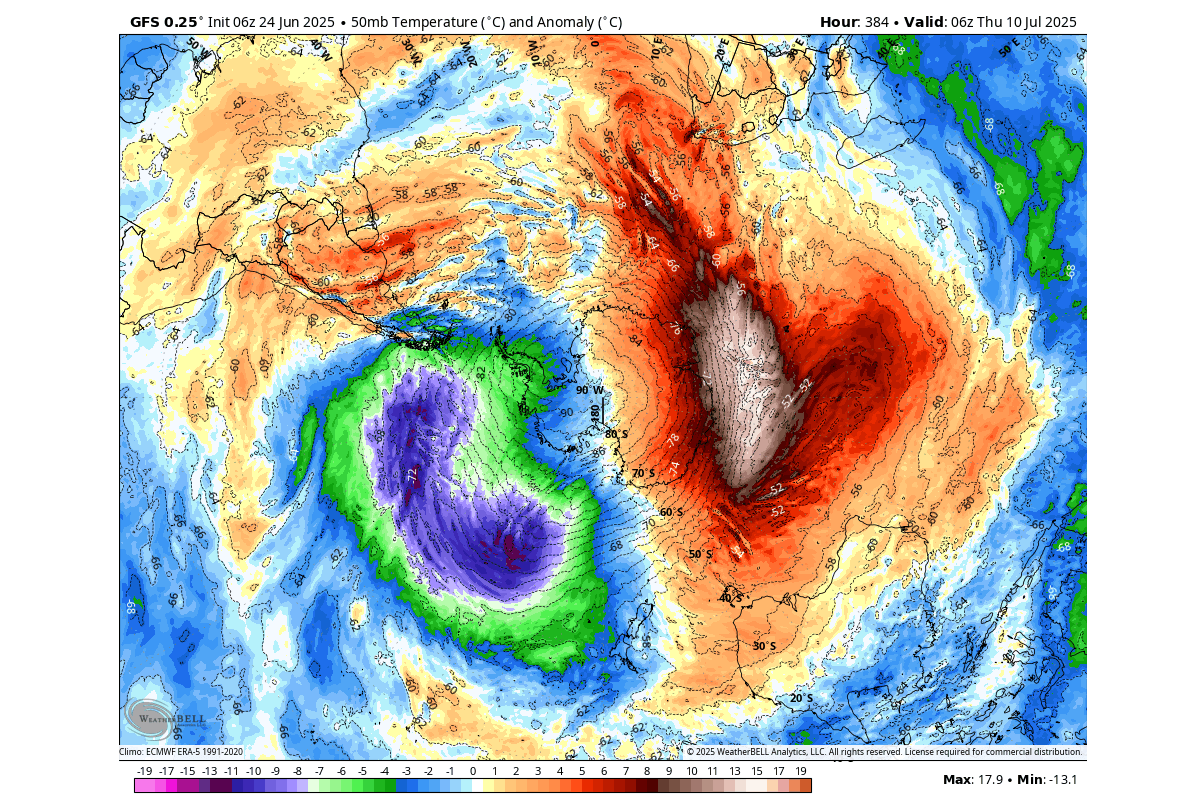
We also had a strong example of a stratospheric warming event last July over the Southern Hemisphere. Below is the temperature anomaly analysis for that event, which shows a strong temperature anomaly at the 10mb level (31km/18.5miles).
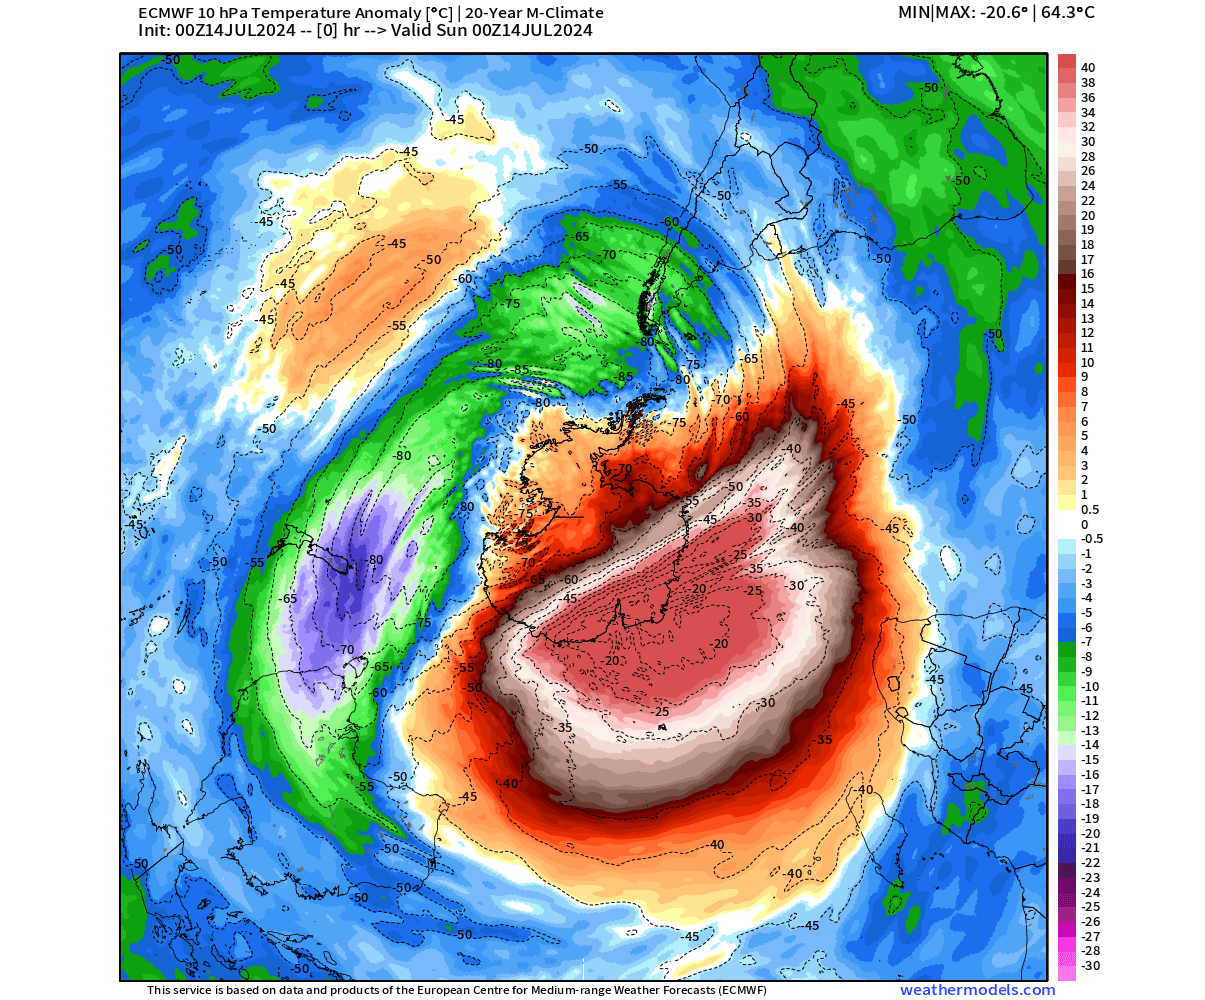
This area of unusually high temperatures is part of the stratospheric warming event, with peak temperatures exceeding 60°C above the long-term average. This event marked the strongest stratospheric warming wave for this time of year over the southern hemisphere.
NEW SOUTH STRATOSPHERIC WARMING
The Southern Hemisphere has opposite weather seasons to the Northern Hemisphere. So, while we are now in Summer, there is Winter in the Southern Hemisphere. This means there is an active Polar Vortex circulation over the South Pole.
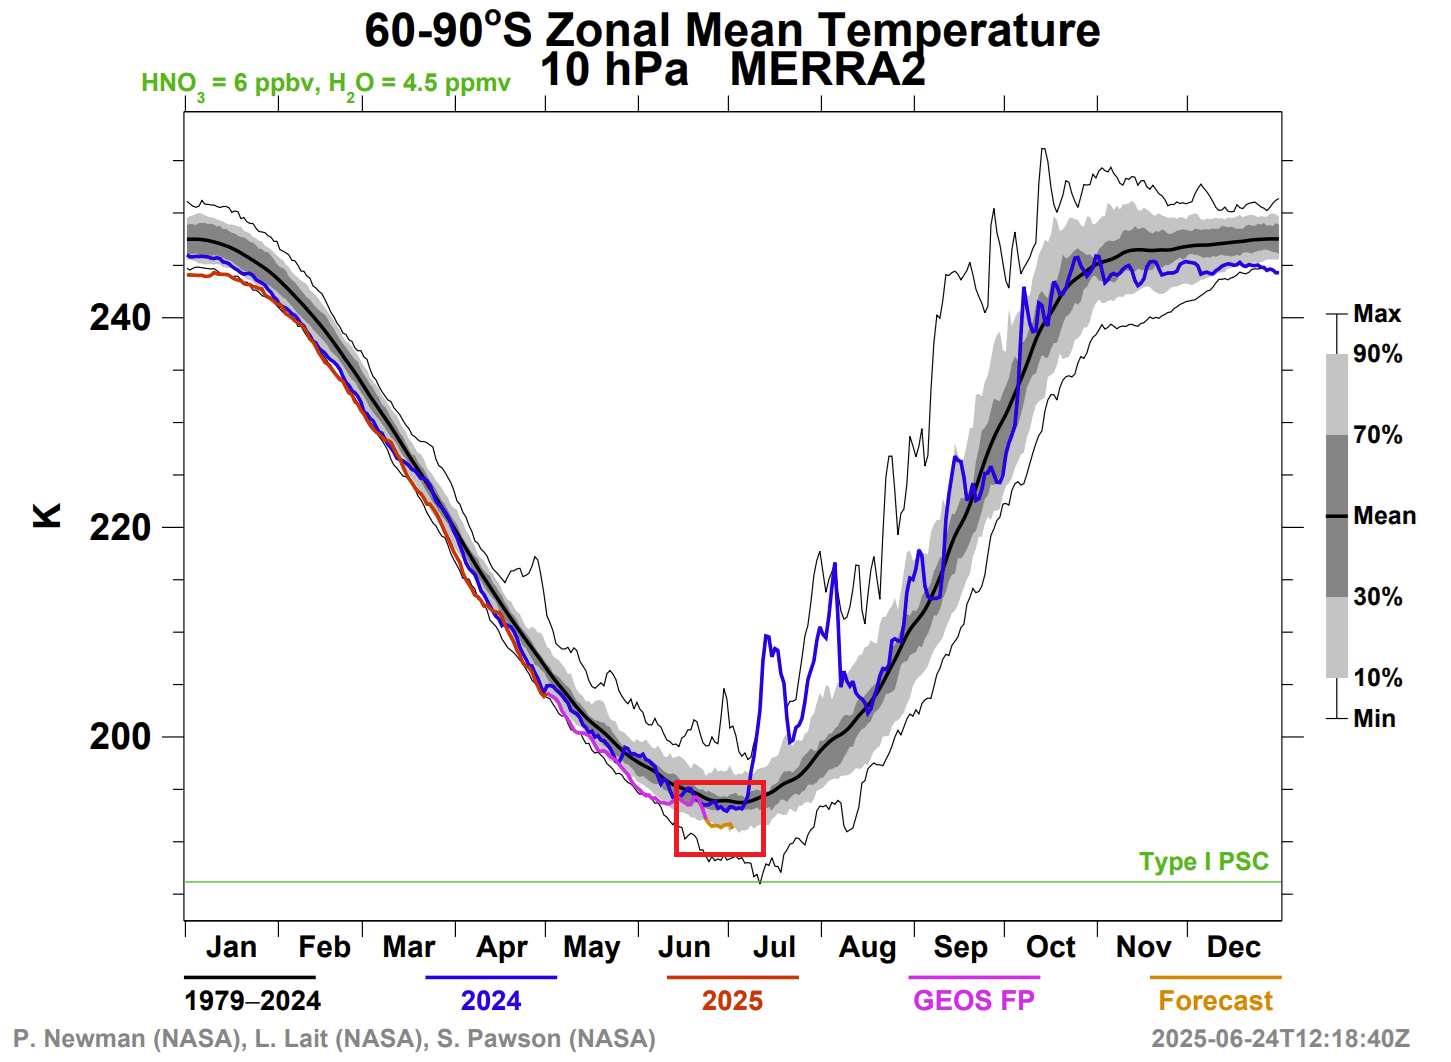
Below is the latest analysis from the NASA stratospheric monitoring system. It shows the temperatures in the core of the southern stratospheric Polar Vortex at the 10 mb level (31 km/18.5 miles). The red and purple lines indicate the current season and show us below-normal temperatures currently in the core of the Polar Vortex.
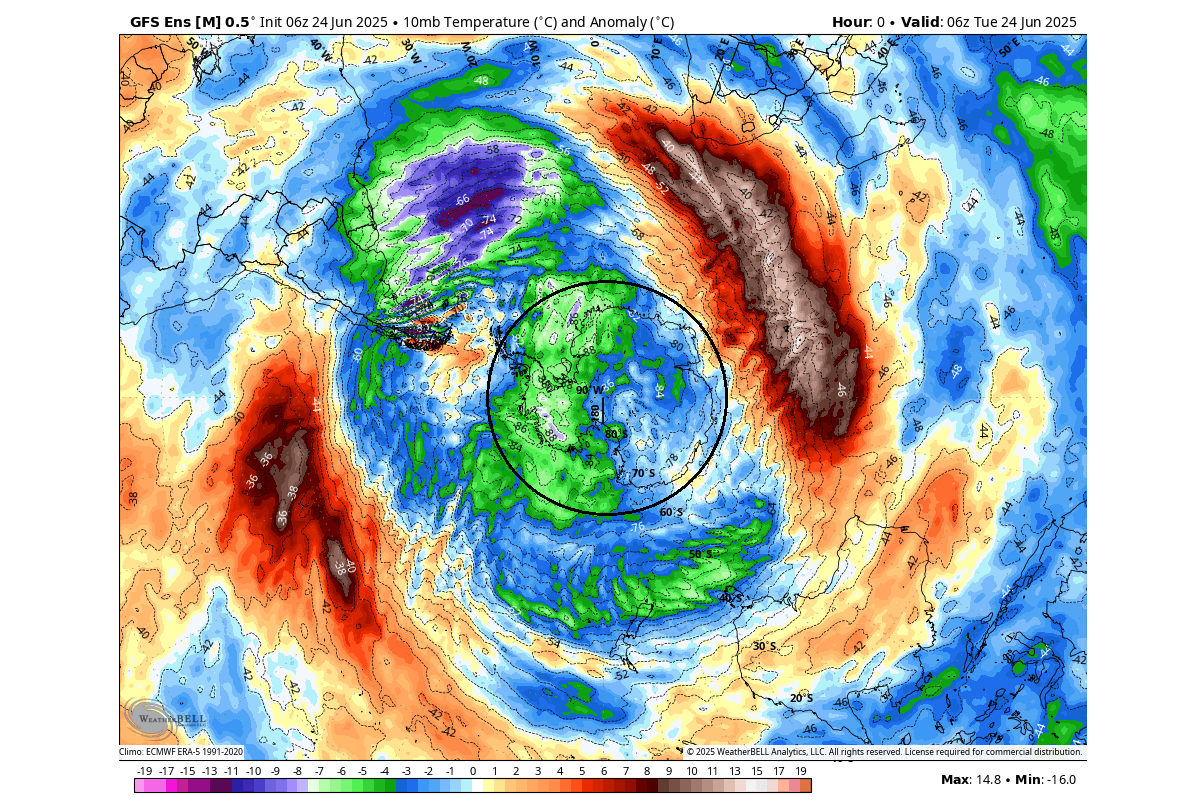
If we look at the actual latest temperatures in the mid-stratosphere, you can see that the core over the South Pole really is colder than normal. But you can already see some warming waves starting to emerge around the core in the outer layers of the Polar Vortex. Antarctica is marked with a circle.
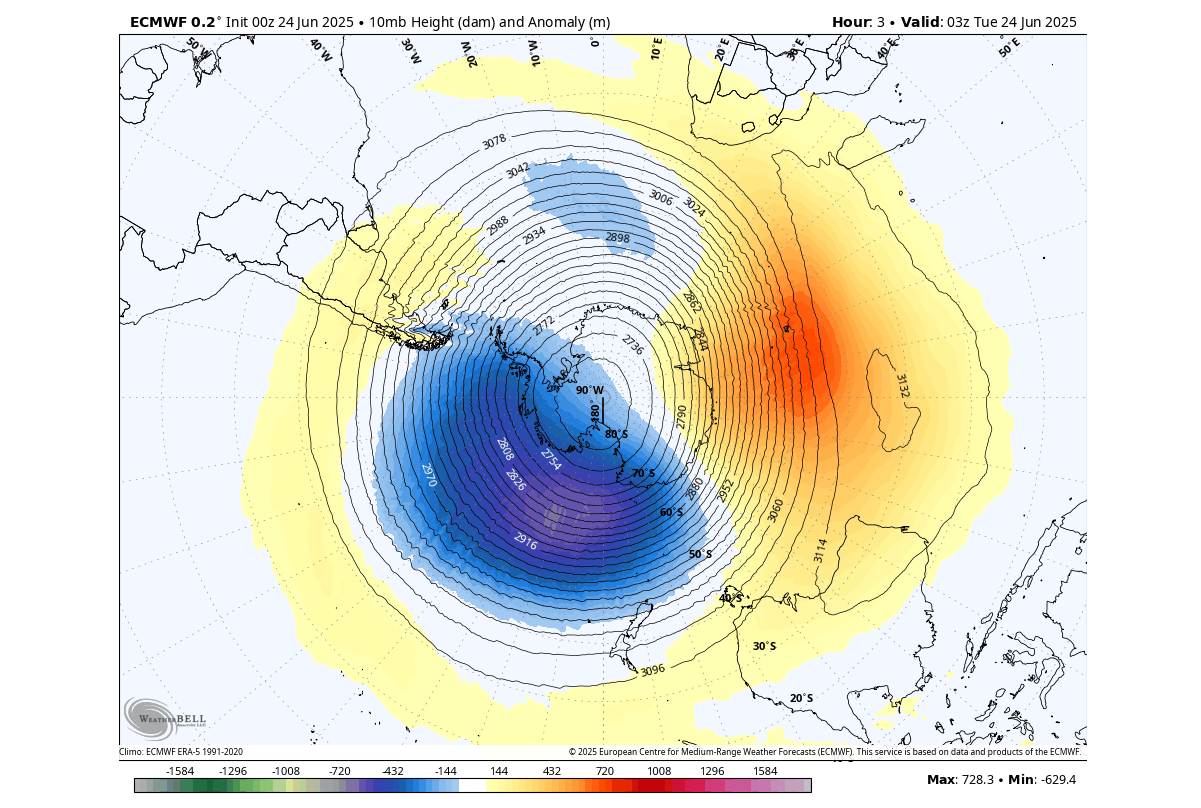
If we look at the pressure analysis, it shows a good shape of the Polar Vortex, with a high-pressure anomaly area building in its eastern parts. This high-pressure anomaly is associated with the warming wave seen in the previous image.
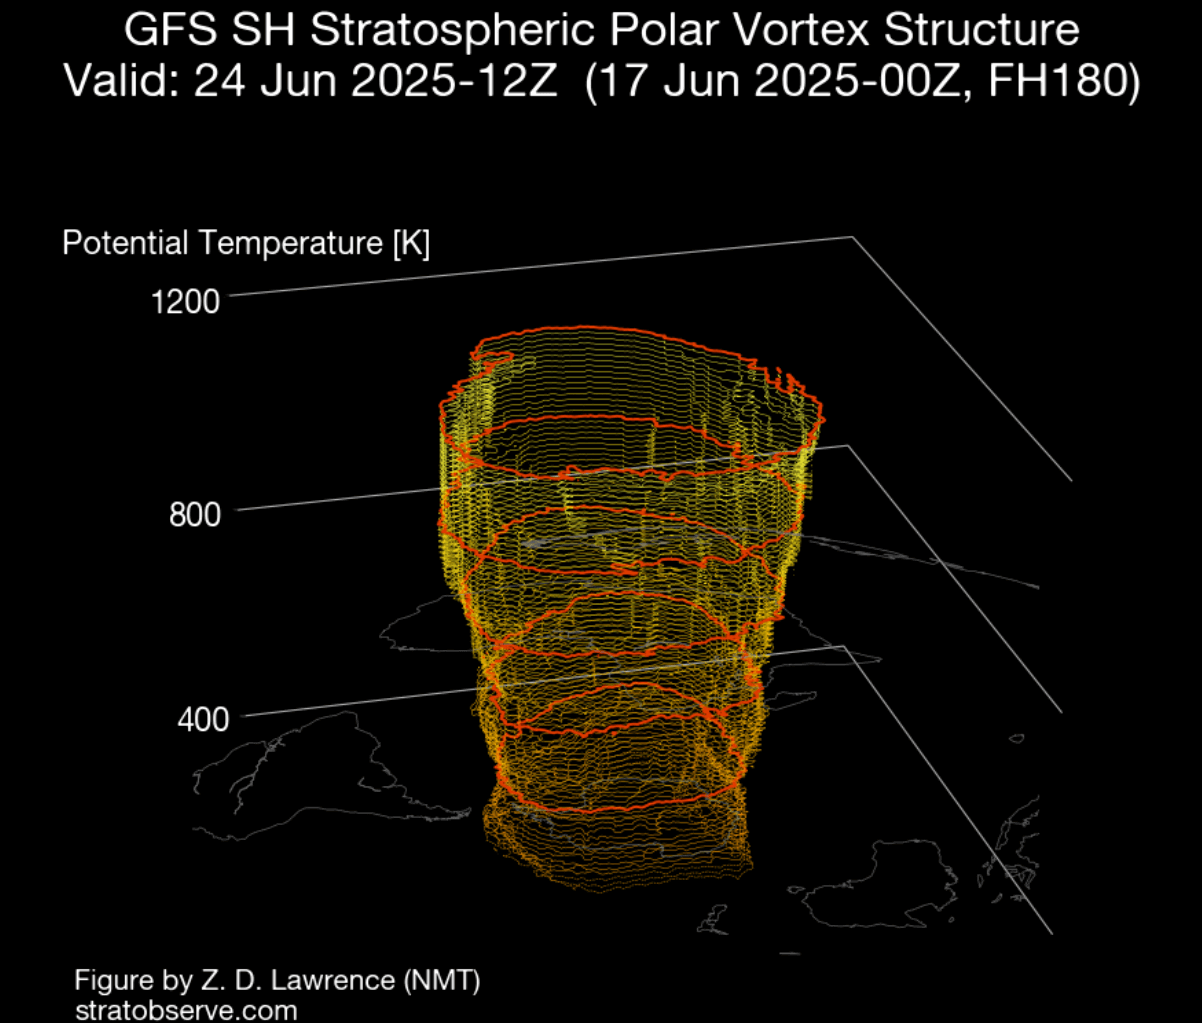
The 3-dimensional analysis from StratObserve shows the shape of the Polar Vortex even better. You can see a good circular shape that looks stable, at least for now. There are some deformations in its structure, associated with the pressure and warming anomalies around the Polar Vortex.
But these are just the early warming waves, with much stronger anomalies forecast to come over the next two weeks and likely even beyond.
STRATOSPHERIC WARMING WAVES BEGIN
Usually, the early warming waves can be a prelude to stronger events that follow behind in waves, with a proper Stratospheric Warming event unfolding that can disrupt the whole Polar Vortex.
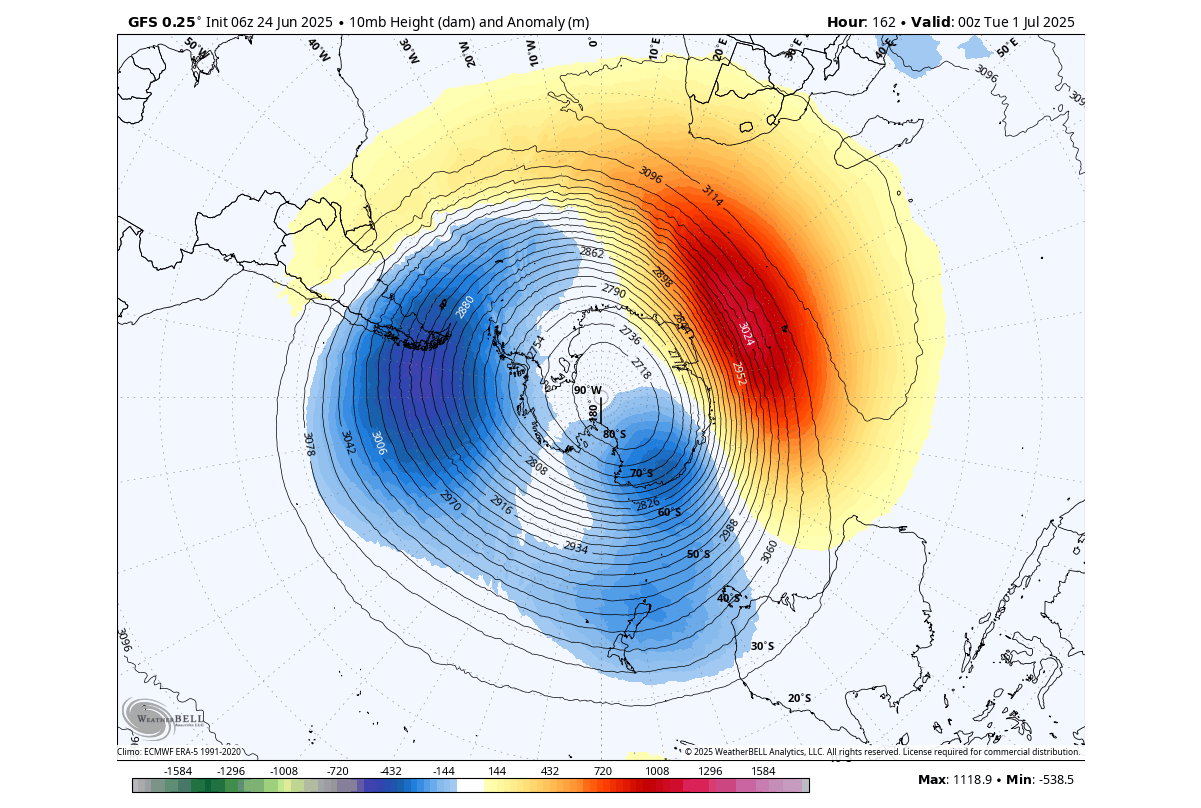
Below is the pressure anomaly for next week in the mid-stratosphere over the South Pole. You can see the high-pressure anomaly is forecast to intensify over the eastern half, putting more pressure on the structure of the Polar Vortex.
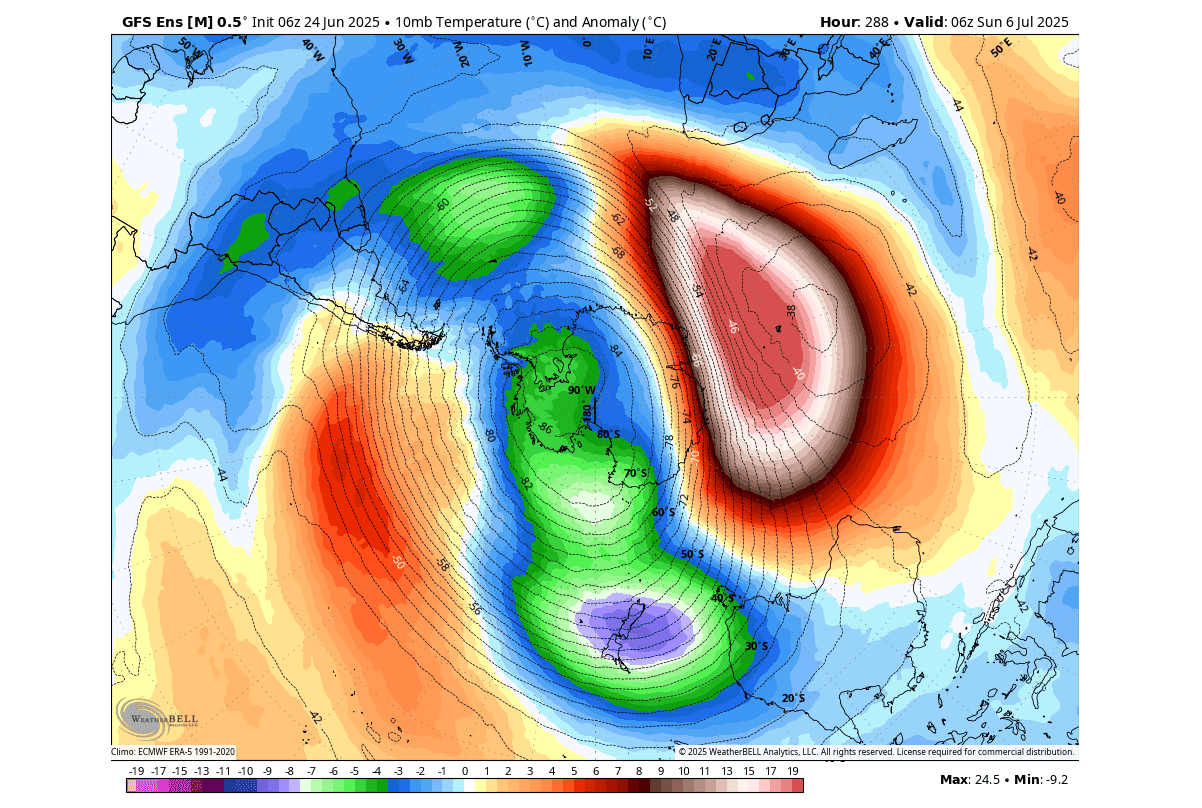
Looking at the temperature anomaly for later next week at the same level, you can see a strong warming wave developing under the high-pressure anomaly. The core of the Polar Vortex remains cold, but the warming wave will bring temperatures 25-30°C above normal for this time of year.
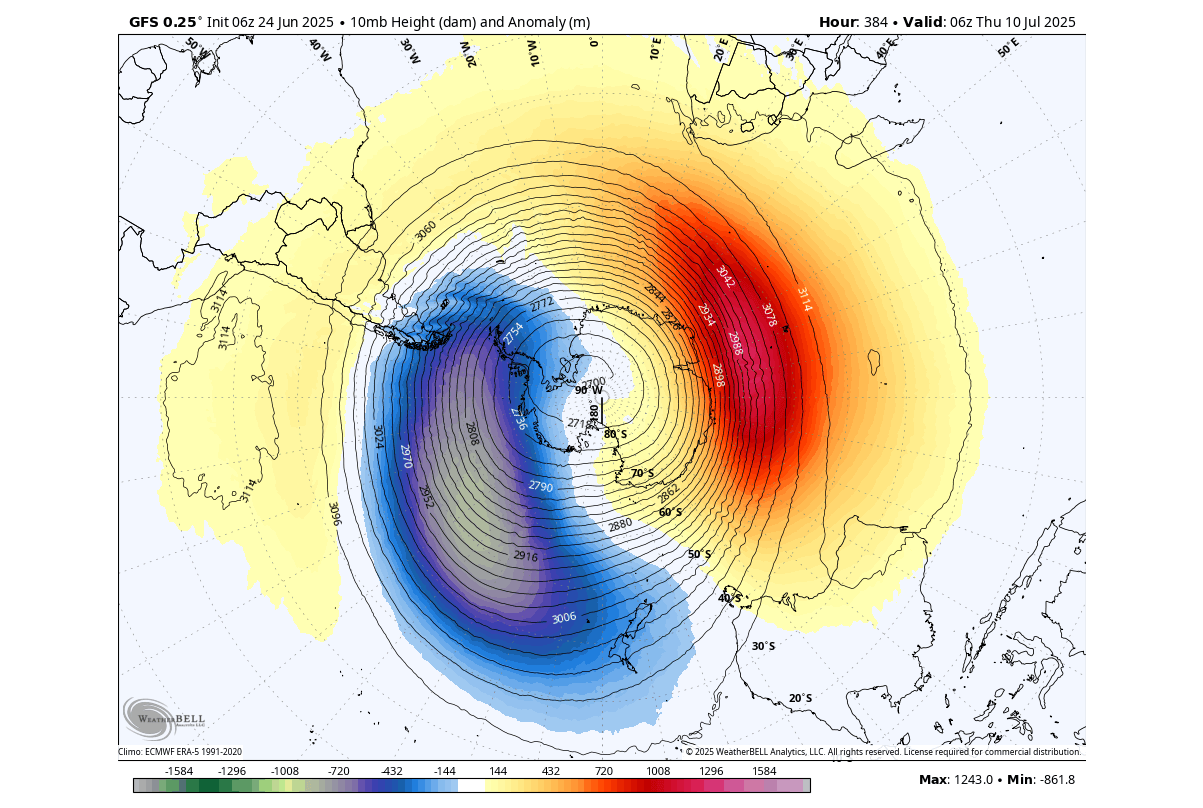
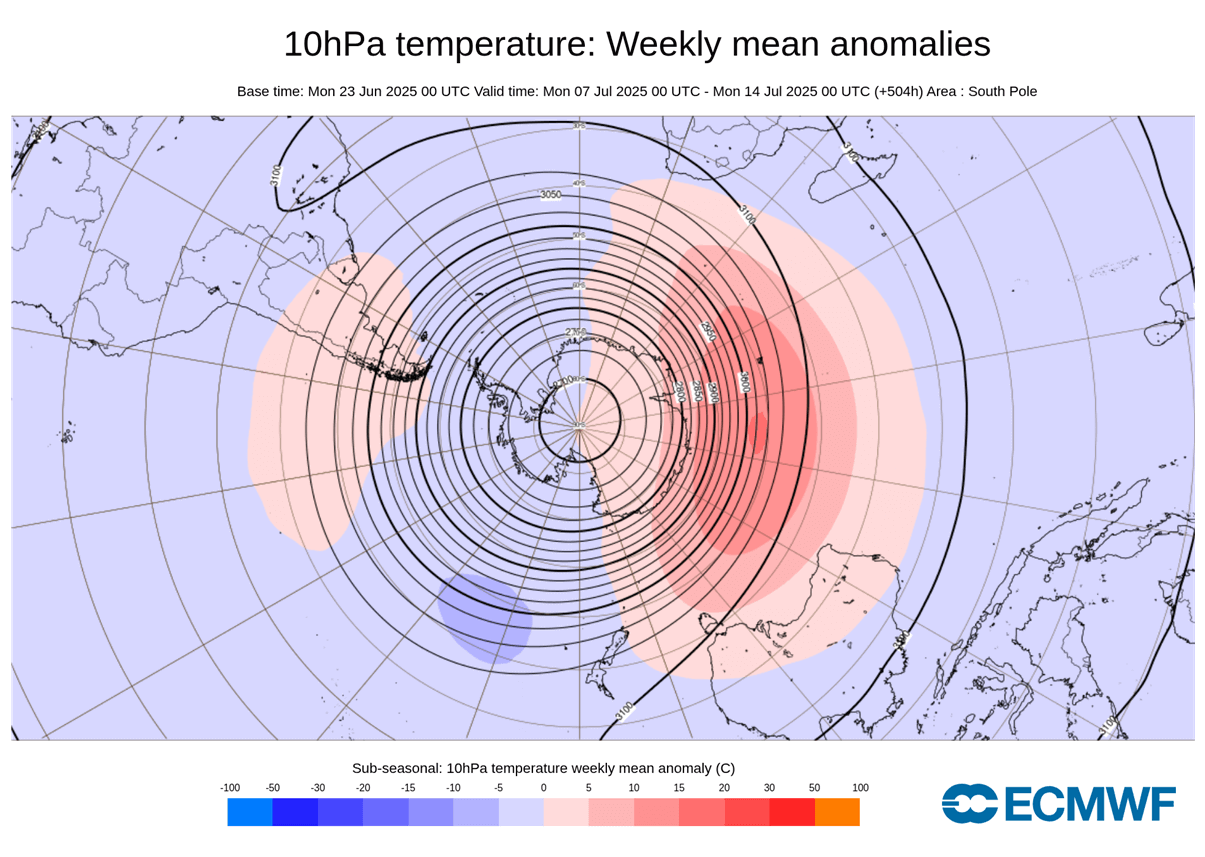
The Polar Vortex forecast for the second week of July shows a continued high-pressure anomaly around the Polar Vortex. In this forecast, we can see the above-normal pressure spreading a bit further around and over Antarctica.
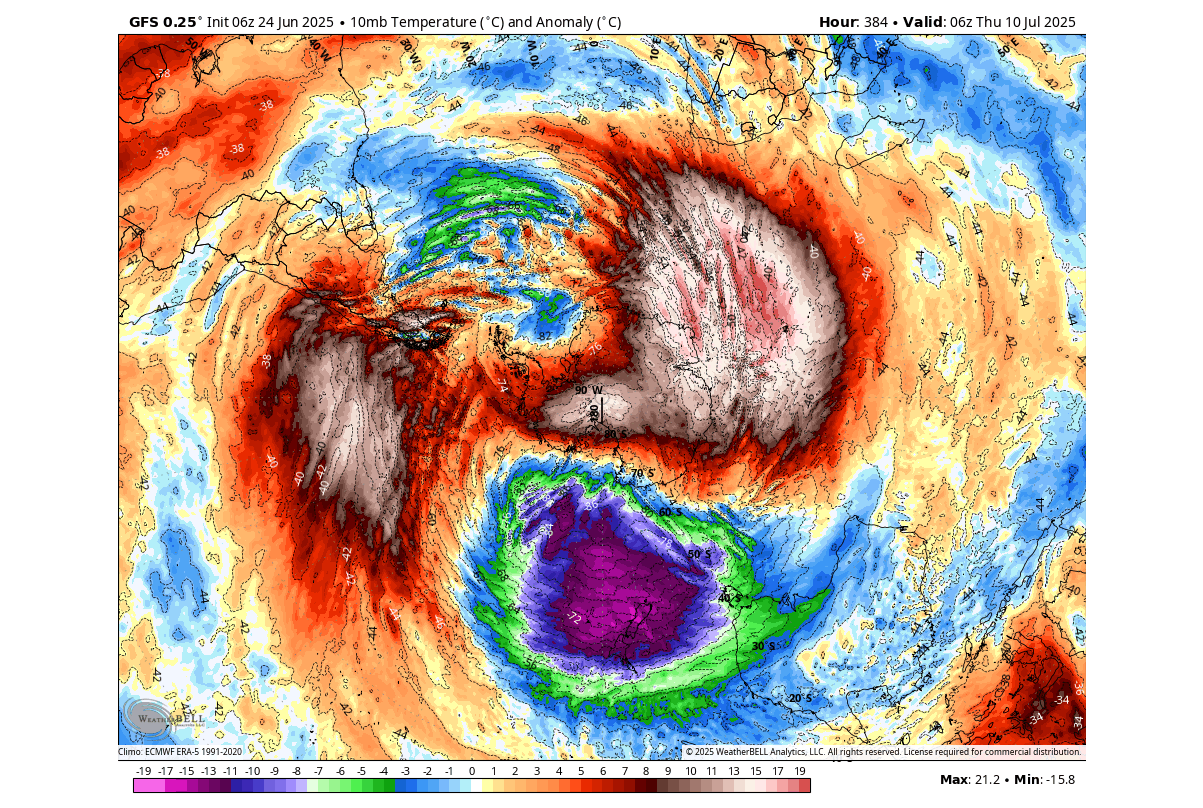
If we look at the temperature anomalies in the mid-stratosphere for the same period, you can see a much more evolved warming wave. Above normal temperatures are forecast to spread across the polar regions and displace the main cold core of the Polar Vortex.
We can also look further down in the stratosphere, at its lower 50mb level (19km/12miles), where you can clearly see the stratospheric warming anomaly. It’s not that often that a warming wave in the upper levels of the stratosphere reaches further down. So this is an indication of a strong warming event.
We also produced a video from the forecast images provided by WeatherBell (using a commercial license) to show what this whole process looks like in the forecast. Video shows the stratospheric temperature anomalies from the NCEP GFS model.
You can see the spinning of the Polar Vortex, and the attack of the frequent stratospheric warming waves around it, getting stronger over time.
EXTENDED RANGE POLAR VORTEX FORECAST
Below is the ECMWF extended ensemble forecast towards mid-July. This forecast shows the temperature anomaly in the southern stratosphere. As you can see, the stratospheric warming anomaly will continue well into next month, keeping a stable warming wave over the eastern half of the Polar Vortex.
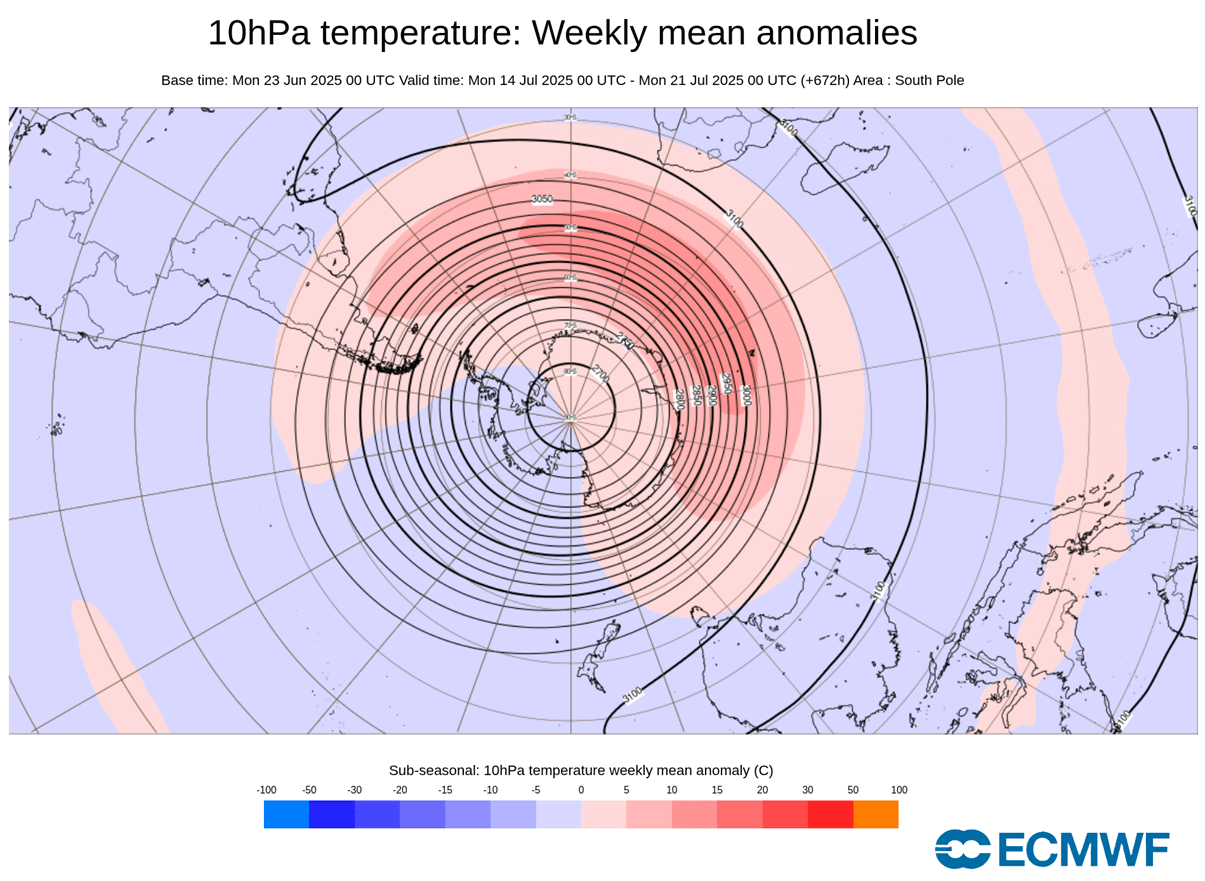
In the extended range forecast, we can also look at the stratospheric forecast trend for the second half of July. Below, you can still see the active warming wave, covering more than half of the outer Polar Vortex. Overall, this is a pretty significant stratospheric warming event over the southern hemisphere, forecast to last a while.
At this point, you are probably wondering what all this means for our daily weather. And rightfully so, as these events do have a known connection to the global weather system.
GLOBAL WEATHER SYSTEM REACH
So, why would you care about a stratospheric warming event over the South Pole if you live in the Northern Hemisphere? In the image below, you can see a simple schematic of the global air circulation between the two hemispheres. There is much more flow and dynamics in the Winter hemisphere, while the Summer hemisphere is always calmer.
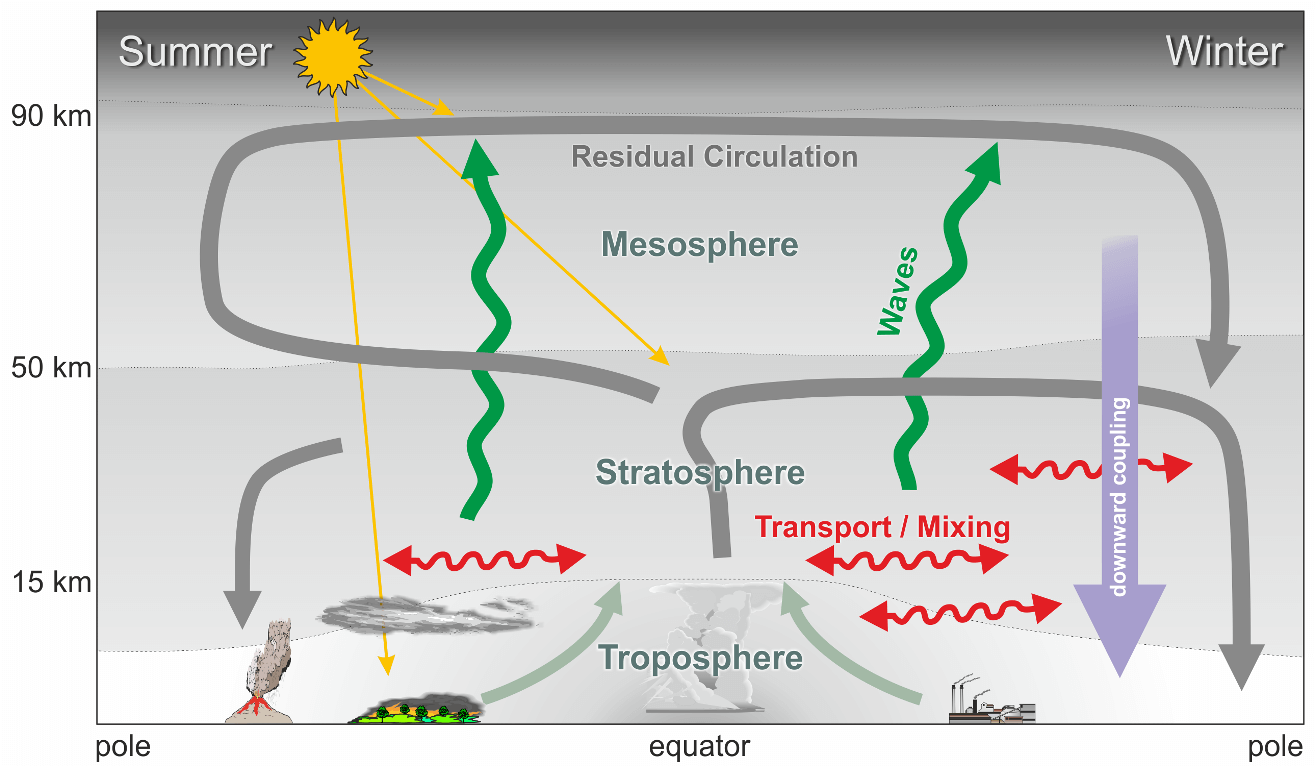
This is called the “Brewer-Dobson circulation“, and connects the circulation from both Hemispheres higher up in the atmosphere. In reality, it is far more complex, but this simple schematic shows the main idea of airflow and energy transfers.
This basically shows that the northern and southern stratospheres are interconnected on many different levels.
Below are interesting graphics from a study by Goncharenko, L. & Harvey, V.L. & Greer, Katelynn & Zhang, Shun-Rong & Coster, Anthea & Paxton, Larry. It is about the stratospheric warming event in 2019 over the South Pole. The graphics show the change in Total Electron Content (TEC) in the Ionosphere over the United States.
The image shows the Ionospheric anomaly over the United States following the strong stratospheric warming event over the South Pole. Strong 40-80% anomalies in electron charge were observed in the ionosphere over the United States.
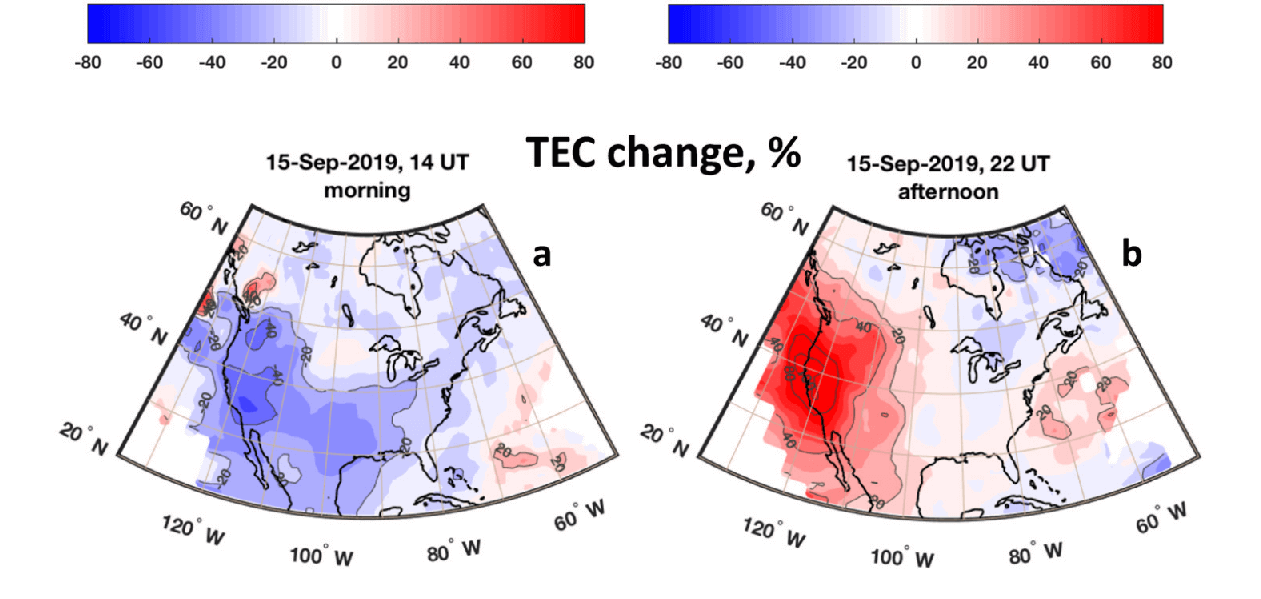
The same but reversed change was observed over Europe, as the energy wave from the strong Stratospheric warming event had already reached the Northern Hemisphere.
Overall, this study found both positive and negative disturbances in the thermospheric Oxygen/Nitrogen ratio and total electron content over the United States and Europe.
Direct weather changes were observed following this strong event in the higher and lower atmospheres. Signs have also emerged that the event was strong enough to have a weather effect on the following Winter 2019/2020 in the Northern Hemisphere.
It is not easy to track these changes and impacts, as a lot gets lost in the complex global weather circulation. But in the image below, you can see a simple connection between the south pole pressure anomalies from August to October and the following temperatures over the Northern Hemisphere in December to February.
This shows a signal between prolonged high-pressure anomalies over the South Pole during the August-October period and colder temperatures over the United States the following December-February. A stratospheric warming event can greatly enhance prolonged high-pressure anomalies over the South Pole in this period.
There is a large caveat here: This correlation/signal does not mean that the high-pressure anomaly over the South Pole is directly responsible for the lower temperature signal over the United States the following winter. It just indicates some connection, but it can’t explain what exactly it is.
A large-scale event like a stratospheric warming can cause a prolonged high-pressure anomaly over the South Pole. After several weeks to months, some effects of the SSW event could manifest in the Northern Hemisphere, via the global weather system.
We will keep you updated on the global weather pattern development, so bookmark our page. Also, if you have seen this article in the Google App (Discover) feed, click the like button (♥) there to see more of our forecasts and our latest articles on weather and nature in general.