A major stratospheric wind reversal is now appearing in the latest forecasts, signaling a final collapse of the Polar Vortex as we head into March. Models also reflect this with an atmospheric breakdown, creating a special cross-polar weather pattern that will impact the United States, Canada, and Europe.
This forecasted disruption is set to trigger a full Polar Vortex split, dividing the high-altitude circulation into two distinct cores. Current data shows one of these broken cores moving toward North America, keeping a colder airmass close to the United States and Canada, with cold spills already forecast.
In this article, we will look at the upcoming wind reversal in the stratosphere and the full Polar Vortex collapse. Also, we will analyze the resulting stratospheric split and the weather impacts over North America and Europe as a disrupted circulation continues into early Spring.
Polar Vortex: Understanding the High-Altitude Winter Engine
Our main goal is always to share weather information and forecasts and to explain complex weather phenomena like the Polar Vortex in simple terms. As we approach the end of the winter season, monitoring the Polar Vortex becomes even more critical, as its final breakdown can dictate the weather patterns well into early Spring.
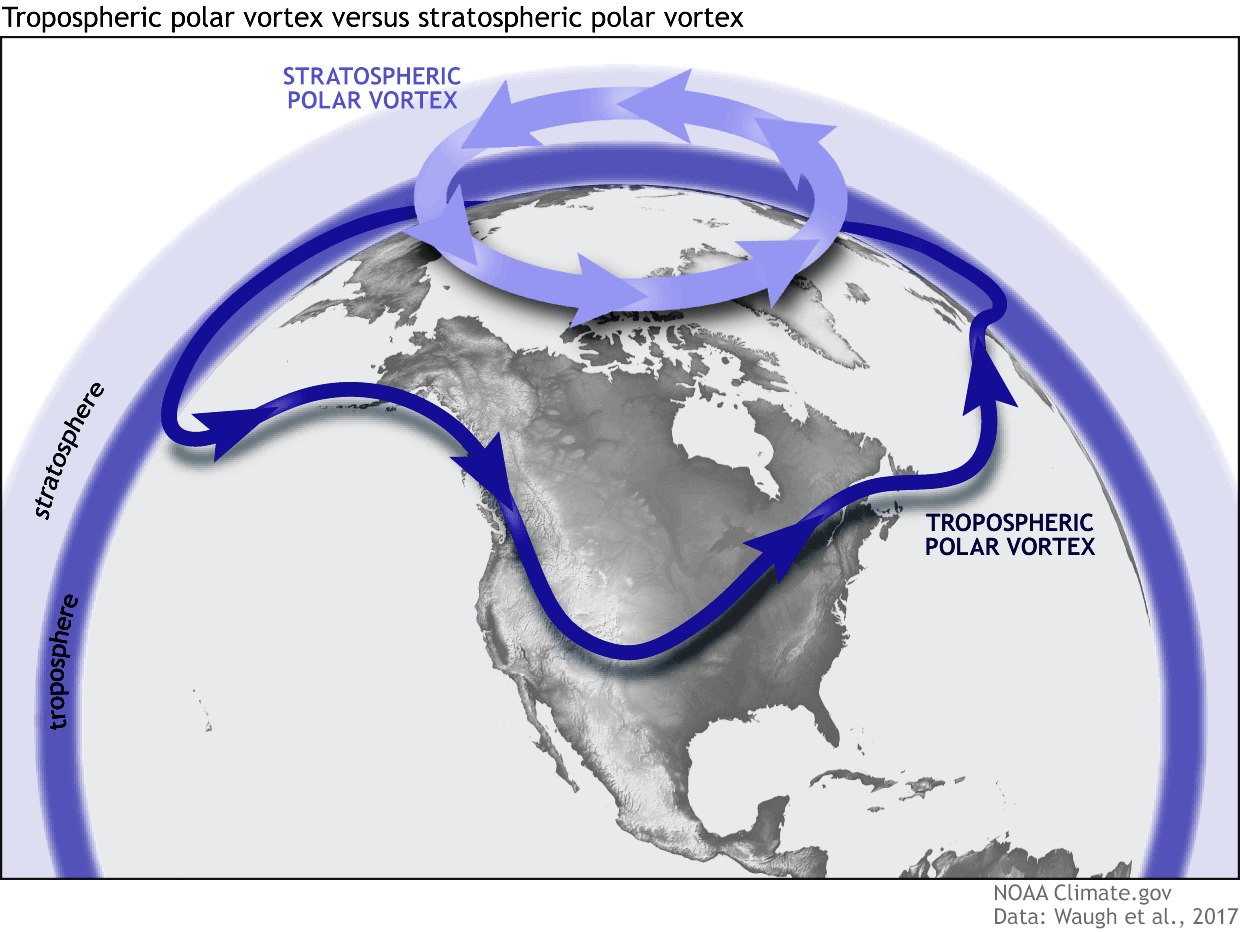
In simple terms, the Polar Vortex is a broad winter circulation over the northern (and southern) hemispheres. You can imagine the Polar Vortex as a spinning wall over the polar regions, rising from the surface into the stratosphere (over 50km/30 30miles high), trapping the cold polar air inside.
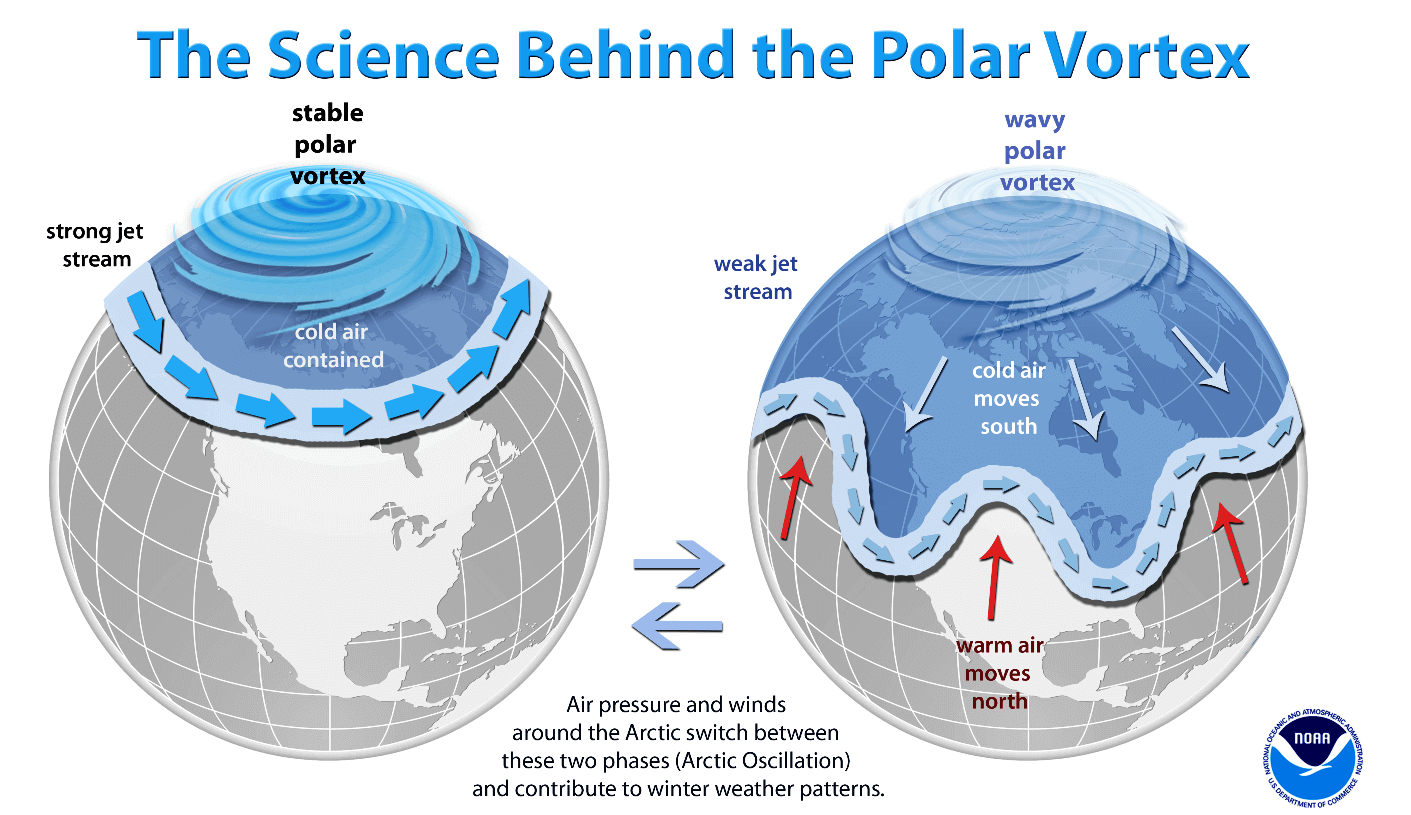
The Polar Vortex is divided into two layers: the stratosphere (higher altitude) and the troposphere (lower altitude). These two layers are interconnected but often behave differently. A strong, stable Polar Vortex acts like a cage, locking the coldest air near the North Pole and bringing milder conditions to the United States and Europe.
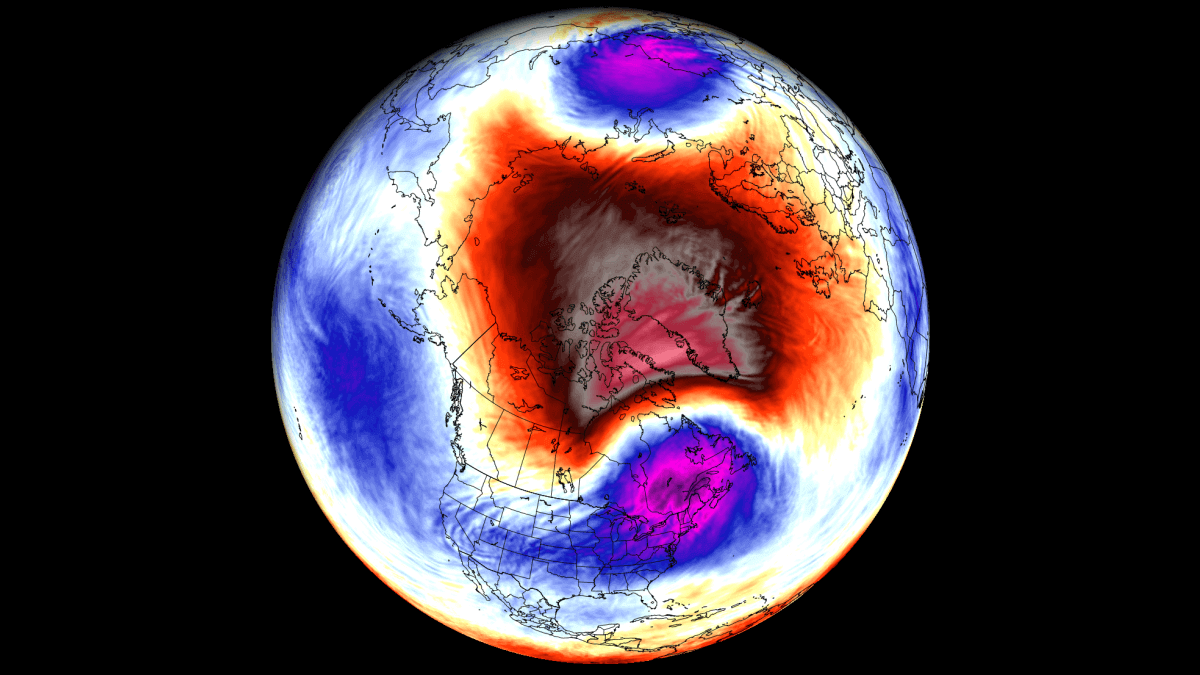
When the Polar Vortex is disrupted or “collapses,” the cage breaks, allowing cold Arctic air to spill southward into the mid-latitudes. However, as we move into late winter, the dynamics change. The Polar Vortex naturally weakens as the polar regions receive more sunlight. Below is an example from NOAA of how a disrupted Polar Vortex releases cold polar air into the United States or Europe.
If you like cold winter weather across the United States, Canada, or Europe, this weak/disrupted Polar Vortex is exactly what you want to see. But a disrupted Polar Vortex does not guarantee cold in every single area of the mid-latitudes.
The disruption usually arises from a rise in stratospheric pressure and temperature, known as a Stratospheric Warming (SSW) event, or from other dynamics.
To show the Polar Vortex in its true form, we produced a high-resolution video below that reveals its 3D structure. This video shows the disruption of the Polar Vortex structure from a Stratospheric Warming event earlier this month.
But in the coming days, the forecasts show a final breakdown of the Polar Vortex, marking its seasonal end, until the next Winter season.
The Road to Collapse: Tracking the Forecasted Polar Vortex Path
When tracking the strength of the Polar Vortex, we usually look at the wind speeds around the polar circle. A strong positive (westerly) wind indicates stable conditions or a strong Polar Vortex, but weak or even negative (easterly) winds indicate a complete reversal and a breakdown of the Polar Vortex.
Below is the latest analysis and forecast of the mid-stratospheric winds around the Polar Vortex. Lines show some of the most recent forecasts, indicating the collapse and wind reversal of the stratospheric Polar Vortex.
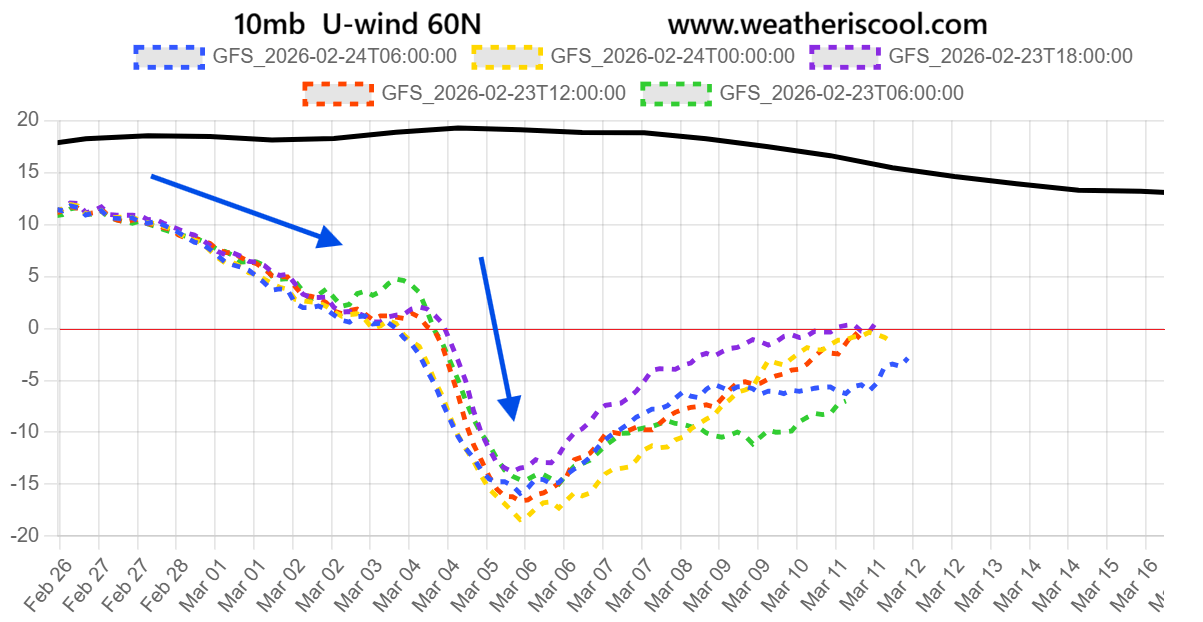
The stratospheric wind reversal is forecast to start in the first days of March. There is some tendency to recover later in the month, but this likely marks the end of the stratospheric Polar Vortex, collapsing from the top down.
Below is the latest analysis for the mid-stratosphere at the 10mb level (30km/18.5miles height). The Polar Vortex is elongated, and with a continuous warming wave around it. The main cold core is weak and displaced, with a high-pressure area pushing in from the North Pacific.
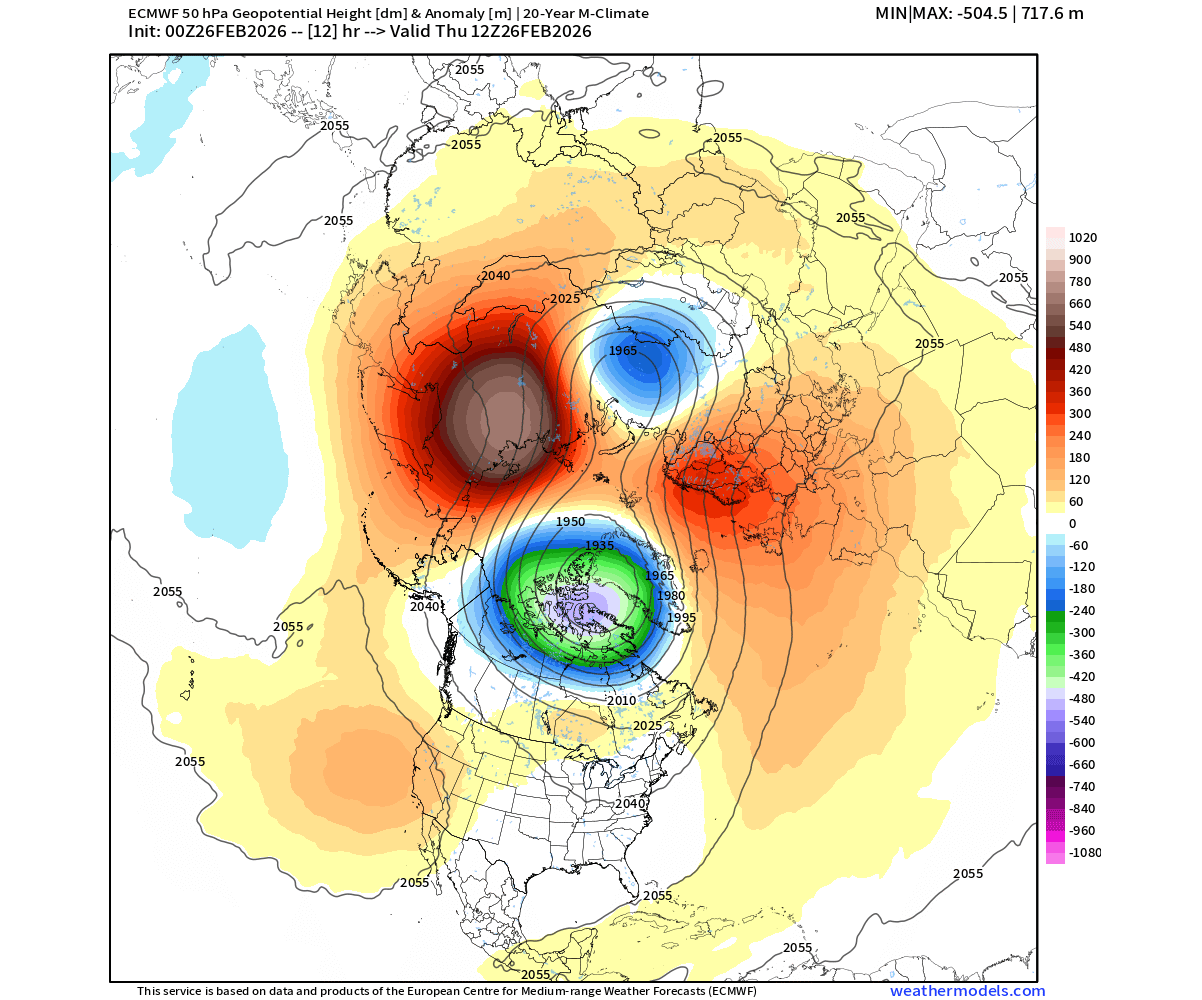
The image below shows the pressure anomaly for the lower stratosphere at the 50mb level (20km/12.4 miles). We see two high-pressure areas, which are already splitting the lower Polar Vortex core, with the main core side being pushed towards the North American side.
The best practical example for this type of event is a balloon, which elongates when squeezed or forms two bulges.
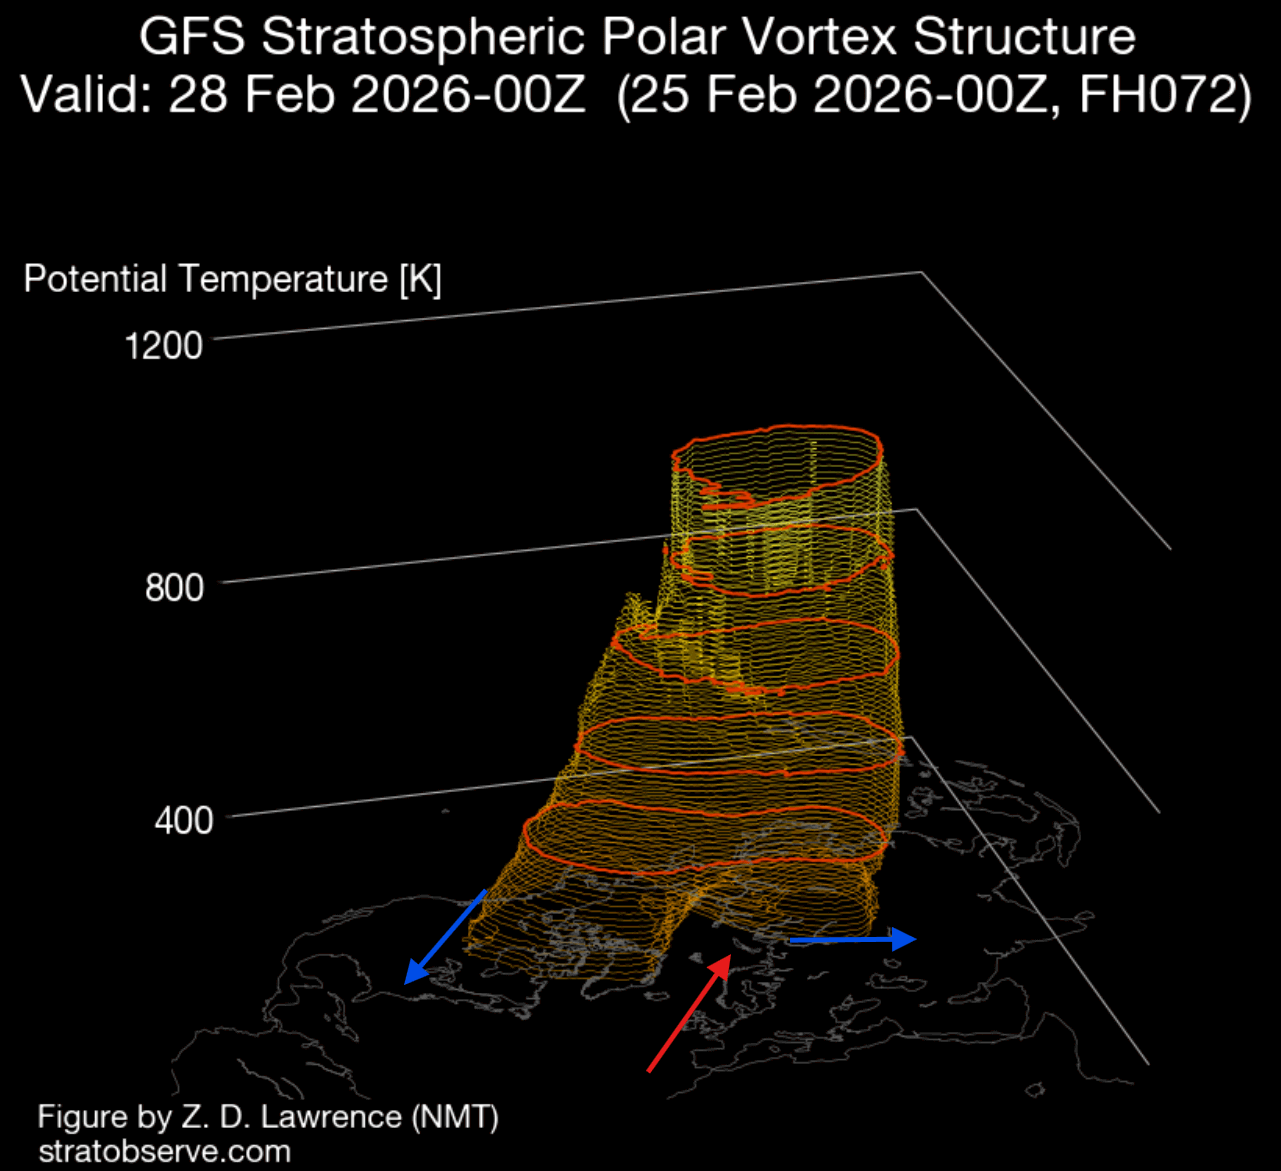
This ongoing deformation can be seen in the Polar Vortex 3D analysis below. High-pressure areas are compressing the Polar Vortex, elongating its structure. This causes the lower Polar Vortex core to split and push one of its “feet” towards North America, having a local weather impact in the United States, but also across the Atlantic in Europe.
Looking at lower pressure levels, the day 1-5 forecast below shows a disrupted Polar Vortex pattern, reflecting the 3D analysis above. You can see the main low-pressure area sits over Canada, connected to the same lower stratospheric core at the 50mb level.
This has two major weather impacts. One is the transport of colder air across Canada and into the northern and northeastern United States. The second impact is helping to build a high-pressure zone over Europe, bringing warmer-than-normal temperatures to the continent.
The surface temperature forecast for the coming days shows a cold air anomaly over Canada. This cold air is also pushed into the northern and northeastern United States, reaching into the north-central parts, also covering the Midwest. The lowest temperatures are forecast over the upper Midwest and the northeastern U.S., reaching near zero F, or even negative single-digits over the northeast.
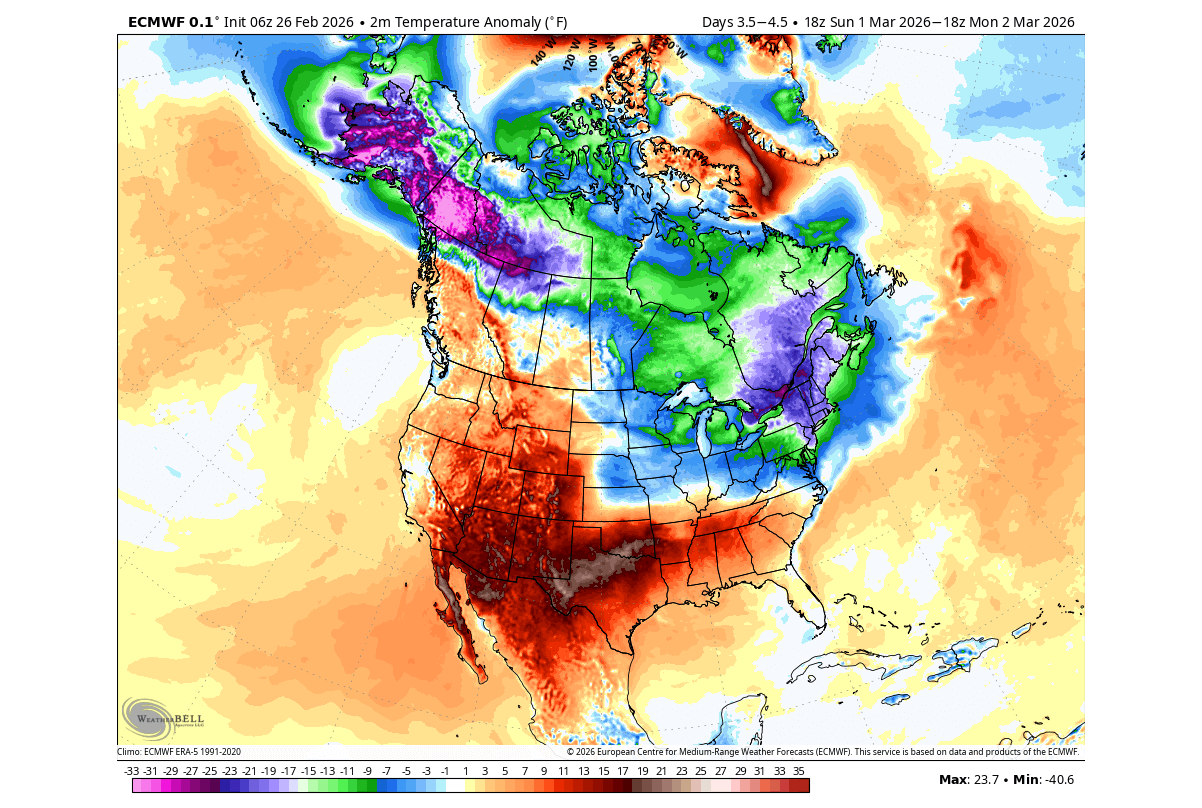
This map nicely shows the widespread impact that a Polar Vortex core can bring, also seen several times this season.
This polar airmass will bring winter weather to much of the northern and northeastern United States, and also across the northern and central Plains. In the image below, you can see the forecast for the Winter Storm Severity Index for days 1-3, based on official NOAA data. It already shows the coverage of expected winter weather, but does not yet cover the full extent expected on days 4-5 in the northeast.
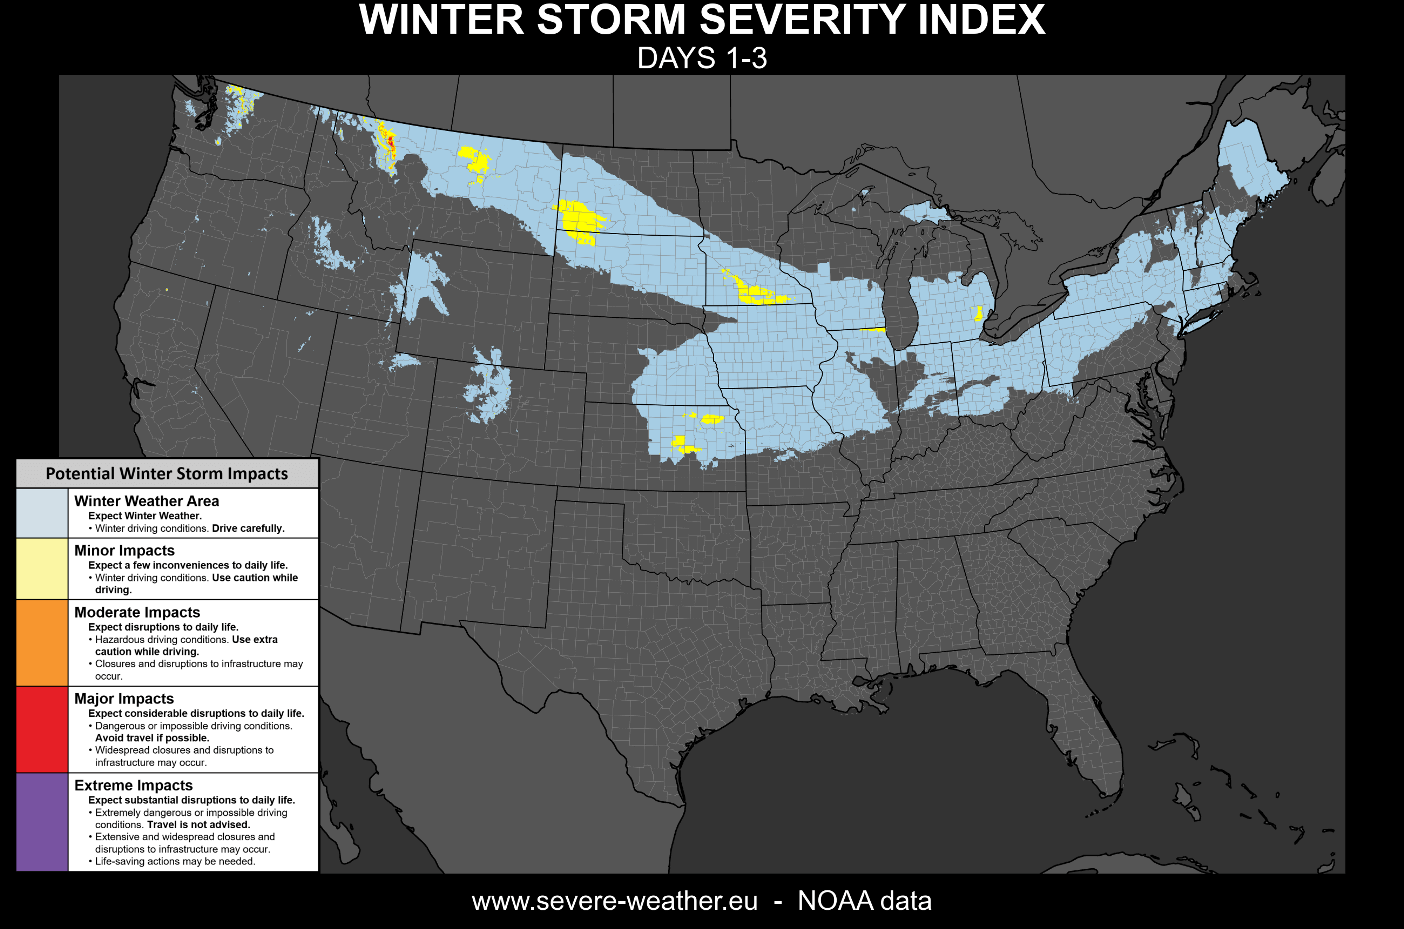
This index shows combined winter weather impacts with precipitation and strong winds. But its lowest level also shows the general coverage of expected winter weather conditions.
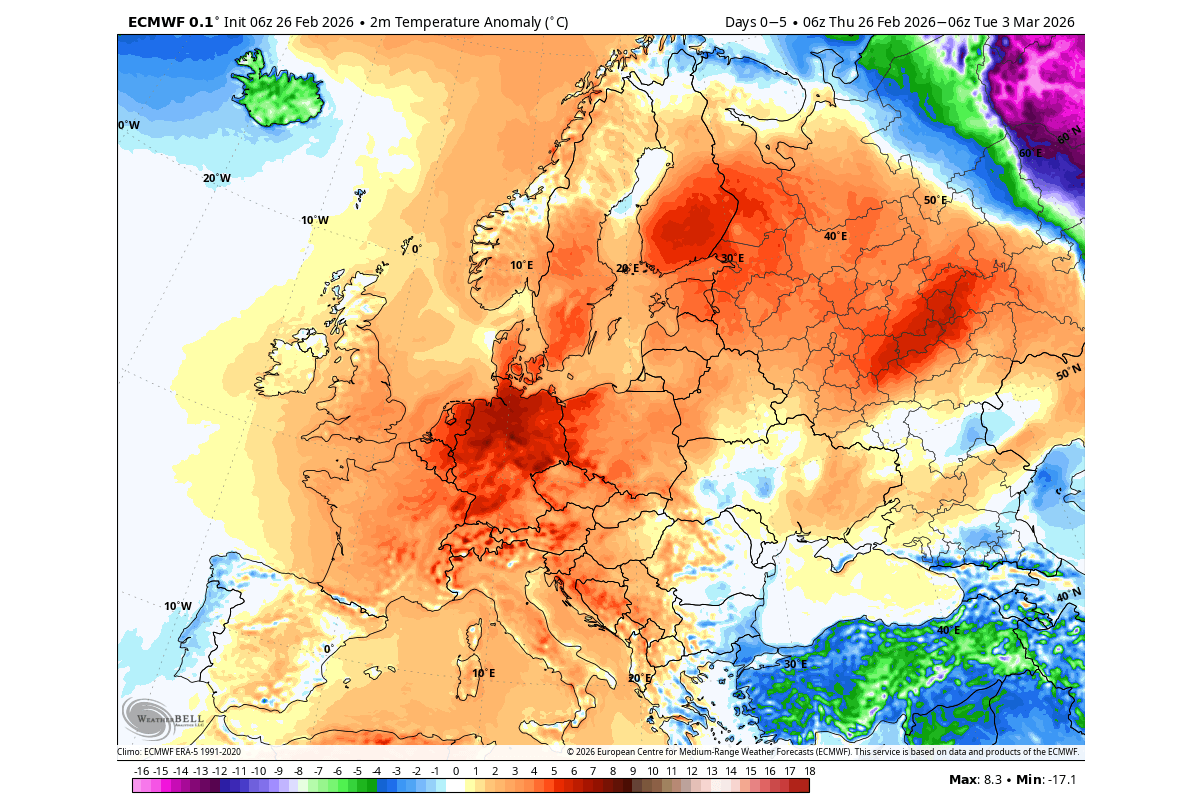
As mentioned, the Polar Vortex core over North America helps to build a high-pressure area in Europe. The forecast also shows a warmer airmass spreading over the continent in the coming days, with the cold being pushed far towards the north and east, but transporting back down into the far southeastern parts.
All this will lead up to the final major event of the season in the stratosphere, a final collapse of the Polar Vortex.
The Weather Finale: A Major Stratospheric Warming and Wind Reversal
A stratospheric warming event is when the pressure and temperature rise in the stratosphere, disrupting or fully collapsing the Polar Vortex. These events can also split the Polar Vortex, creating a major weather shift in the surface levels, but this can depend on the time of year.
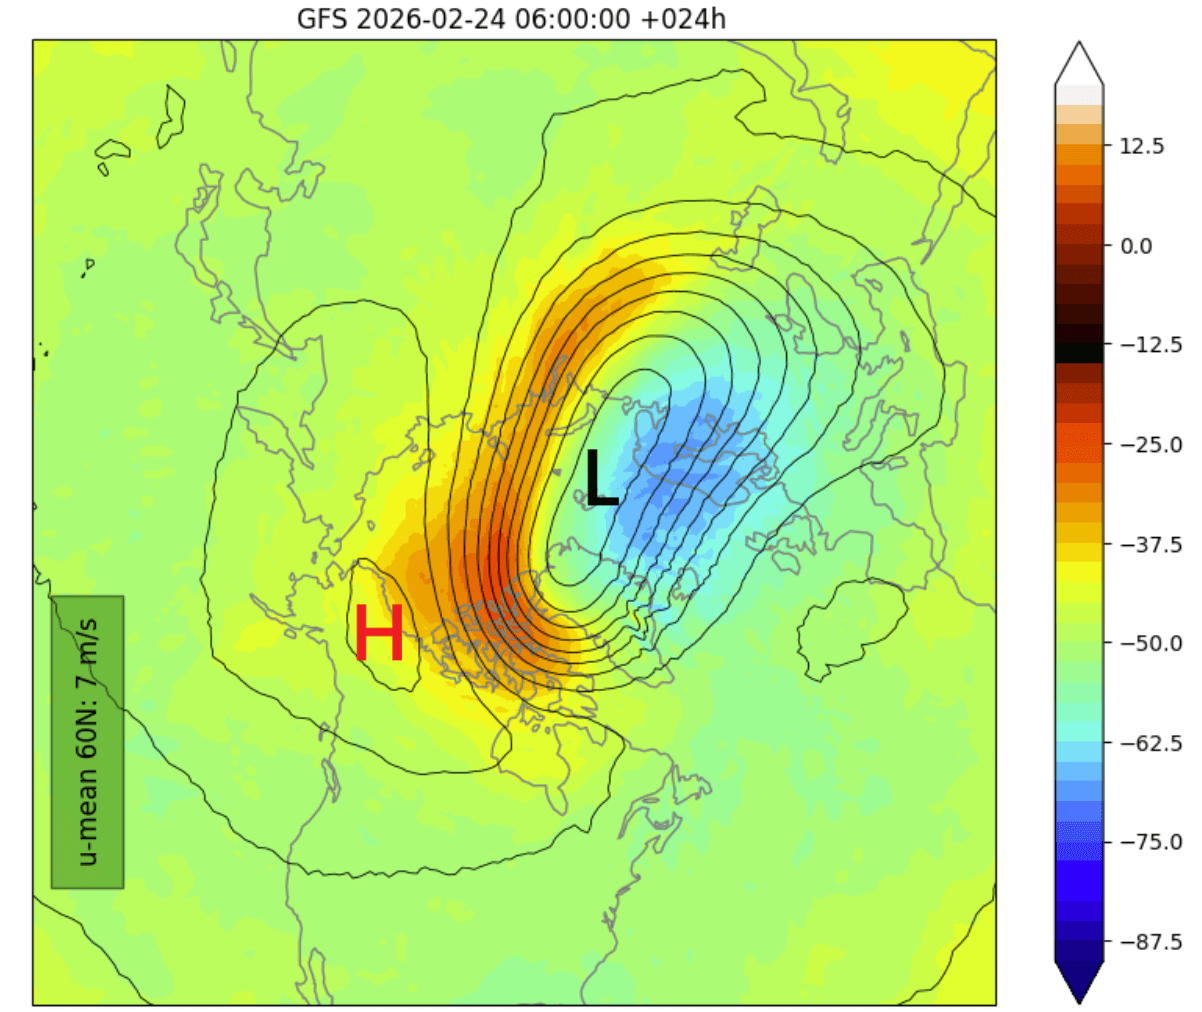
Below is the day-7 pressure and temperature forecast in the stratosphere at the 10mb level (30km/18.5miles height). You can see two low-pressure areas (L) of the Polar Vortex, split apart by the stratospheric high-pressure anti-vortex (H) and the warming anomalies.
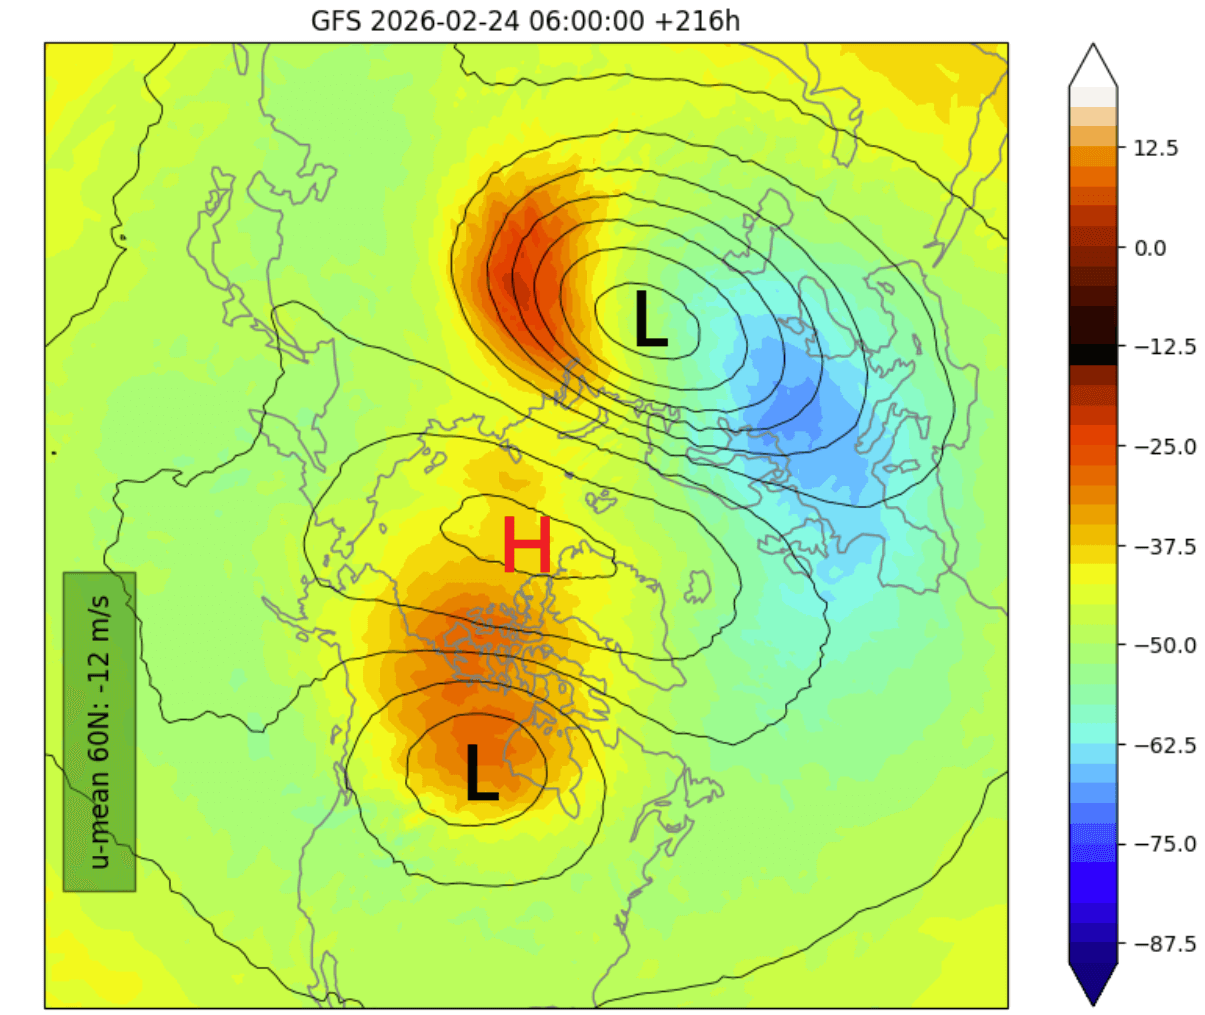
The wind data in the image shows -12m/s, which means the stratospheric polar winds are completely reversed, indicating a breakdown of the stratospheric polar circulation.
The full extent of the stratospheric warming event is revealed if we look at the temperature anomaly, which shows how much warmer the stratosphere is compared to normal. Below is the day-8 forecast for the same 10mb level, and it shows a polar warming wave, with temperatures peaking over 20 degrees C above normal.
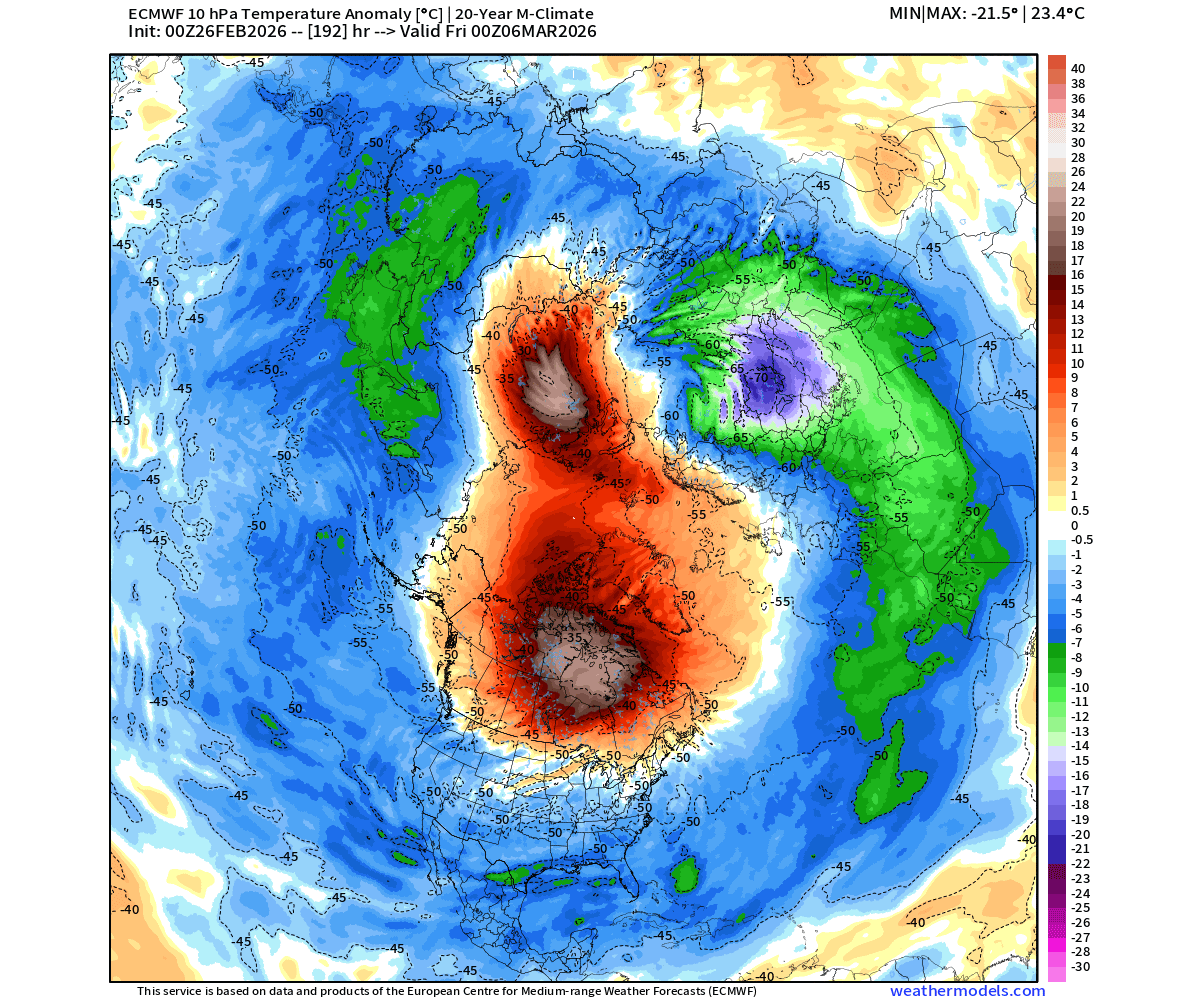
The pressure and temperature anomalies in the stratosphere show a proper stratospheric warming event, confirmed by the Polar Vortex wind reversal.
This breakdown of the Polar Vortex is much better seen in the 3D forecast below. You can see the split structure of the Polar Vortex broken into two main vortices. One core of the Polar Vortex is pushed into Siberia, but one broken core will move towards North America.
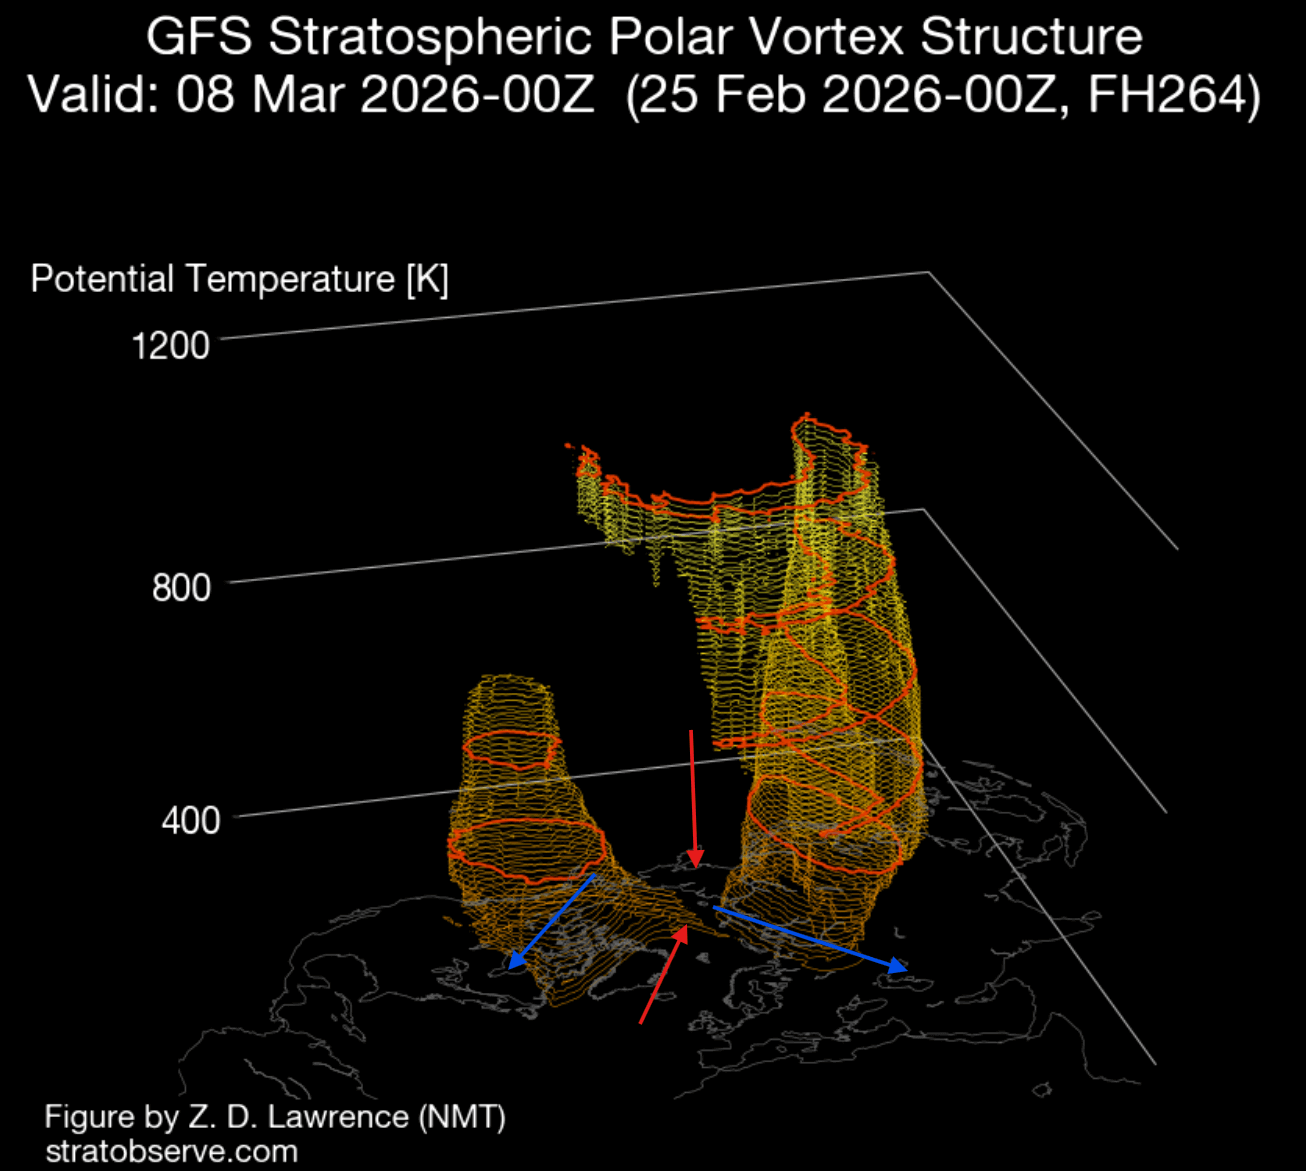
These separate Polar Vortex cores usually come with a northerly cold airmass and a polar flow, while warmer air can rise towards the polar regions. This is what is known as a disrupted polar circulation.
In the forecast graphic below, you can see the wind direction/speed forecast for the stratosphere at the 50mb level. In normal conditions, there is just one large circle/circulation. But here we see full separation of the Polar Vortex into two separate cores, also known as subvortices. Of main interest for us is the core that’s sitting over North America.
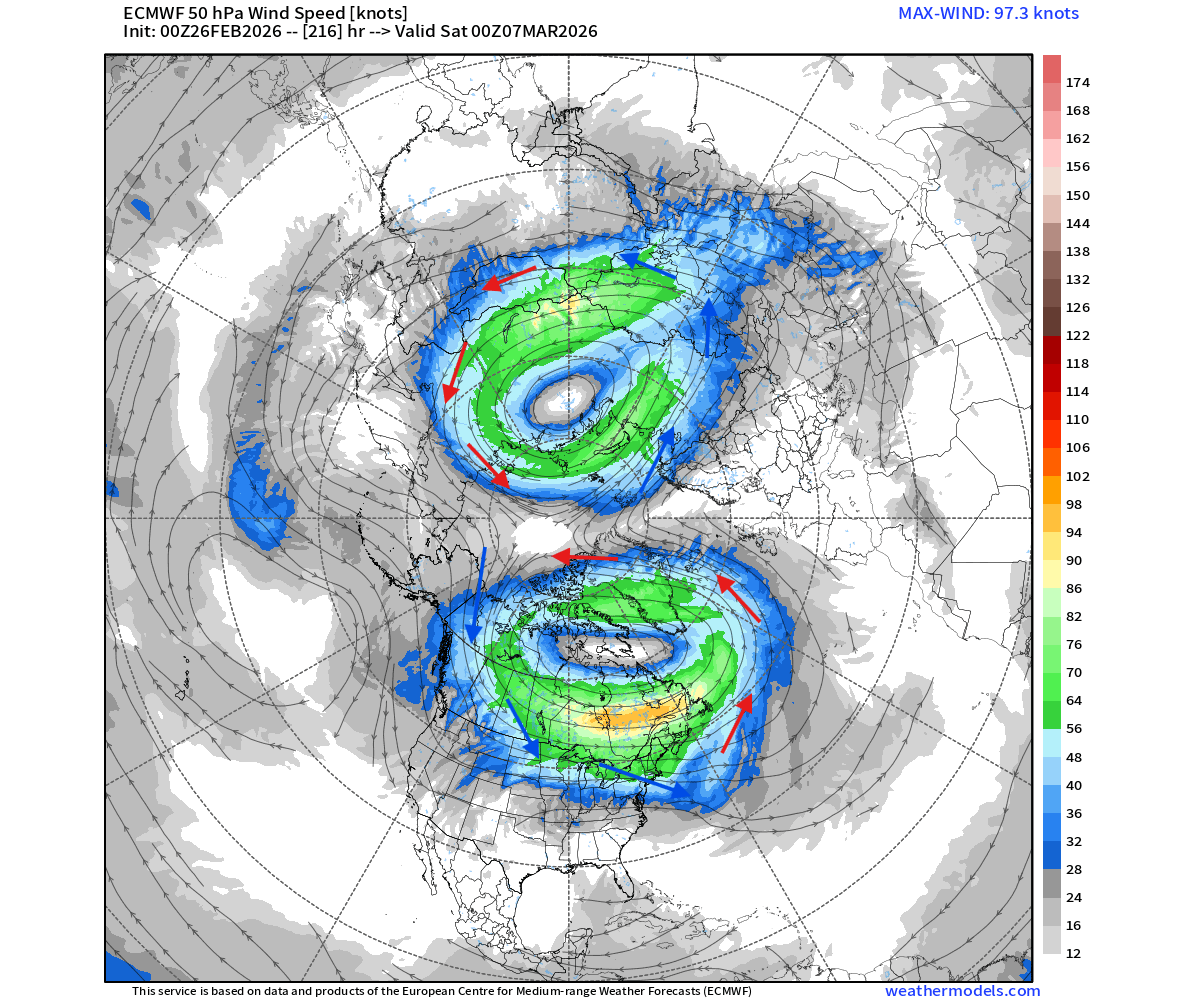
While this is in the lower stratosphere, there are still several kilometers/miles to the surface and the weather impacts. But this is near the levels where it’s reflecting into the weather circulation, and vice versa.
The image below shows a vertical structure of the atmospheric pressure anomalies, from the surface up to the top of the stratosphere. In the forecast part, you can clearly see the stratospheric warming event pushing downwards with a high-pressure anomaly. We can see hints of connection to the lower levels, which would bring impacts into mid-March. Image by Stratobserve
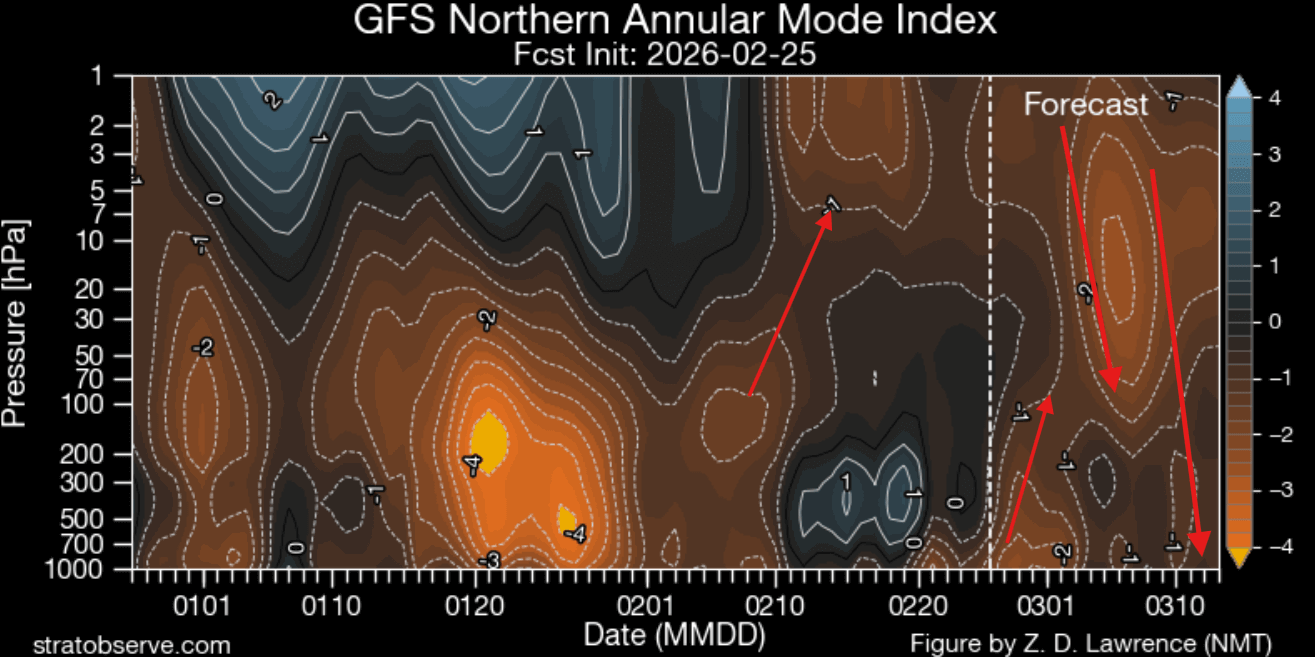
But even before we get to potential impacts, we can already see the vertical high-pressure anomaly connected to the lower levels, indicating a disrupted late-winter circulation at the time of the Polar Vortex core split. This can be seen in the weather maps, which show a rather unique cross-polar pressure anomaly pattern.
Atmospheric Disturbance: The Upcoming Late-Winter Cross-Polar Anomaly
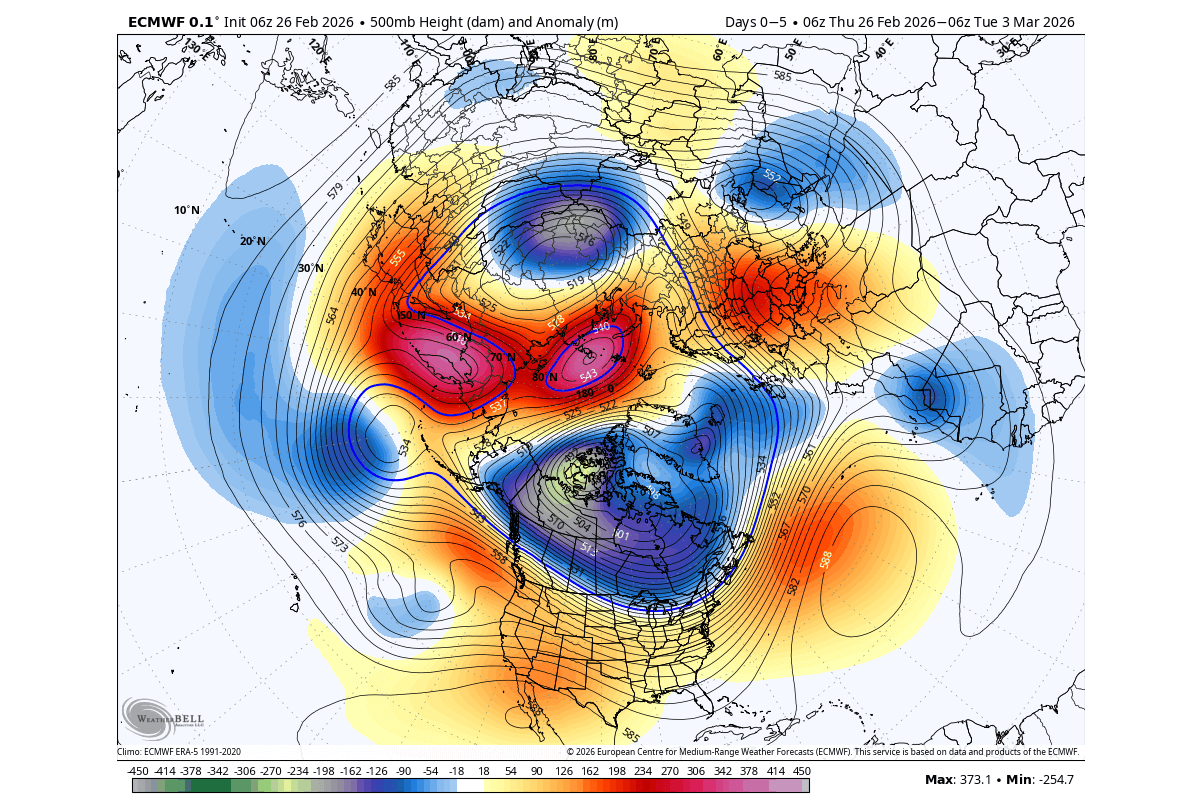
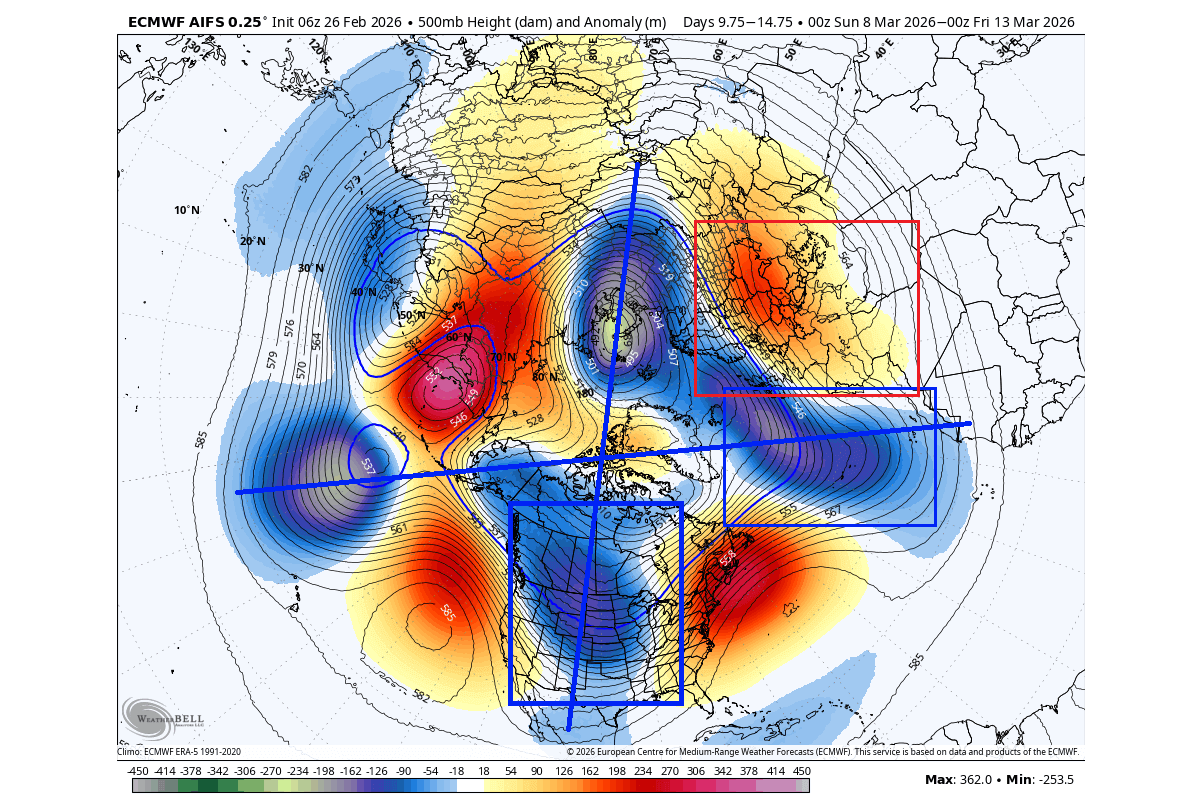
The pressure anomaly map below shows the weather patterns in the second week of March, and reveals a unique cross-polar pattern of low-pressure anomalies. The same pattern is for high-pressure areas, revealing a very disrupted circulation and a wavy jet stream. The two main pressure areas over the United States and Siberia are connected with the Polar Vortex subvortices.
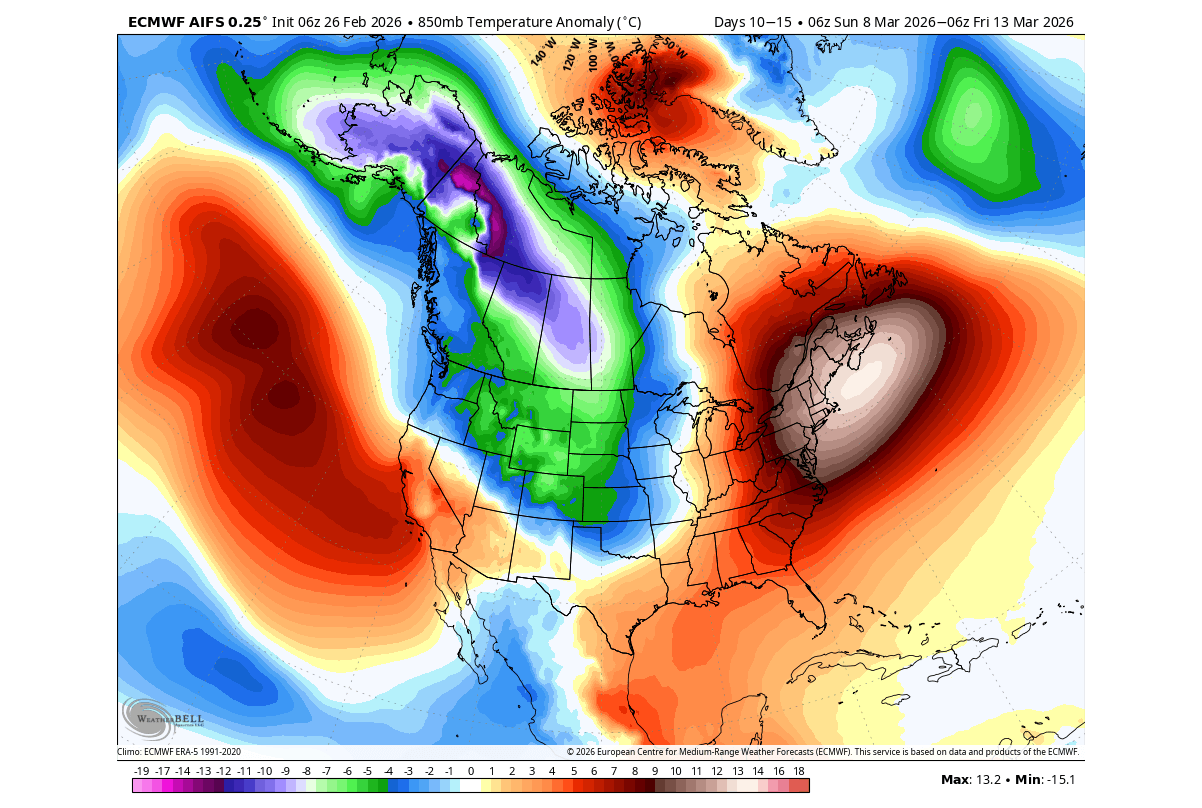
This causes a period of above-normal temperatures over much of eastern Canada and the United States. But due to the low-pressure zone over the central U.S., it brings a northerly flow and a colder airmass from western Canada into the northern, western, and west-central United States. The image below shows the airmass temperature anomaly, at the 850mb level (1.5km/5000ft).
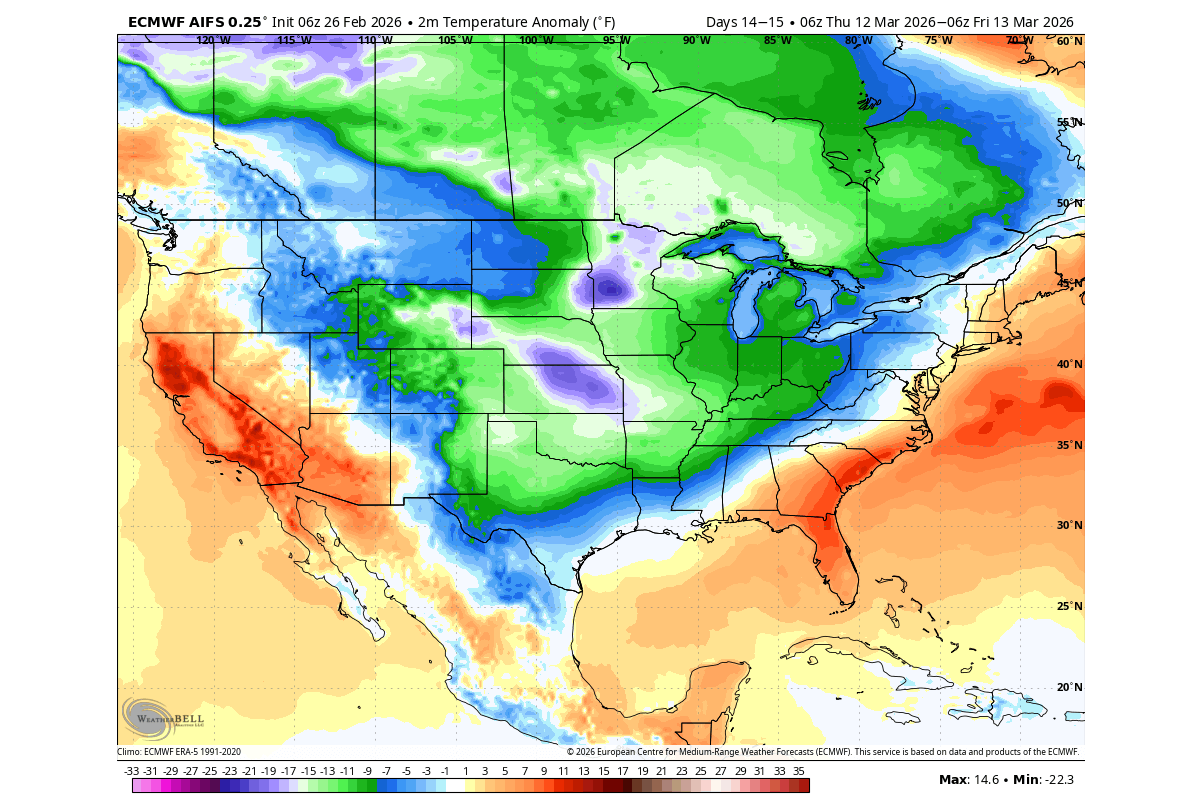
Looking at the latest surface temperature trends, this shows another potential spread of colder temperates in the second week of March. There is no coincidence that such an event would follow a split Polar Vortex core and a disrupted northern circulation. But this is just one model run, as an example of the potential weather outcome in such a global setup.
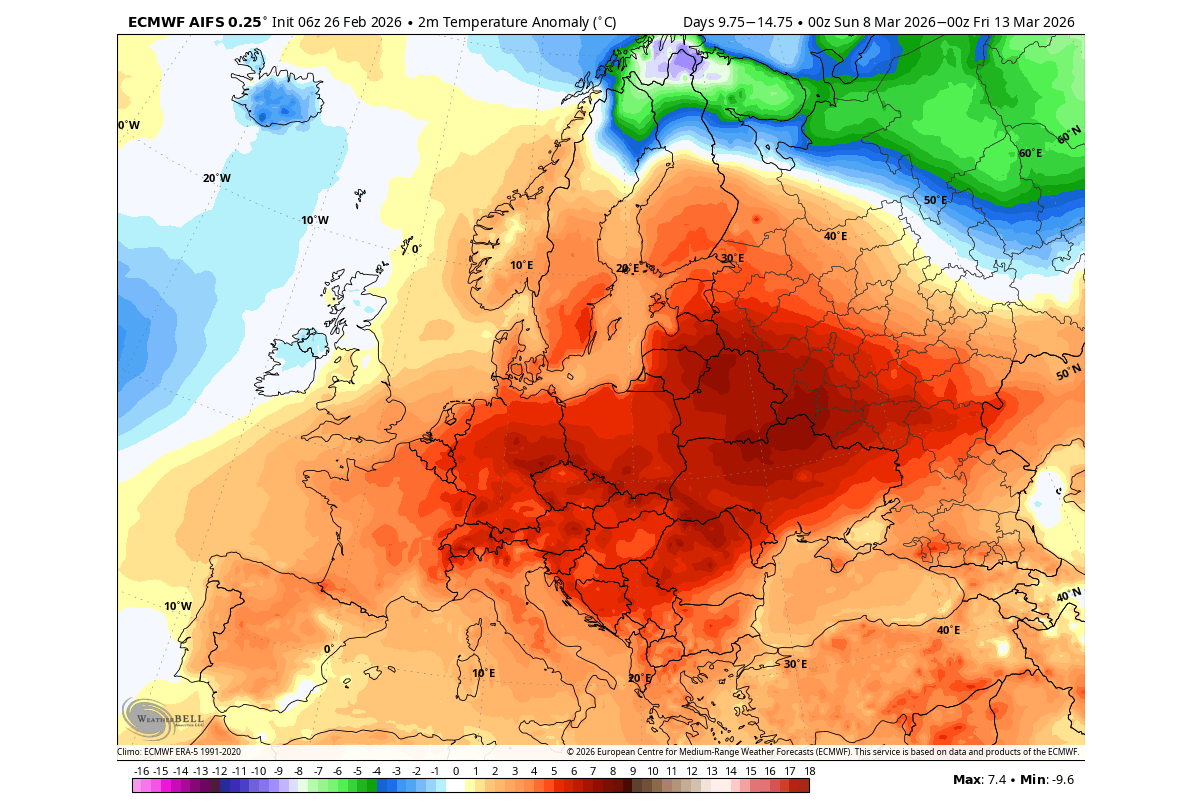
As we have seen many times this winter, a dominant low-pressure core over North America usually means a more westerly or southerly weather pattern over Europe. A high-pressure zone is likely over the continent, indicating a clear warmer trend for the first half of March.
This can change, depending on the final position of the Polar Vortex over Siberia. The core shifting further west can help bring a colder airmass closer to Europe, so we will monitor this in future updates.
We can already look at the latest extended trends, which will help reveal any real impact following the stratospheric disruption, as it can usually take longer for these events to impact the lower level in the low-frequency patterns.
The Early-Spring Outlook: Tracking the Surface Impacts Following the SSW Event
Below is a typical vertical schematic of how a stratospheric warming event works, from the CLS research groups at NOAA. The image shows pressure anomalies across the atmosphere over a typical SSW event, with 0 being the peak day of the event. You can see how the main event in the stratosphere affects the surface layers downwards with some delay, usually in the 10-30 day range, which would bring us into the early Spring period.
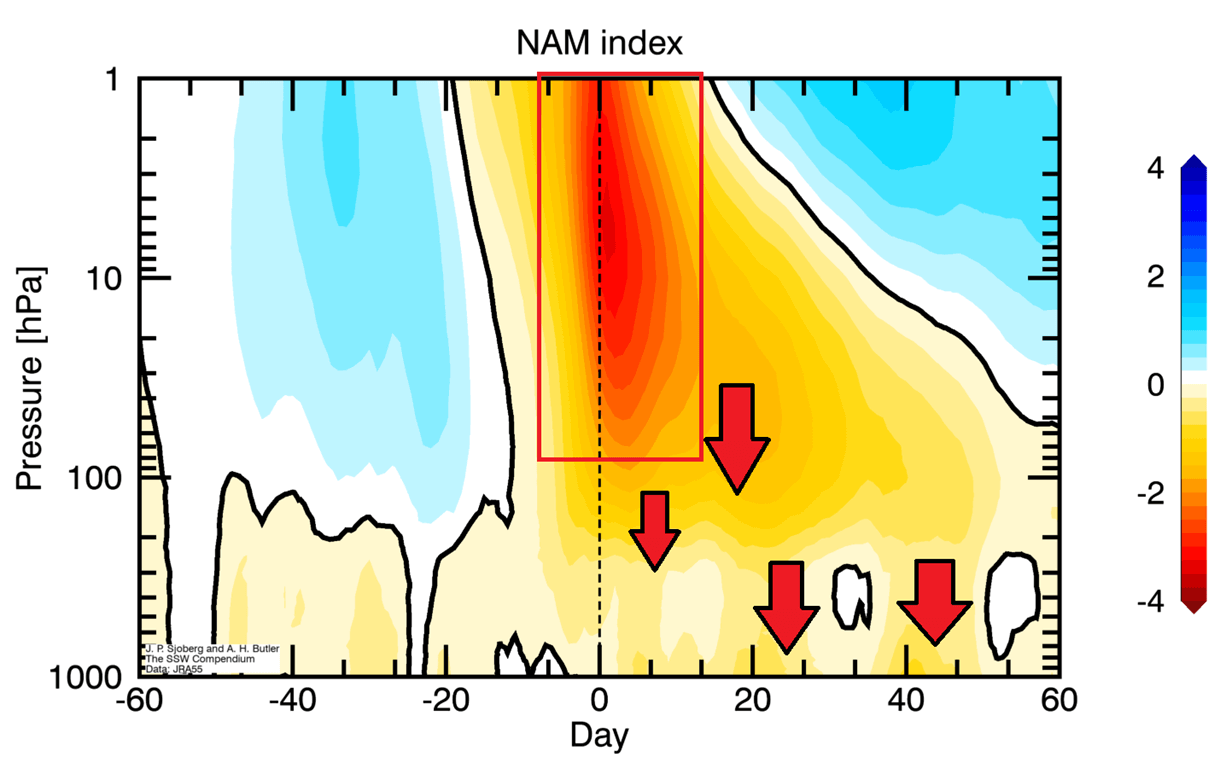
This is the range that we will look at with the extended range forecast data. But we have to add a disclaimer: The images below show the week 3-4 forecast trends. At this range, we do not look at daily hourly temperatures, but we look at the broad pressure anomalies across the Northern Hemisphere.
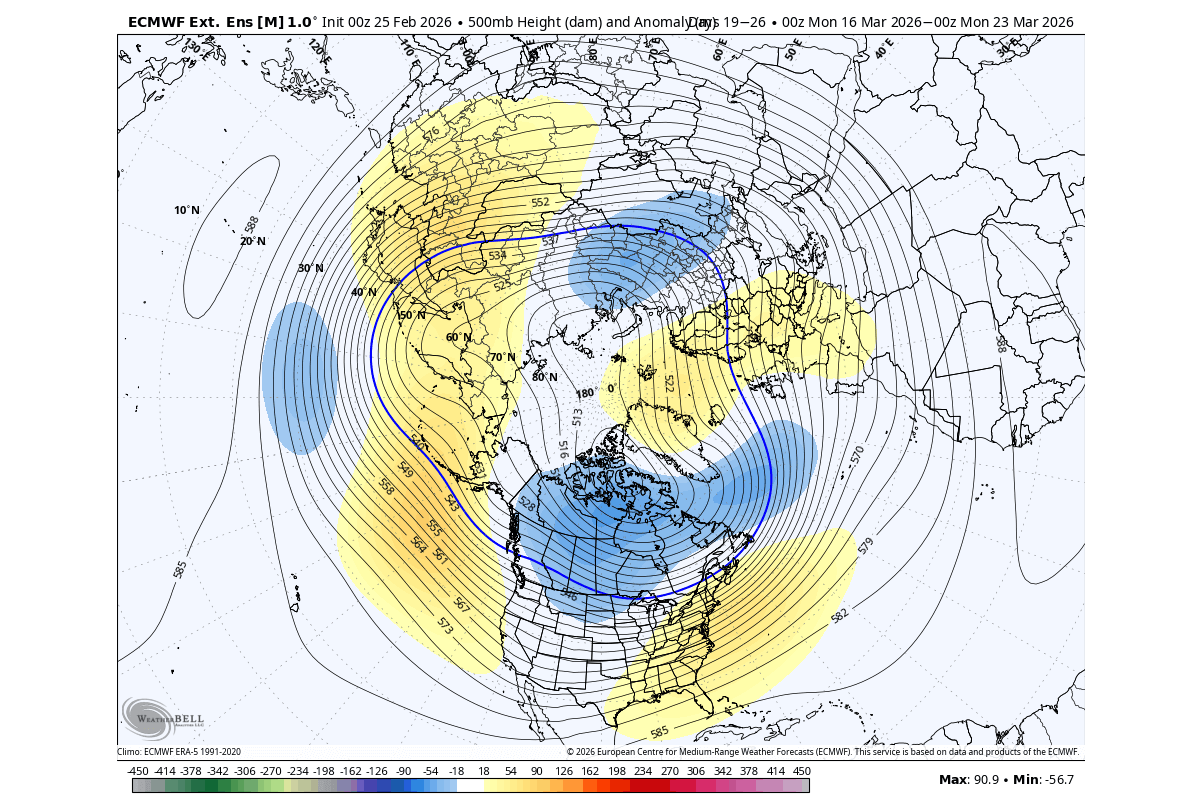
Looking at the March week 3 forecast, this takes us into the early Spring period. The ECMWF ensemble forecast shows continuation of the split-core pattern, with the continuous low-pressure zone over Canada. That brings a colder airmass to the western and central United States, and a warmer southerly flow to the east and southeast. It also continues a high-pressure zone over Europe.
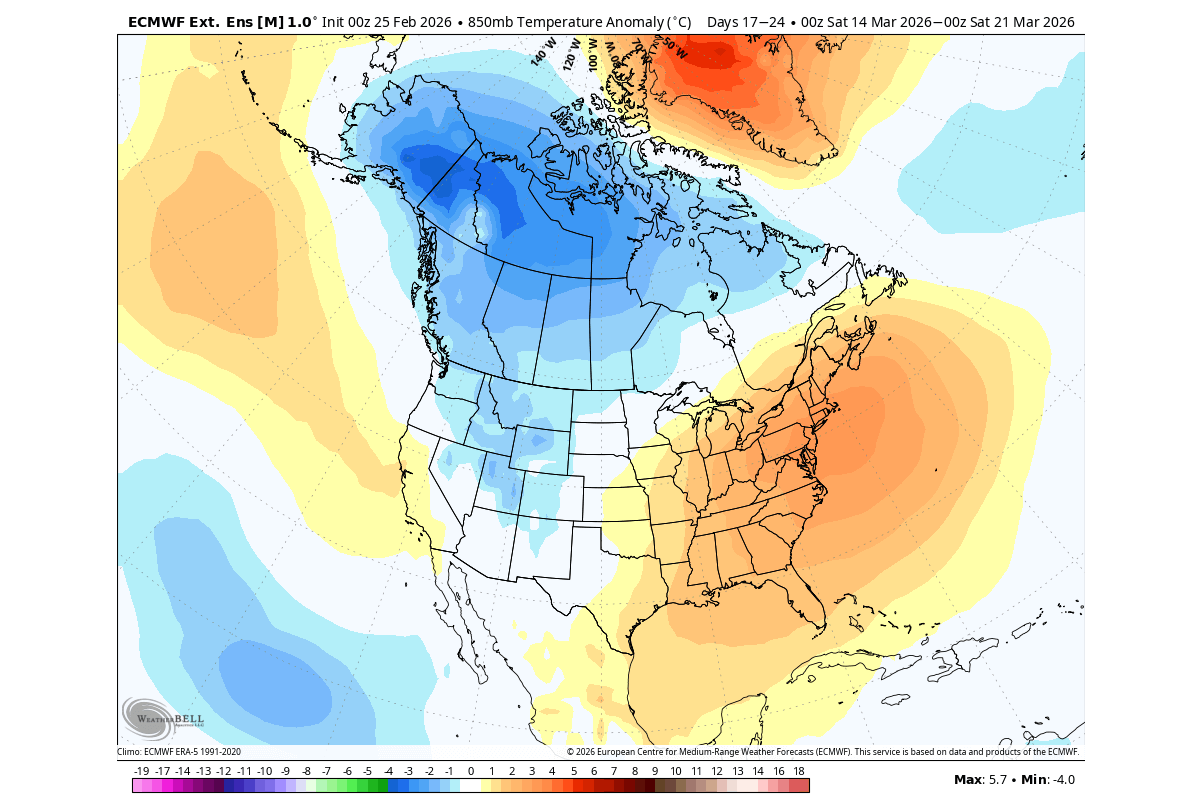
The airmass temperature anomaly forecast for this period shows a cold pattern across western Canada and the northern, western, and west-central United States. A warmer airmass is flowing into the eastern United States and southeastern Canada, but a low-pressure system moving across the northern United States can bring a transition period of colder air to the east.
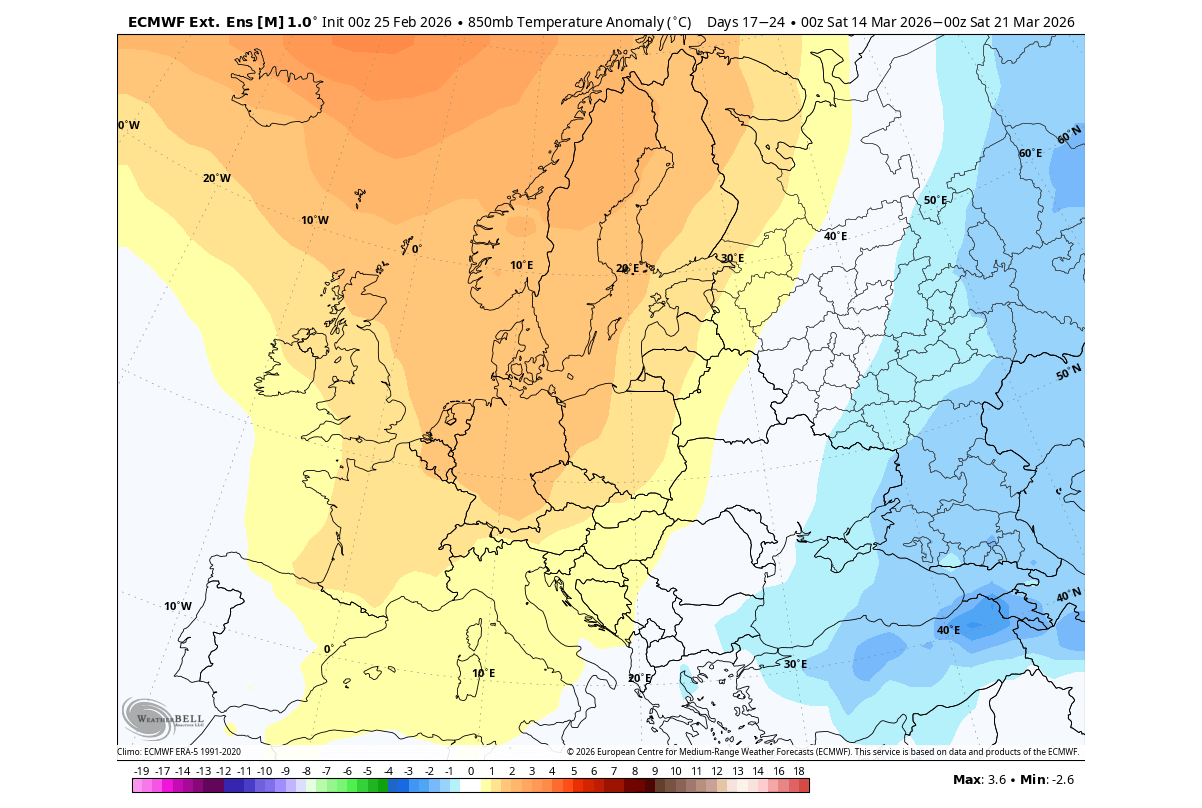
Across Europe, the temperature anomaly forecast for mid-March onward shows a warmer airmass over the western, central, and northern parts. But the trend forecast shows a drop of colder air is possible further to the east.
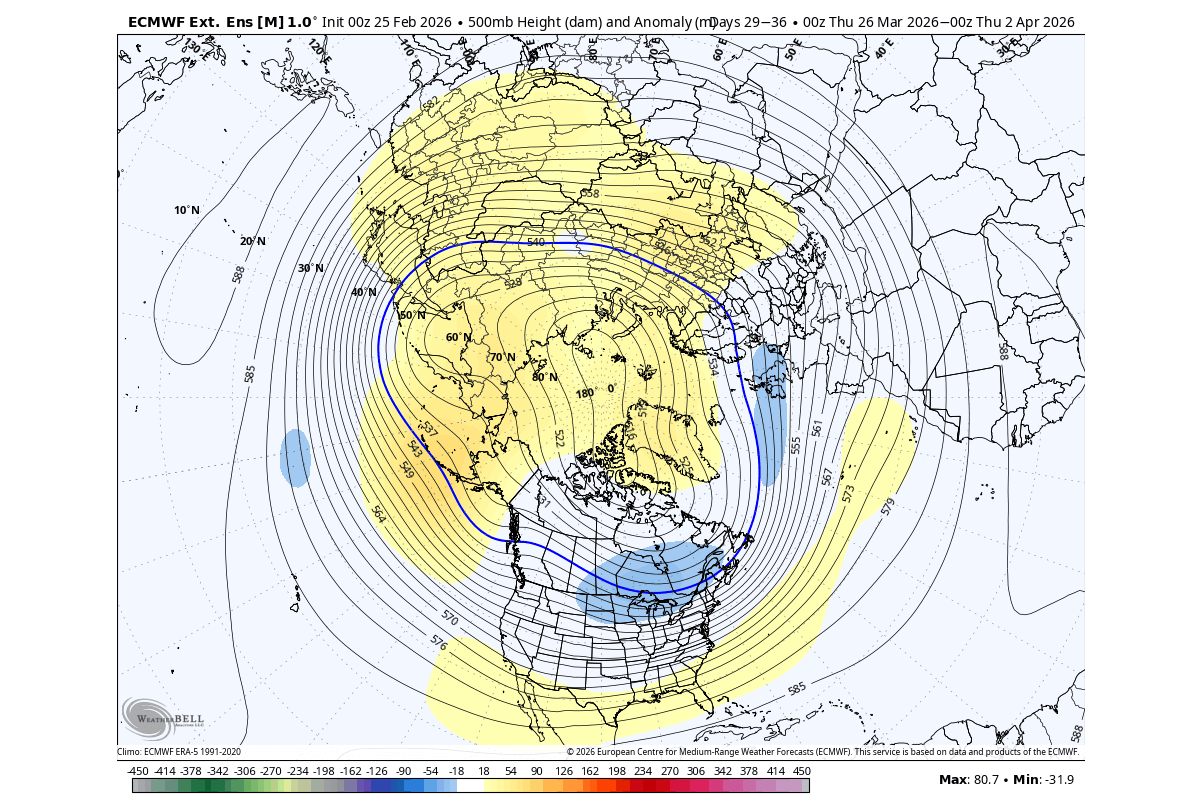
But looking into late March and early April, we are well within the window of potential stratospheric influences. The pressure anomalies for this period show a more high-pressure dominant polar region, pushing the low-pressure areas further to the south. This looks closer to a more standard stratospheric warming response, but for now, this is just a trend forecast.
The temperature trend also shows the return of a colder airmass across the United States, related to the low-pressure core moving further east, allowing the cold air to spill across the northern and eastern United States. This is similar to the several such events we have seen so far this winter.
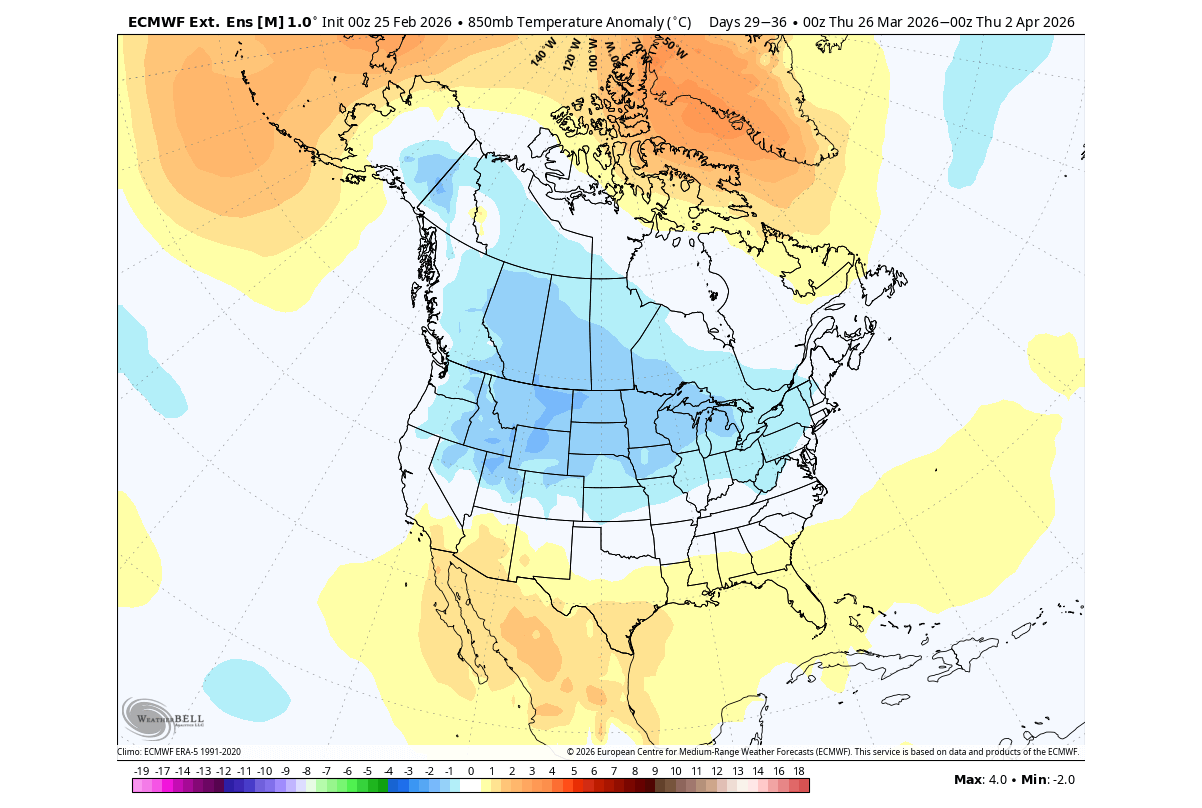
This is a pattern that the extended ensemble forecast often likes to show. Once the period gets closer, the cold more often stays on the eastern side of the United States and western Canada, with a connection corridor.
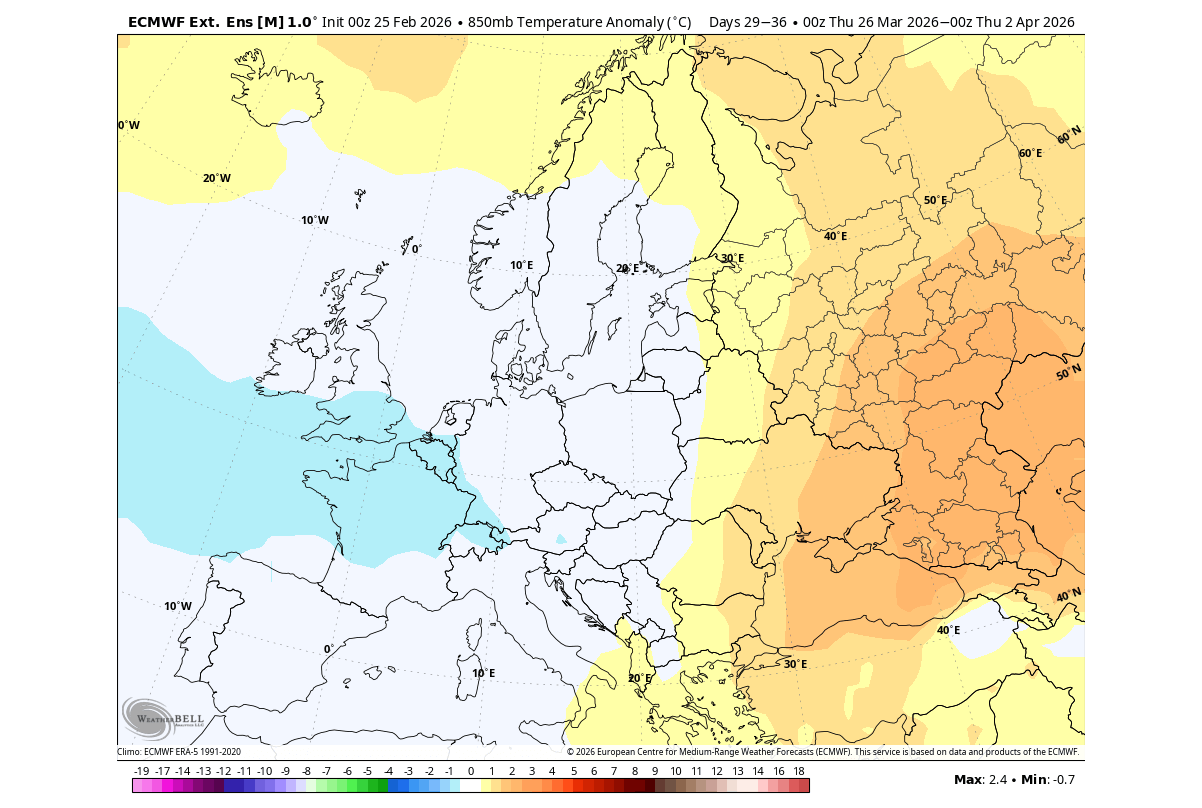
Over Europe, the late March temperature trends also show a cooler Atlantic airmass spreading from the west and northwest. This is due to the higher-pressure returning to the Greenland area, allowing the low-pressure systems to reach deeper into Europe, pushing the warmer airmass further east.
This article is based on the latest available model/ensemble data, and we will continue to release weekly updates on this developing Polar Vortex situation.
We will keep you updated on the global weather pattern development, so don’t forget to bookmark our page. Also, if you have seen this article in the Google App (Discover) feed, click the like button (♥) there to see more of our forecasts and our latest articles on weather and nature in general.
The main forecast images in this article are from WeatherBell and weathermodels.com, using a commercial forecaster license.
Don’t miss: