UPDATE NOTICE (February 6th, 2026): A strong Stratospheric Warming event is now entering its early phase, but is forecast to clash with a rare atmospheric interference over North America. Below is the link to the latest update article with the latest forecasts and analysis:
February 6th Stratospheric Warming Update: Polar Vortex Collapse and the MJO Atmospheric Wave
New forecasts confirm a Polar Vortex split and collapse in mid-February, following a Stratospheric Warming event. The latest predictions show a breakdown of the polar circulation, creating a prolonged cold weather pattern across North America and Europe, with early signs that it can last into early Spring.
While the main collapse is scheduled for mid-month, the United States and Canada are already feeling the early effects of a pre-split disruption. A deformed, elongated Polar Vortex core is currently pushing cold anomalies into the central and eastern U.S., with temperatures in some regions forecast to drop 30°F below normal.
Current data indicates that this Stratospheric Warming event will start unfolding over the next 8 to 10 days. In this article, we will look at the prolonged disruption of the stratospheric Polar Vortex. Also, we will analyze the resulting weather impacts over North America and Europe for the remainder of winter and into early spring.
Polar Vortex: Powering the Winter Circulation
Our goal is to share forecasts, weather information, and also to explain complex weather phenomena like the Polar Vortex in simple terms for everyone to understand. For this reason, we usually include a short section explaining what the Polar Vortex is and why it is crucial to monitor its activity.
To keep it simple, the Polar Vortex is the broad winter circulation over the northern (and southern) hemispheres. You can imagine the Polar Vortex as a spinning wall over the polar regions, rising from the surface into the stratosphere (over 50km/30 30miles high), trapping the cold polar air inside.
As you can see in the image below, the Polar Vortex is divided into two layers that we monitor each winter: the stratosphere and the troposphere. The first is at a higher altitude, and the second is at a lower altitude. The Polar Vortex rises high through both layers, but with different shapes, strengths, and impacts.
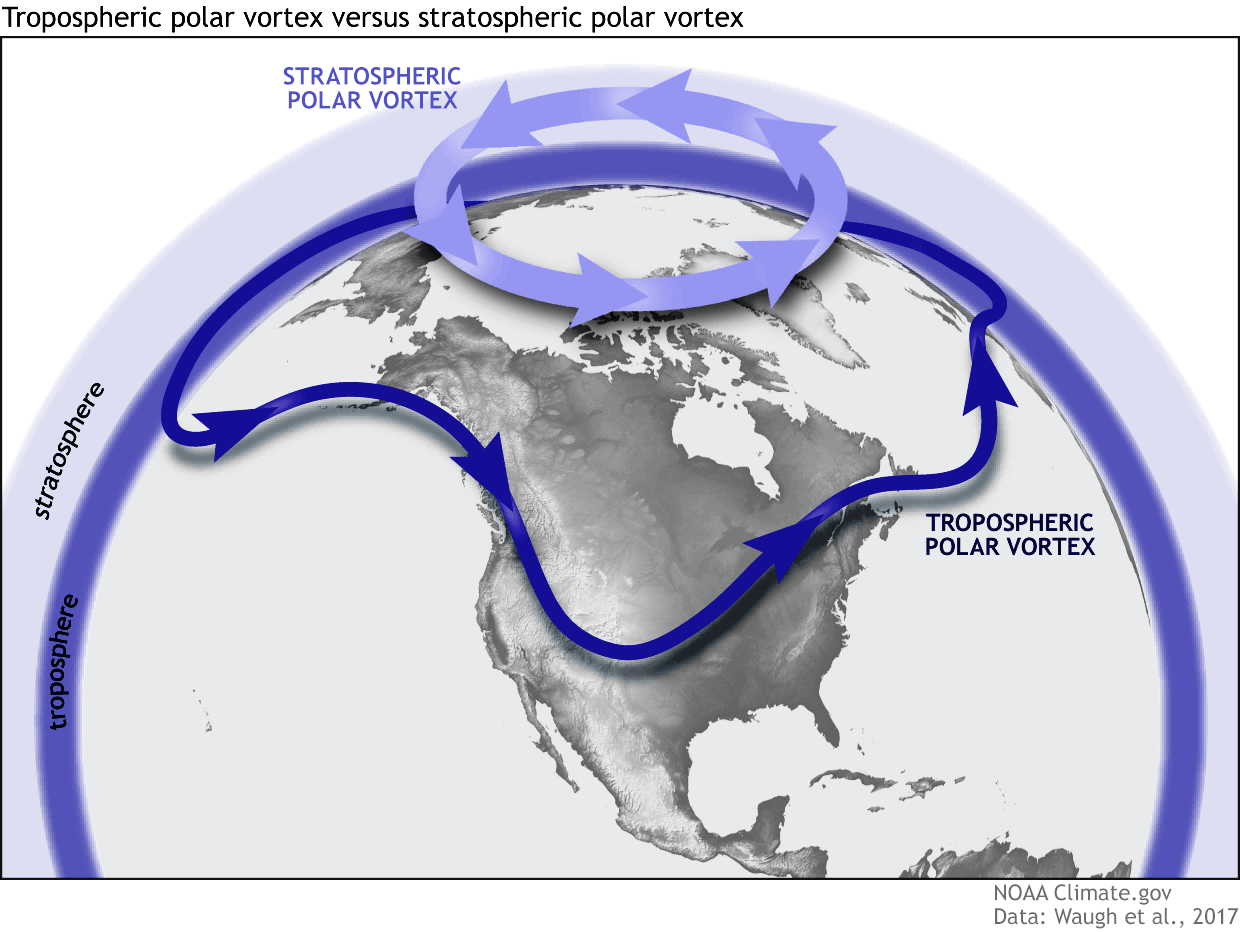
This is why we separate the whole Polar Vortex into an upper (stratospheric) and a lower (tropospheric) part. A strong Polar Vortex locks the colder air into the polar regions, preventing it from spilling out into lower latitudes. This creates milder conditions for most of the United States and Europe.
But when the Polar Vortex is disrupted or collapses, it can no longer contain cold air, releasing it outward toward the mid-latitudes. This allows the cold air to spill into the United States and other mid-latitude regions. Below is an example of how a disrupted Polar Vortex releases cold polar air into the United States and Europe.
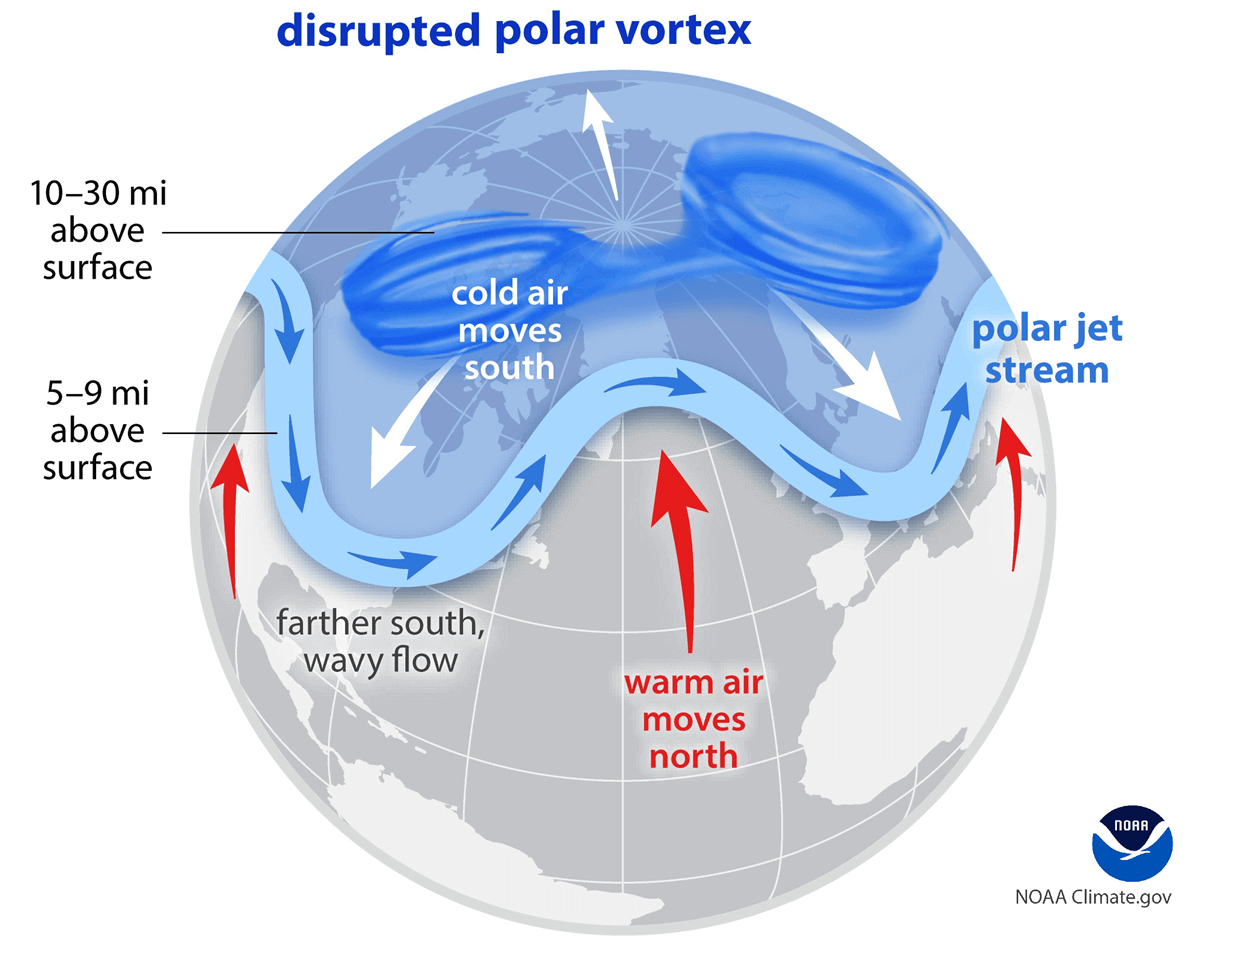
If you like cold winter weather across the United States, Canada, or Europe, this weak/disrupted Polar Vortex is exactly what you want to see. The disruption usually arises from a rise in stratospheric pressure and temperature, known as a Stratospheric Warming (SSW) event, or from other dynamics.
To better understand the Polar Vortex, we produced a high-resolution video below that reveals its 3D structure. This video shows the latest forecast split of the Polar Vortex structure from a Stratospheric Warming event over the next two weeks, with a split core extending into North America, bringing down colder air.
But before we get to the Stratospheric Warming event, we already have an ongoing disruption in the Polar Vortex. It has brought some of the coldest air into the United States recently and is now forecast to bring another round of cold.
Polar Vortex Disruption Brings another round of Arctic air
When analyzing the Polar Vortex in the stratosphere, we often use simple maps showing pressure (geopotential height) and temperature at those levels. This is the most basic “health check” of the Polar Vortex, which tells us al ot about its potential influence on the lower levels.
Below is the latest analysis for the mid-stratosphere at the 10mb level (30km/18.5miles height). You can see a deformed, elongated Polar Vortex, which is disrupted by two strong stratospheric high-pressure areas with a warming wave. This stretches the Polar Vortex, pushing its outer core directly into North America. Image by weatheriscool.com
This is the analysis for the higher levels, and can look different than the lower stratosphere. But it tells us a lot about the potential changes below, as the Polar Vortex is one large connected system.
The forecast graphic below shows the pressure anomaly forecast for the lower stratosphere at the 50mb level (20km/12.4 miles). You can see a strong high-pressure anomaly area around the polar regions and a stretched Polar Vortex core, pushed into North America. This supports the northerly flow at surface levels into the United States, bringing down a cold polar airmass.
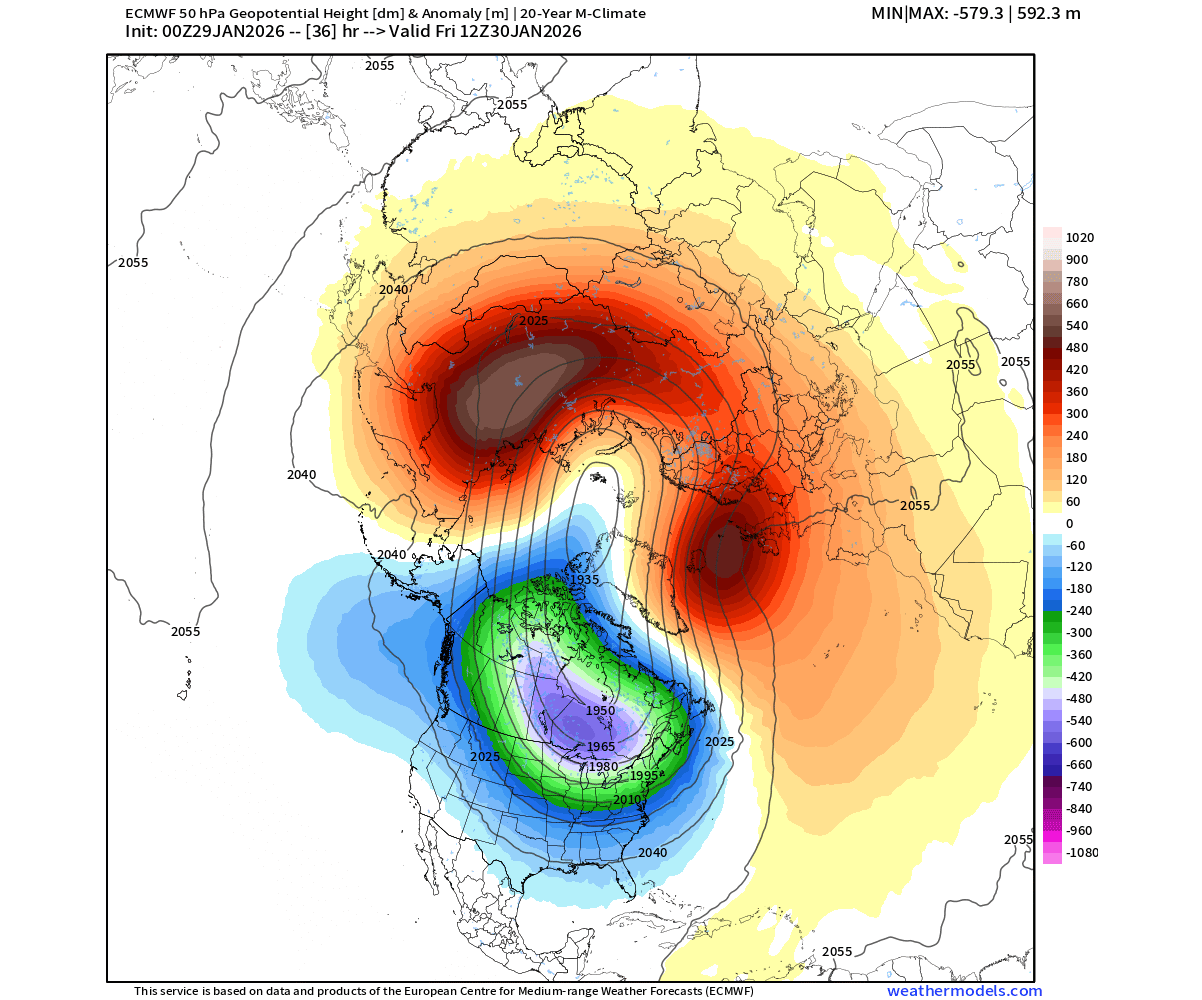
These shifts in the Polar Vortex core happen when there is some type of disruption, or a high-pressure area in the stratosphere. You can imagine the Polar Vortex as a “balloon” which, when squeezed, will elongate. This is how the high-pressure anomalies in the stratosphere can push the Polar Vortex core into North America.
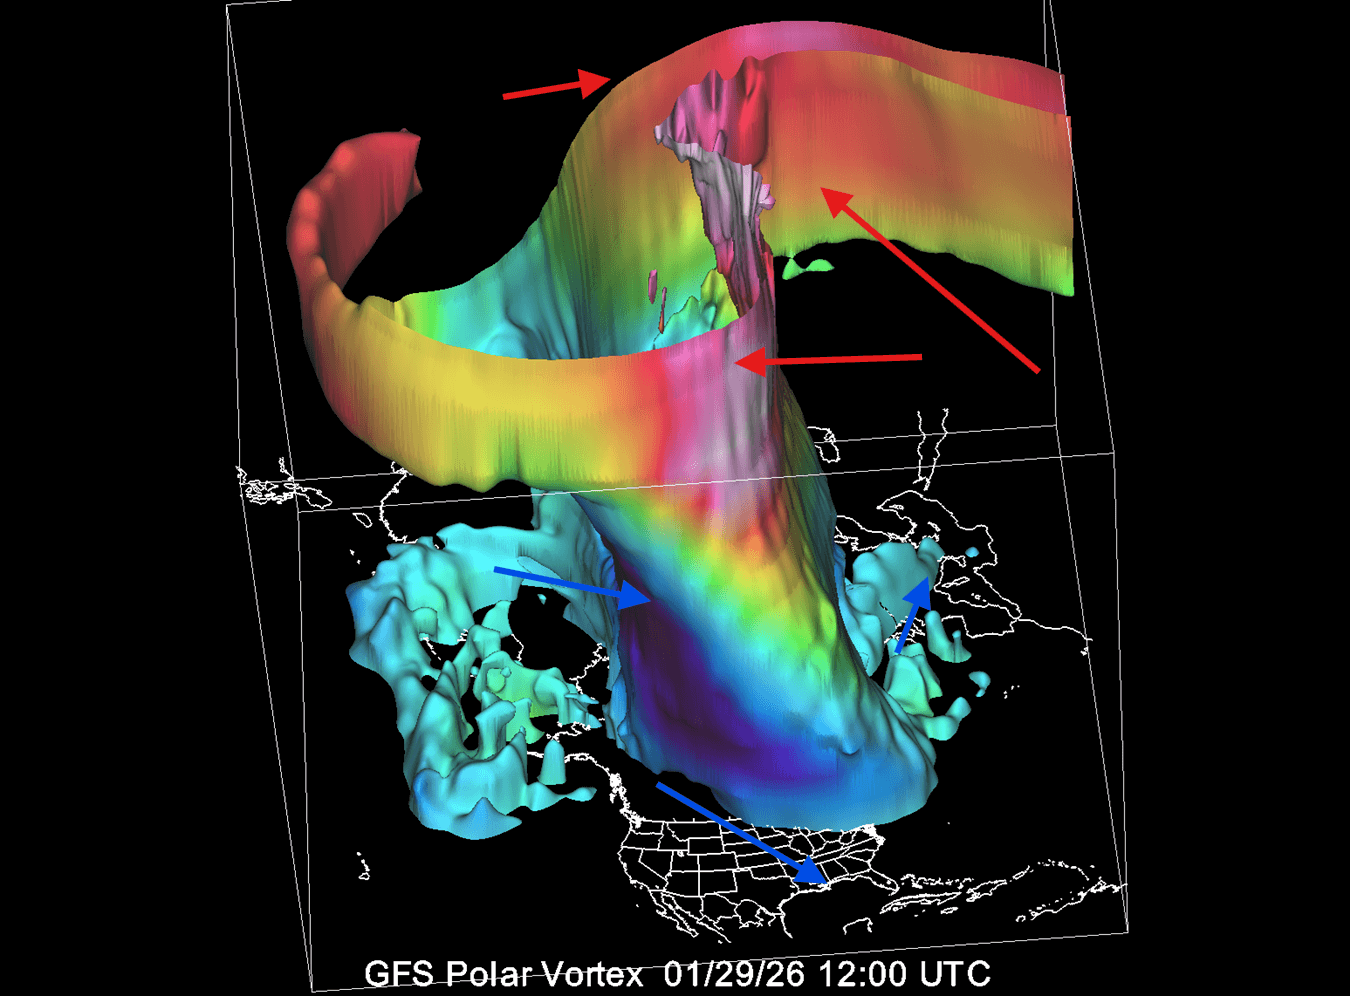
You can see a great example of this “balloon” Polar Vortex analogy in the 3D analysis below. High-pressure areas with warming are compressing the Polar Vortex, elongating its structure. This causes the lower parts to push the lower core into North America, allowing a strong northerly flow with an Arctic airmass to spill into the United States, Canada, or parts of Europe.
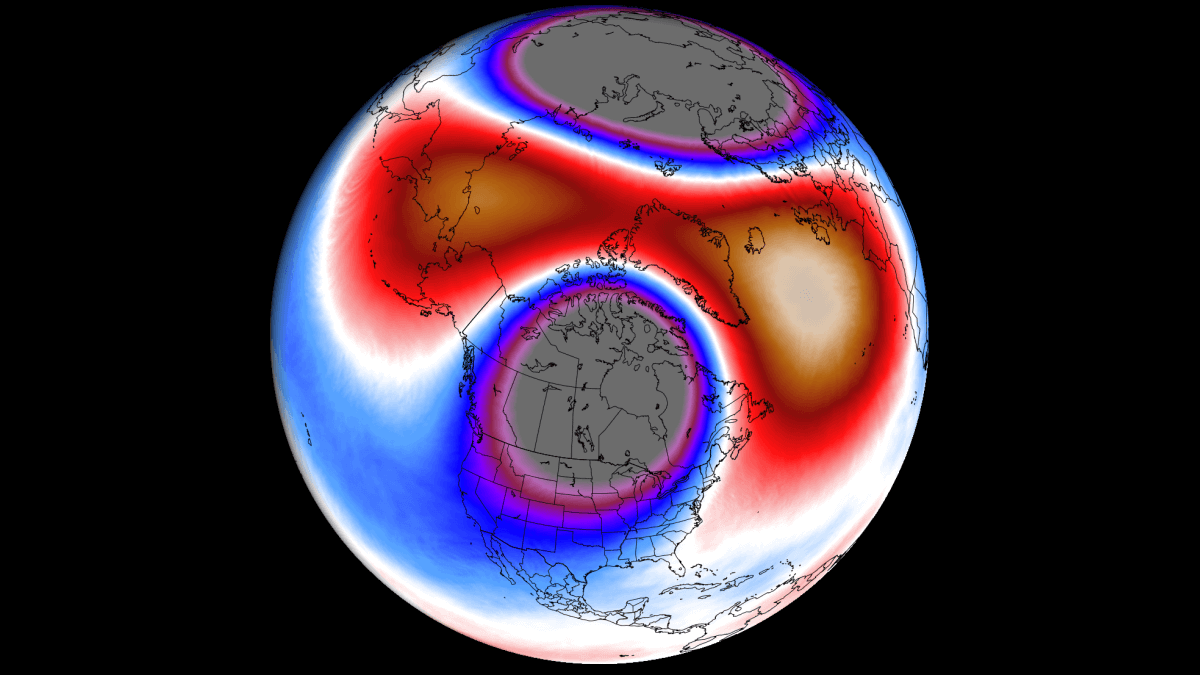
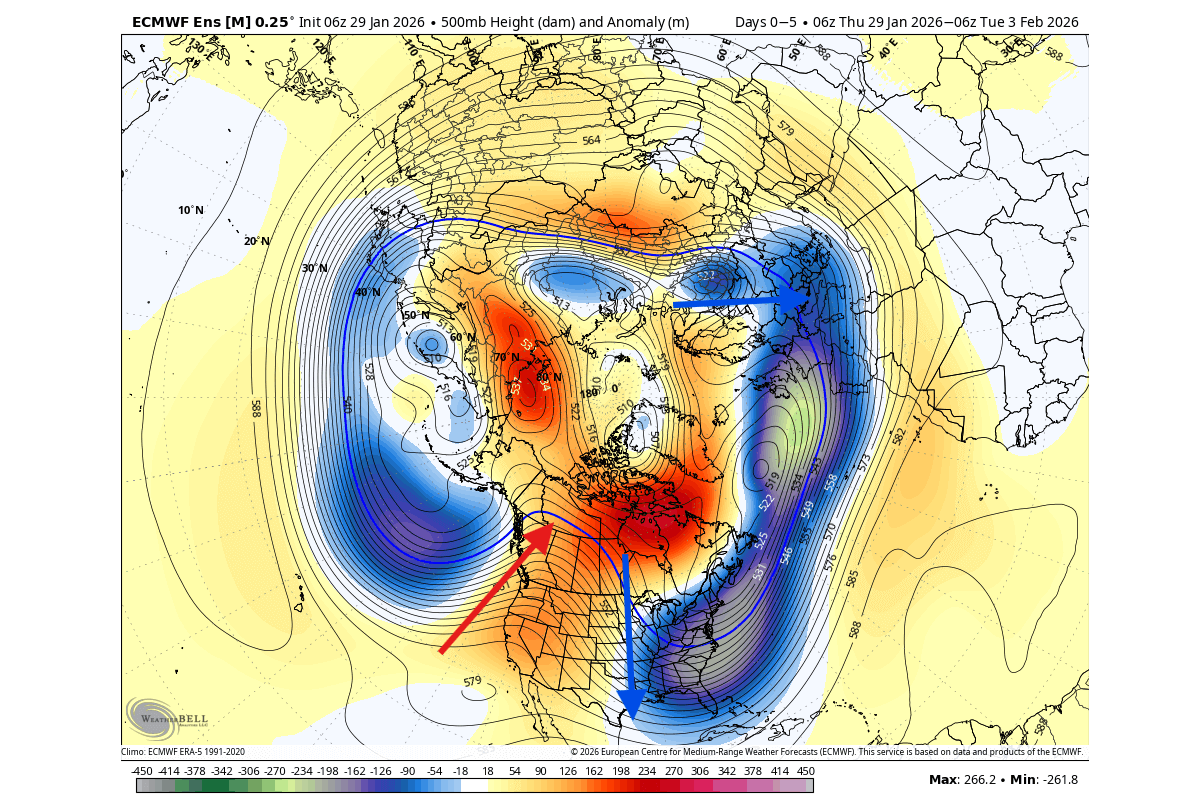
If we now look at the lower levels, the pressure anomaly analysis below shows a clear disrupted Polar Vortex “footprint” from the 3D analysis. You can see the low-pressure cores over the eastern United States and Europe, and the high-pressure blocking over the Polar regions. This allows cold northerly flow into the United States and northern Europe.
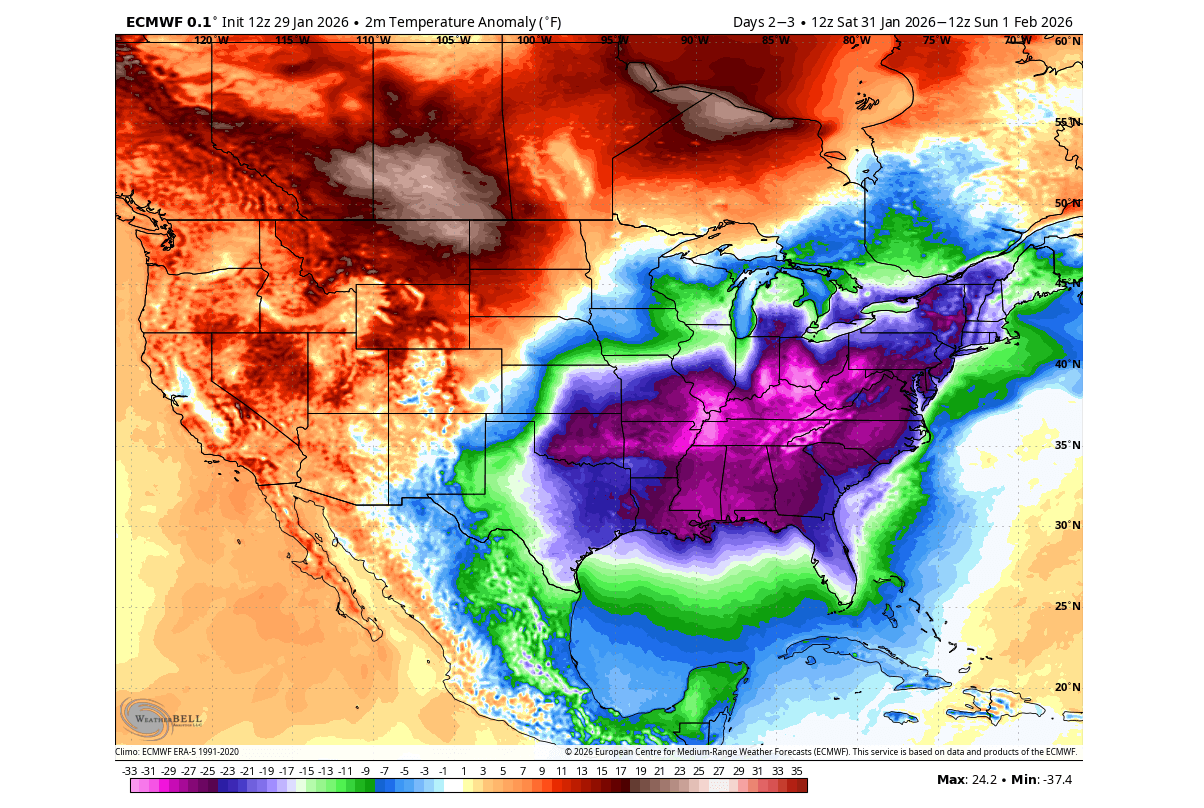
The actual surface result is nicely seen in the temperature forecast below for the next 3 days. You can see a strong polar air anomaly over the central, southern, and eastern United States, reaching also into Florida. This is a strong cold anomaly, with temperatures reaching over 30F lower than normal for this time of year.
This polar airmass will bring another significant winter storm event, typical for a Polar Vortex core. In the image below, you can see the official forecast for the Winter Storm Severity Index for days 1-3. It shows an extensive coverage of winter weather across the northern and eastern United States.
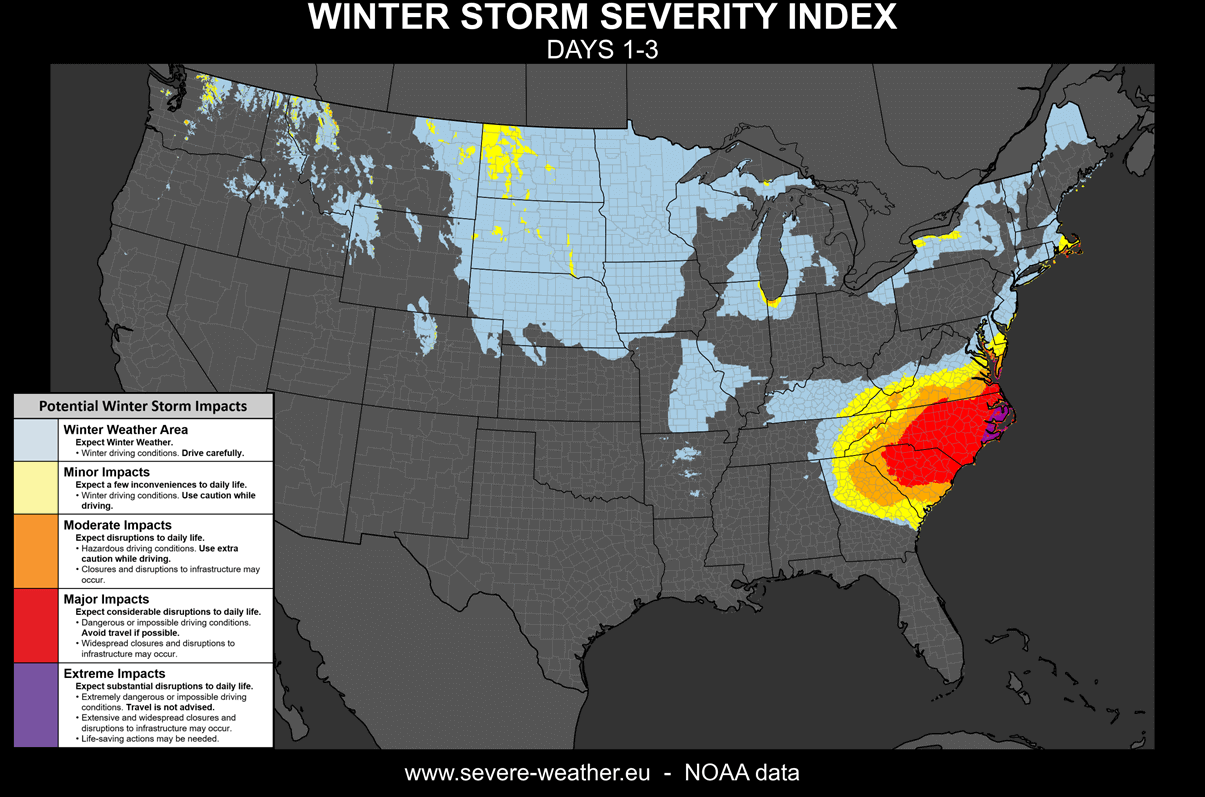
But the strongest impact is expected in the east, more specifically over the states of Virginia, North Carolina, and South Carolina. Major to Extreme impacts are predicted by the NOAA index over a large part of the Carolinas.
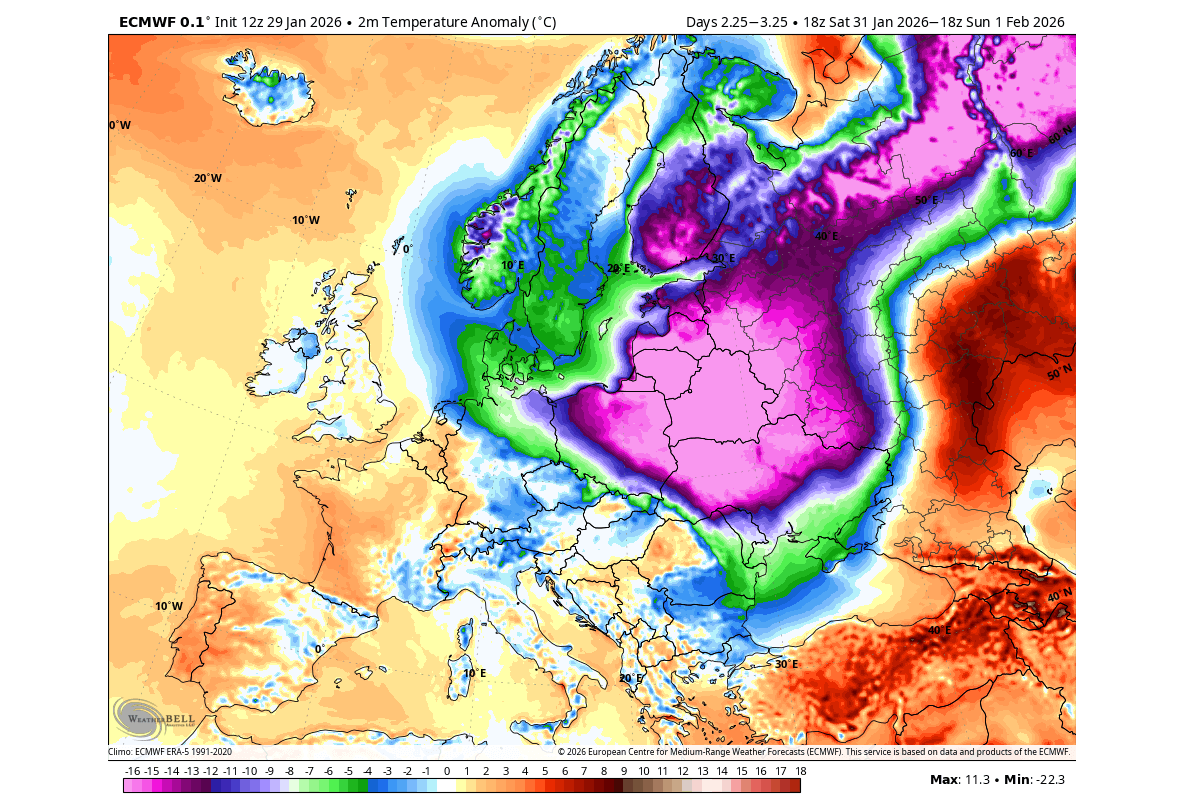
The forecast also shows colder polar air being pushed out into Europe, covering much of the continent toward the northeast. But a low-pressure system over the west will prevent the bulk of the Arctic airmass from reaching further towards the central and western parts.
Looking into the second week of February, the cold pattern is forecast to persist over the eastern United States and eastern Canada. This is expected, as the pattern is highly disrupted, pushing the Arctic doors wide open. This is amplified by a high-pressure area in the west, bringing a mild airmass into the west-central United States and southwestern Canada.
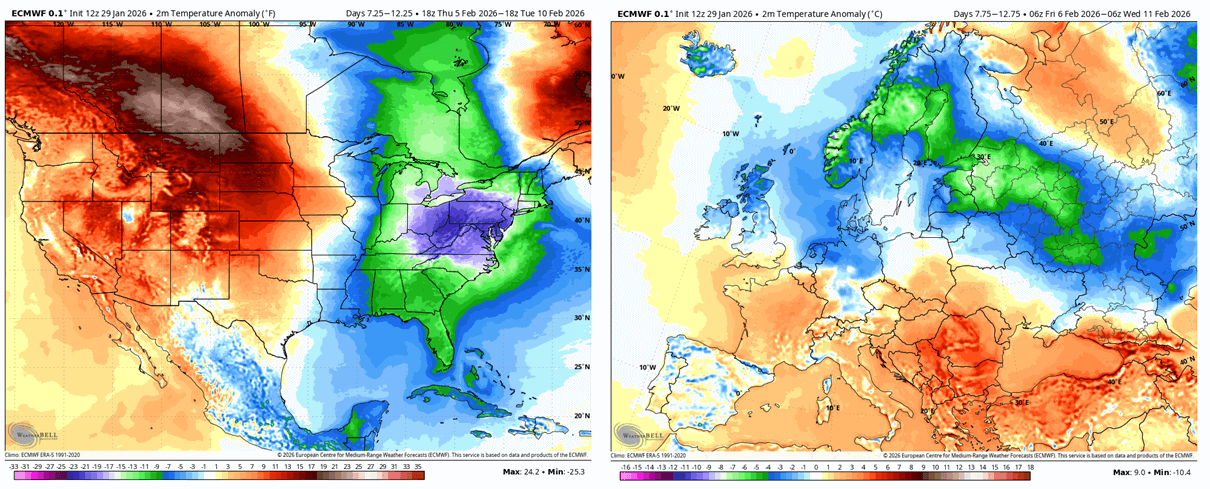
But over Europe, the low-pressure area will bring a temporary southerly flow and warmer air into the southern and central parts. This will keep the colder air over the northwestern and northern parts of the continent.
At the same time, a strong Stratospheric Warming event will begin to take shape. A prolonged weakening/disruption of the stratospheric Polar Vortex is expected, with a polar air release into the mid-latitudes.
February 2026: Major Stratospheric Warming Event Unfolds
Below is the latest analysis and forecast of the mid-stratospheric winds around the Polar Vortex. This tells us a lot about the state of the Polar Vortex, its strength, and potential weather impacts. The dashed lines are the last few forecasts, which show a clear and continuous weakening of the stratospheric Polar Vortex, almost reaching the magic 0 line.
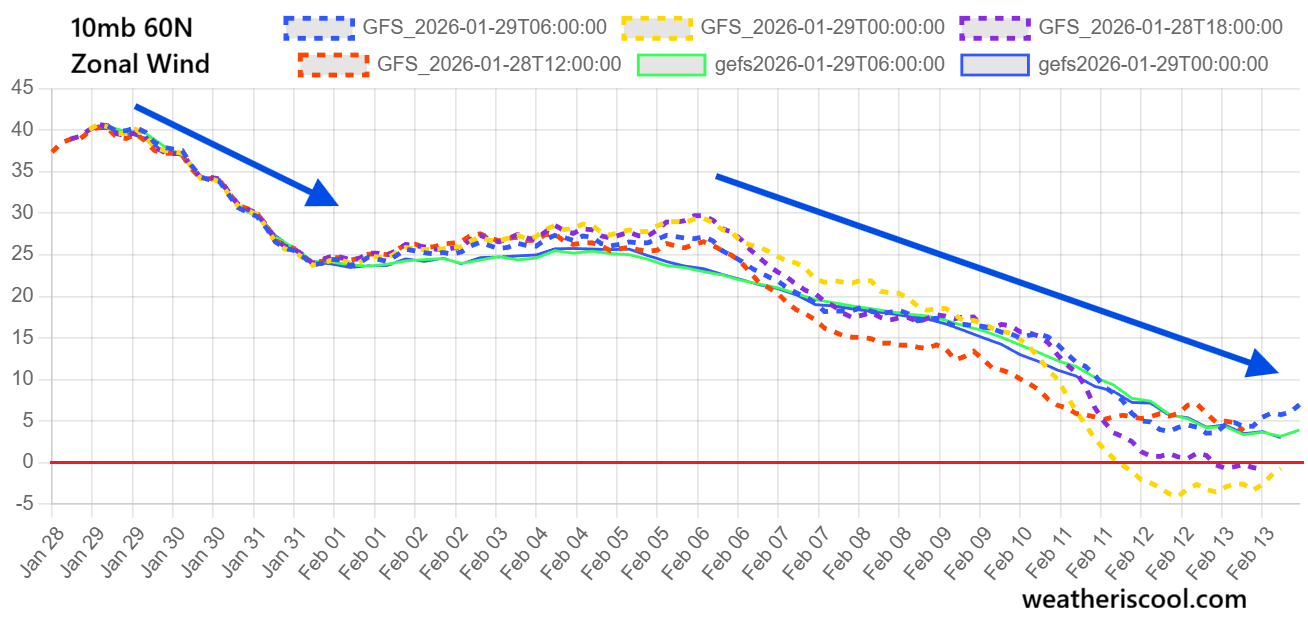
The graphs show a complete slowdown of the Polar Vortex, approaching a full wind reversal in the stratosphere (negative values). This is only possible with a strong stratospheric warming event.
As mentioned, a stratospheric warming event is a rise in stratospheric pressure and temperature, which stresses the Polar Vortex. These events can disrupt, or even fully collapse and split the Polar Vortex, creating major surface weather impacts.
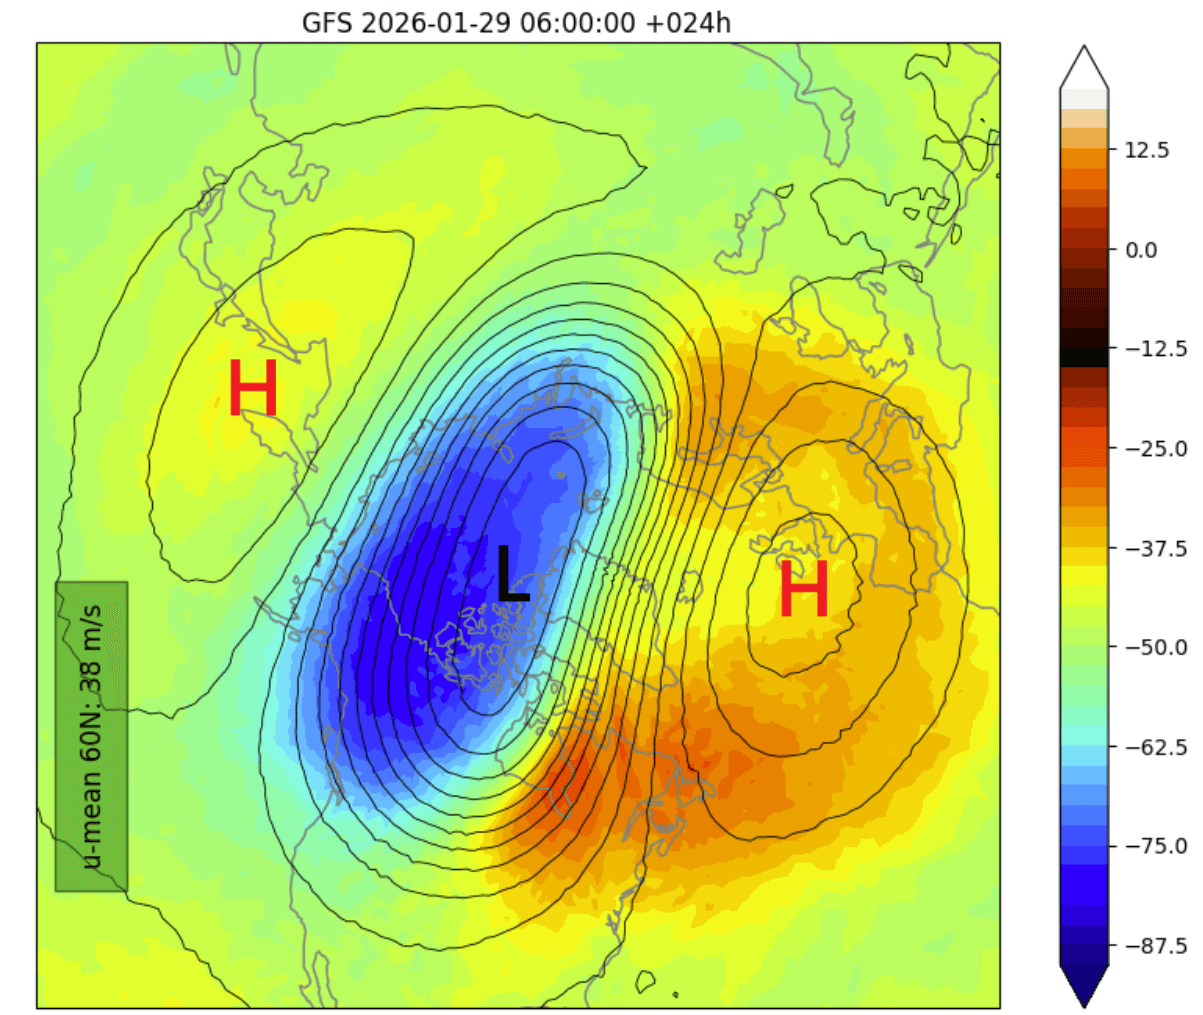
Below is the pressure and temperature forecast around mid-February in the stratosphere at the 10mb level (30km/18.5miles height). You can see two high-pressure areas (H) and a strong warming wave splitting apart the Polar Vortex into two main core areas.
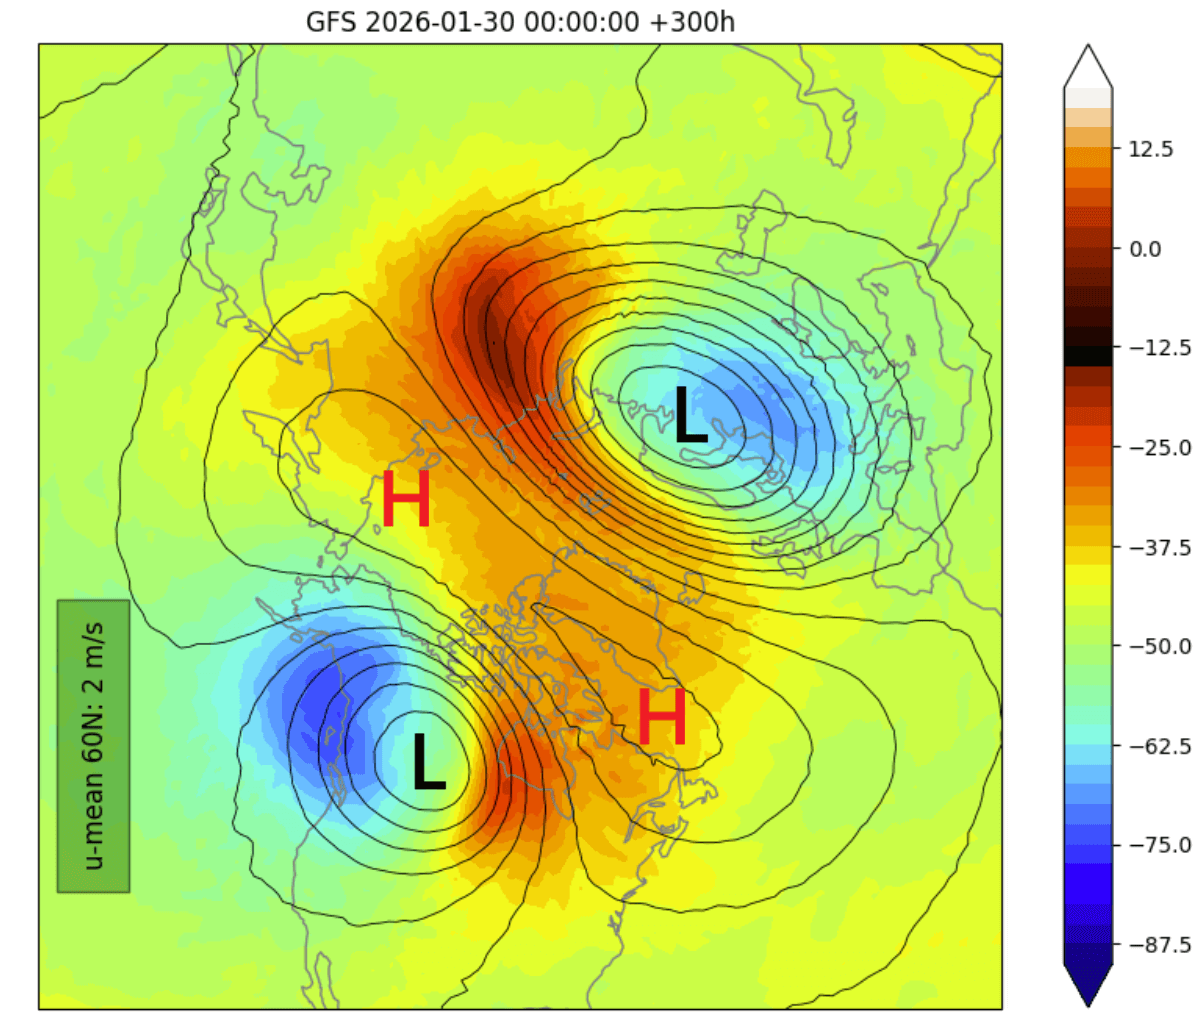
The forecast also shows very weak Polar Vortex winds, at just 4m/s, close to a wind reversal. But even without an official reversal, the practical difference between 2m/s or 0m/s is low to none in the resulting surface weather. A collapse of the Polar Vortex is what makes the real weather impact.
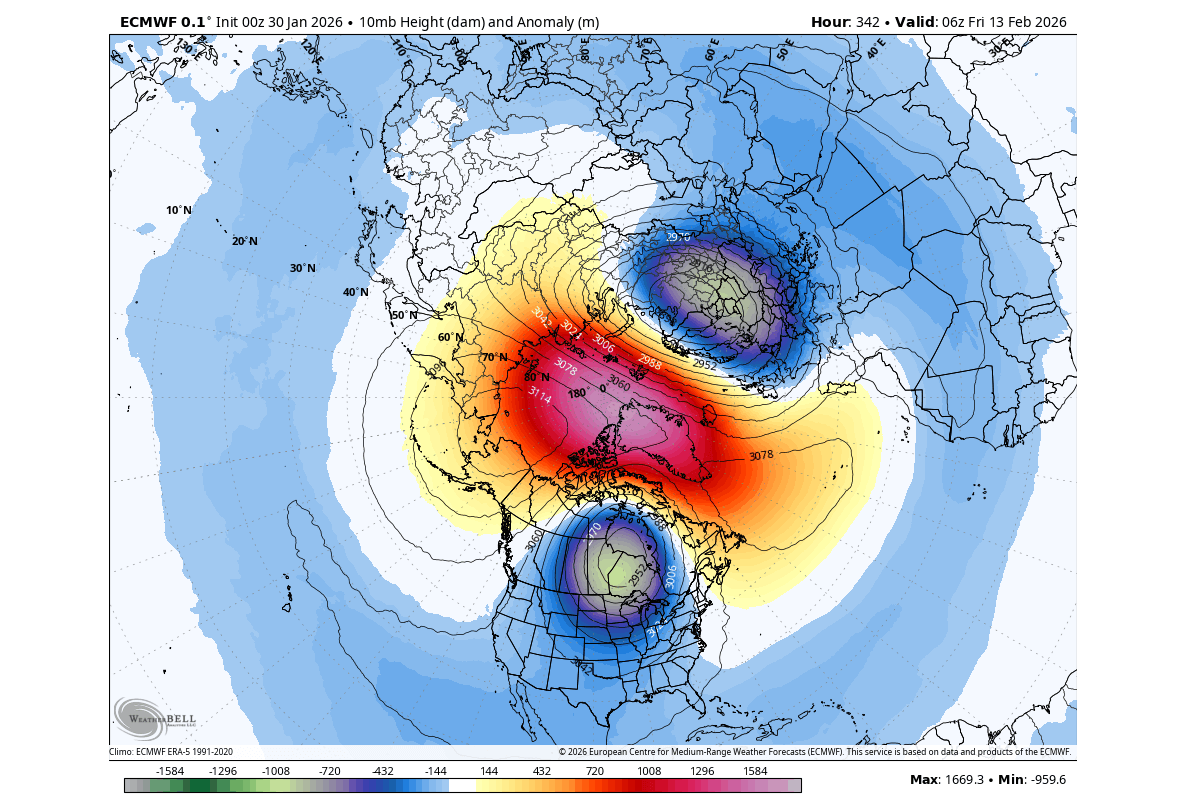
Below is the mid-stratosphere pressure anomaly forecast for the same level and period. This reveals an impressive high-pressure anomaly at the 10mb level, breaking down the Polar Vortex into two separate cores, bringing along cold weather impacts around each core location.
The real extent of the stratospheric warming event is evident below in the latest temperature anomaly forecast at the same 10mb level, about 8-12 days from now. You can see a strong warming anomaly over the polar regions, with temperatures in the mid-stratosphere peaking over 50 degrees C above normal, marking this as a significant split event.
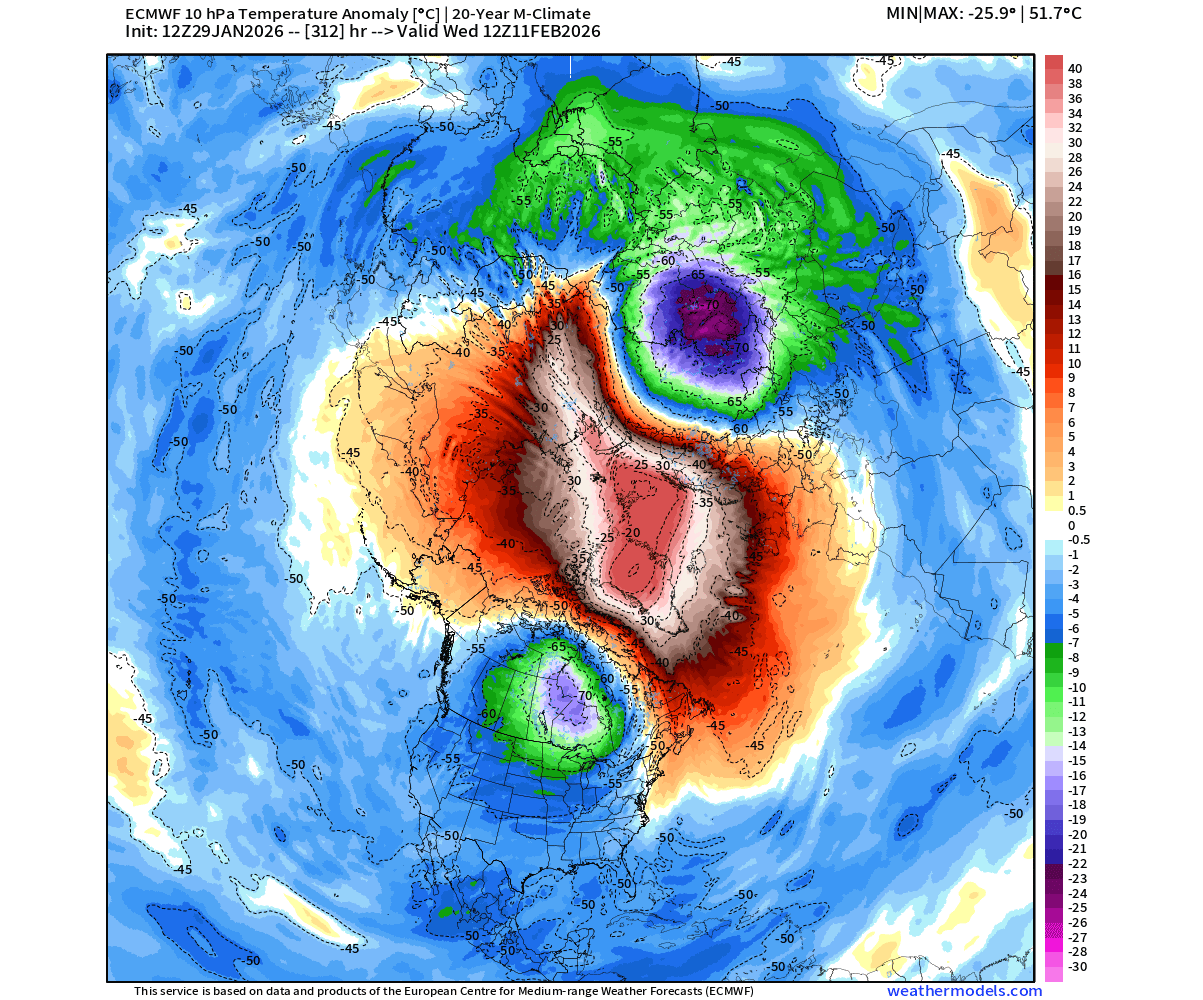
The pressure and temperature anomalies in the stratosphere show a proper, strong SSW event, exactly the type that is usually the driver behind some of the coldest weeks in a winter season.
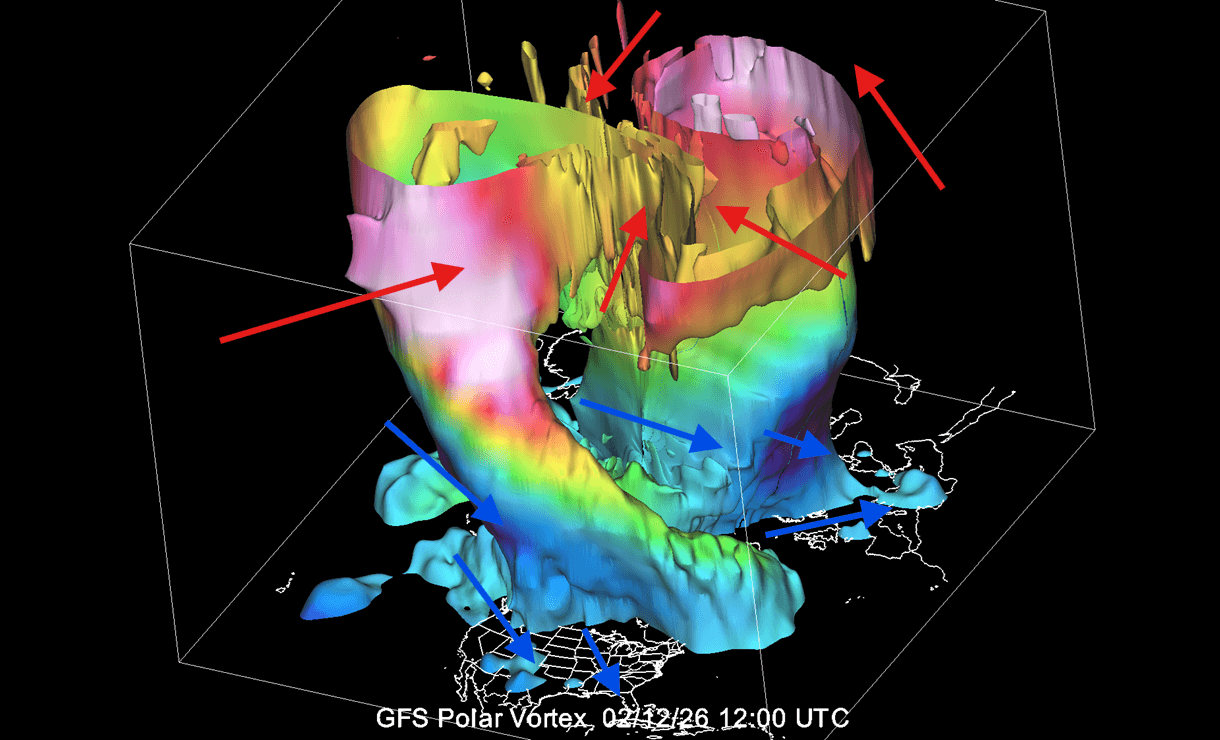
Below is also a 3D forecast of the Polar Vortex for mid-February, during the peak of the SSW event. You can clearly see a highly disrupted and fully split structure with warming waves on top. In the lower levels, the split Polar Vortex cores enable colder air transport from the Polar regions into the United States, Canada, and also towards northern Europe.
Another vertical structure that we usually look at is the atmospheric pressure analysis/forecast. The image below shows the pressure anomaly from the surface up to the top of the stratosphere. In the analysis part, you can clearly see several stratospheric Polar Vortex disruptions (red means higher pressure) so far this winter. Image by @gmrpetricca
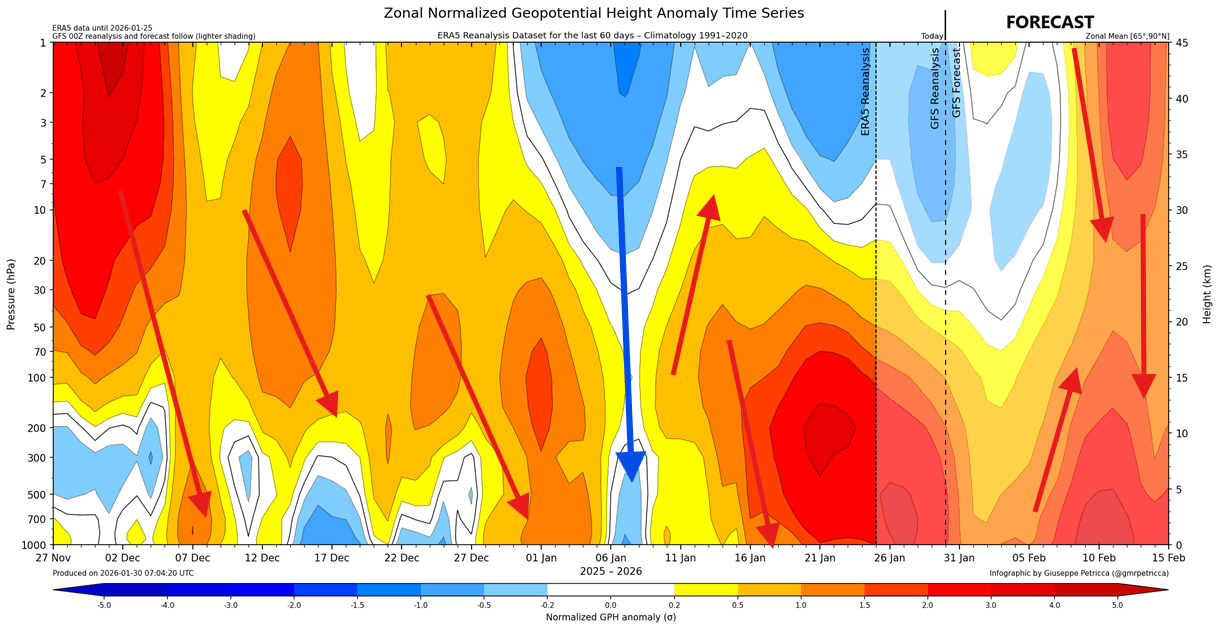
But in the forecast part, you can see an obvious new high-pressure anomaly in the stratosphere, which is the result of the upcoming warming event, and causes the split in the Polar Vortex structure. Based on the pressure anomaly in the lower levels, this looks like a quick connecting event across all atmospheric levels.
This can tell us a lot about the anatomy of a stratospheric warming event, which can determine the final outcome of the weather patterns over the United States, Canada, and Europe.
Weather Anatomy of a Stratospheric Warming Event
To understand what an impact such a strong event can have, we can look at the “anatomy” of a stratospheric warming event and what the usual impacts are that follow on the surface.
The images below are the combined result of many different stratospheric warmings, produced by one of the CLS research groups at NOAA. Usually, each individual event can create a bit different weather outcome, but all push towards releasing the cold polar air.
Below is a typical vertical schematic of how a stratospheric warming event works. The image shows pressure anomalies across the atmosphere over the whole SSW event, with 0 being the peak day of the event. You can see how the main event in the stratosphere affects the surface layers downwards with some delay, usually in the 10-30 day range.
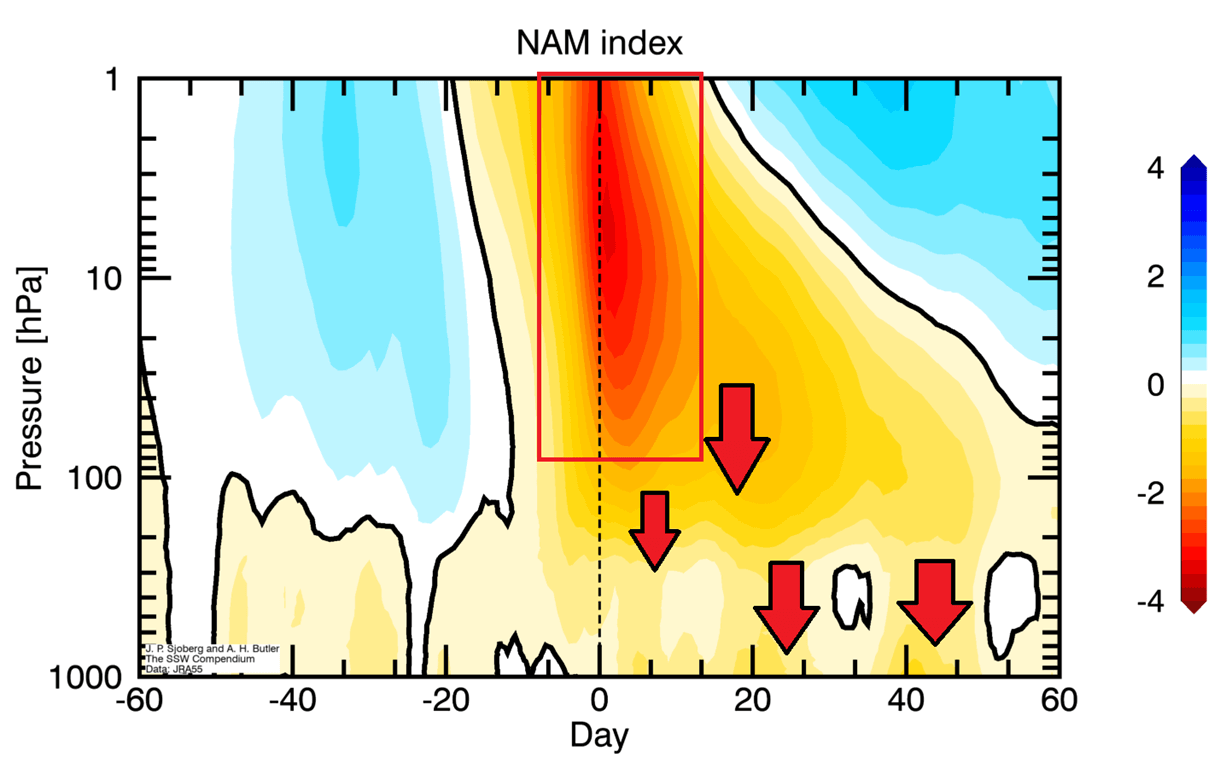
The “day 0” of the event is usually when the stratospheric Polar Vortex winds reach zero or fully reverse from westerly to easterly.
But what can we expect at the surface after a full reversal and collapse of the Polar Vortex? Below is the sea-level pressure pattern 0-30 days after a stratospheric warming. The main feature is the blocking high over Greenland and the polar regions, as a result of the Stratospheric Warming event and the collapse of the Polar Vortex.
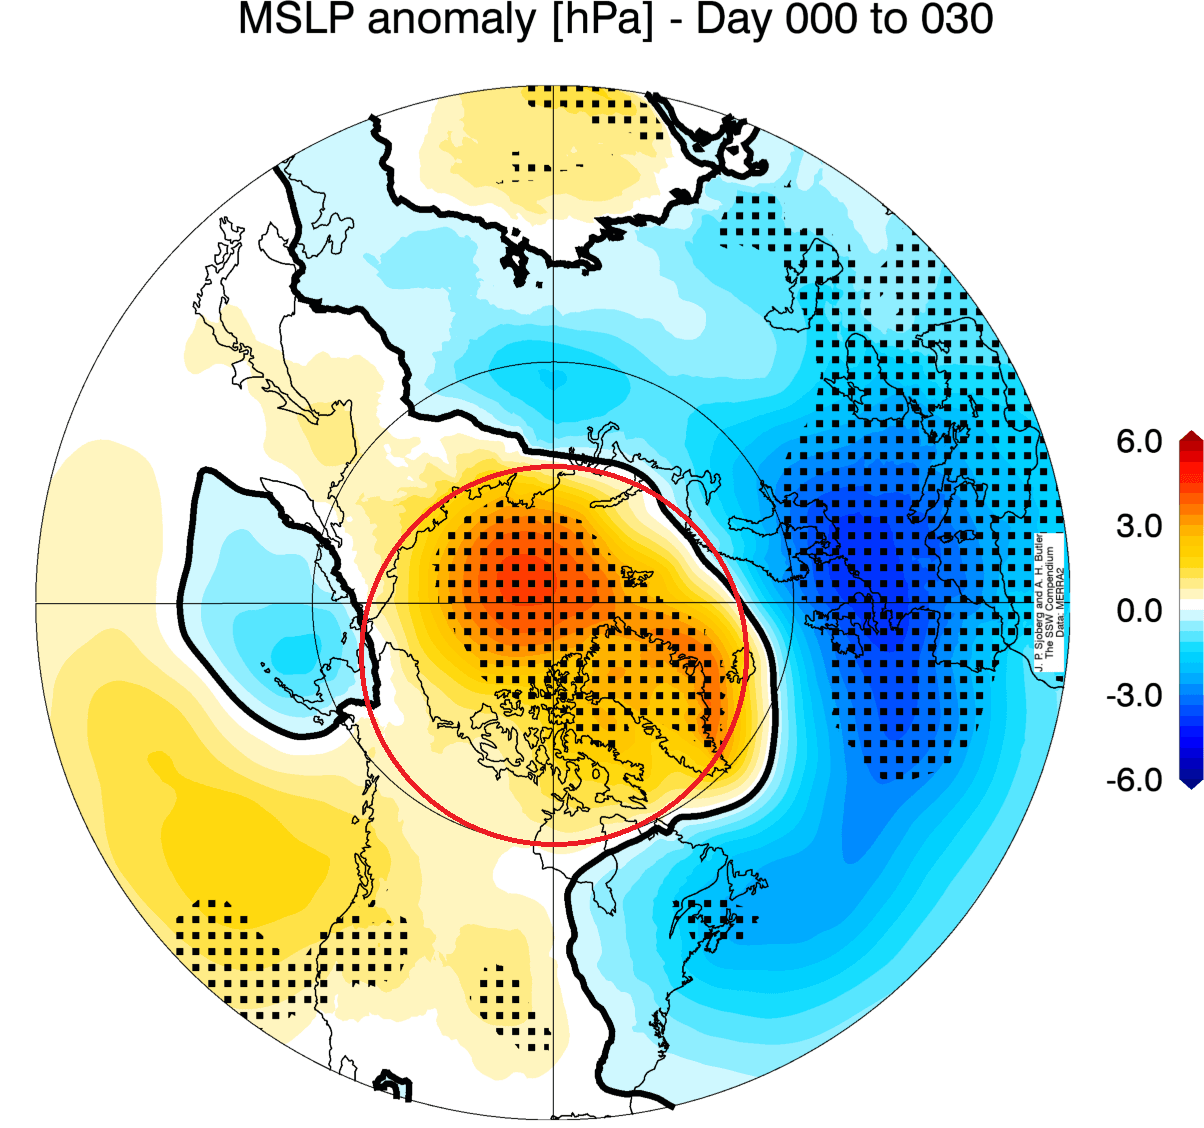
That helps stabilize a low-pressure zone extending from the eastern United States across the Atlantic to Europe. This is the usual region where we tend to find the scattered Polar Vortex cores, after the collapse event.
Such a pressure pattern brings northerly flow with a polar airmass over the United States and cold potential across much of Europe. This is confirmed by the image below, which shows the temperature anomaly pattern in the 0-30 days after a stratospheric warming event.
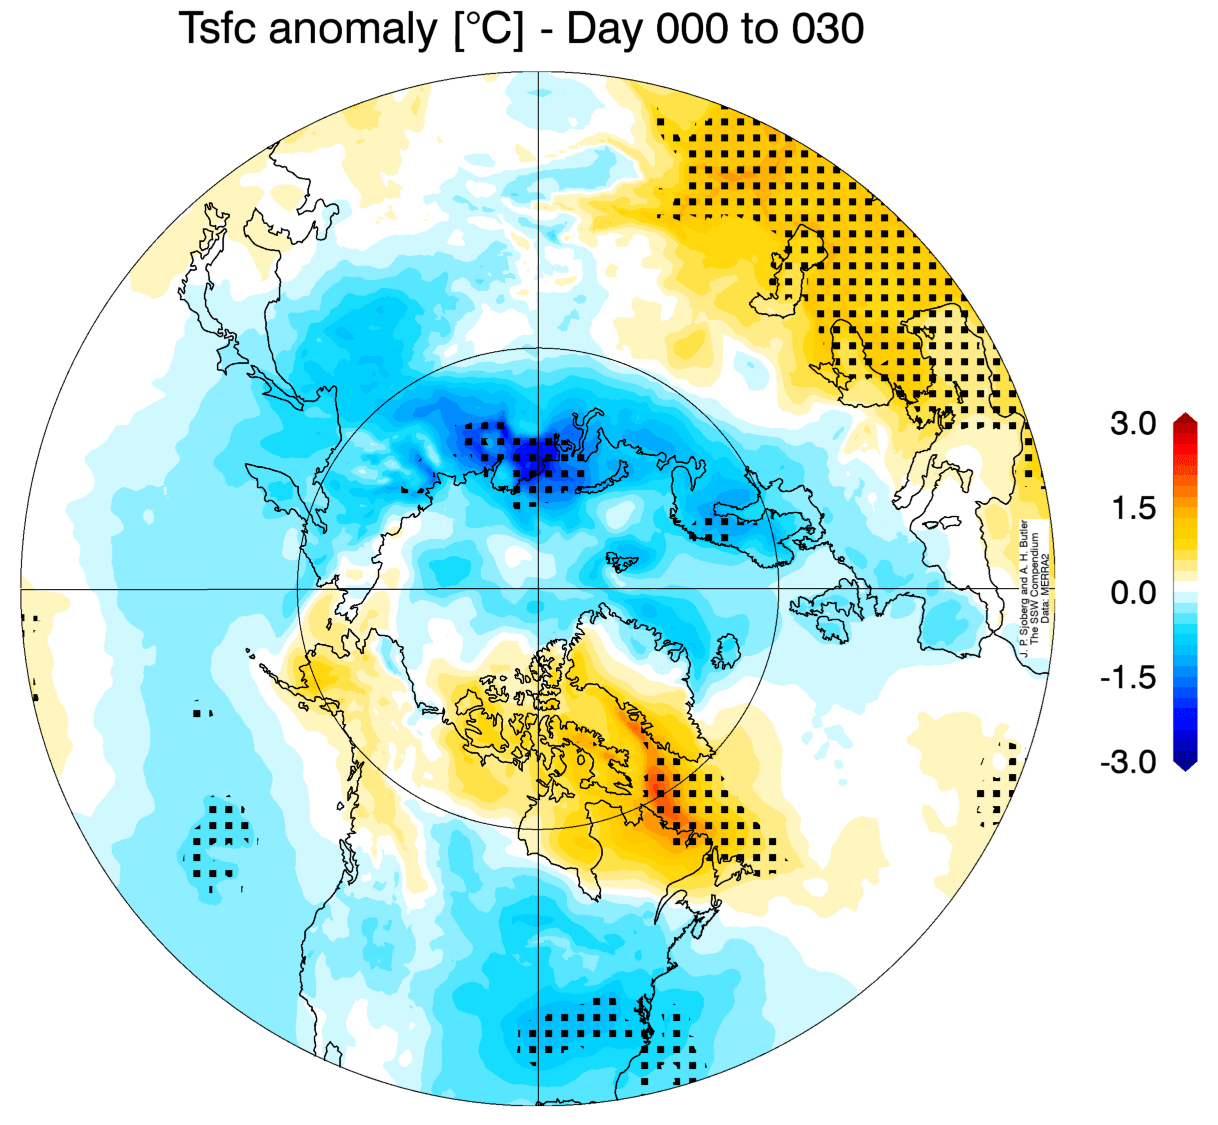
A cold air anomaly is seen over North America, peaking over the central and eastern United States and southern Canada. You can also see a spill of cold air over Europe. But this is an average image of many events, so some events bring cold only to the United States or only to Europe.
Knowing how a stratospheric warming event works, we can look at the latest ensemble forecast trends to find the real potential weather impacts in February and even into early March from the 2026 SSW event.
Polar Vortex Collapse Forecast: A Disruption to Last Into Spring
Taking the delay period into consideration, we will first look at the pressure forecast for mid-February. It shows almost an exact pressure pattern as the one expected after a stratospheric warming event. You can see a blocking high over the polar regions and Greenland, and a low-pressure area from the United States all the way across the Atlantic into Europe.
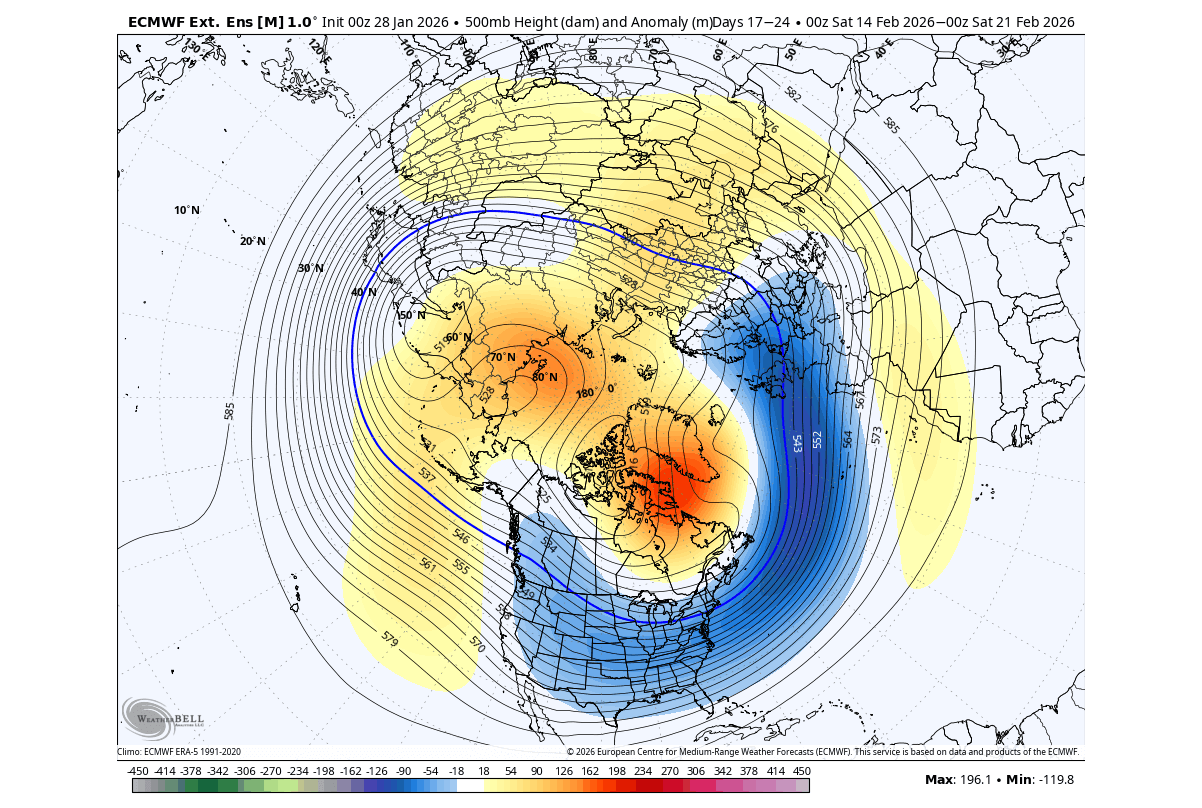
This is a very clear signature of a collapsed Polar Vortex circulation. It is also what we would expect to see, following a stratospheric warming event.
The mid-February temperature anomaly forecast also shows a cold pattern across western Canada and the whole of the United States. This is also very close to the usual weather response after a stratospheric warming event, as seen in the previous section.
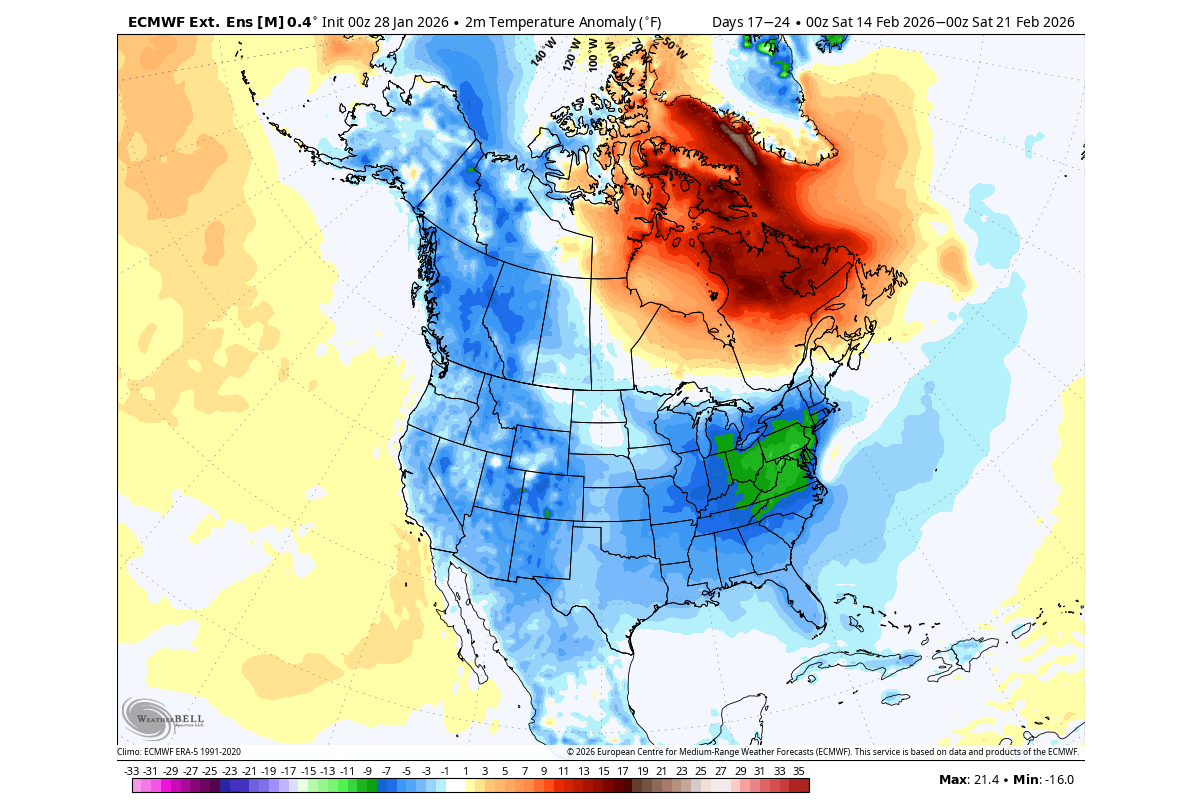
We do have to add that this is an extended-range ensemble forecast. This means that it shows a forecast trend, which is obviously cold in the first half of February. But the real magnitude of the cold is hidden in the ensemble average, and can be much stronger than shown at this range.
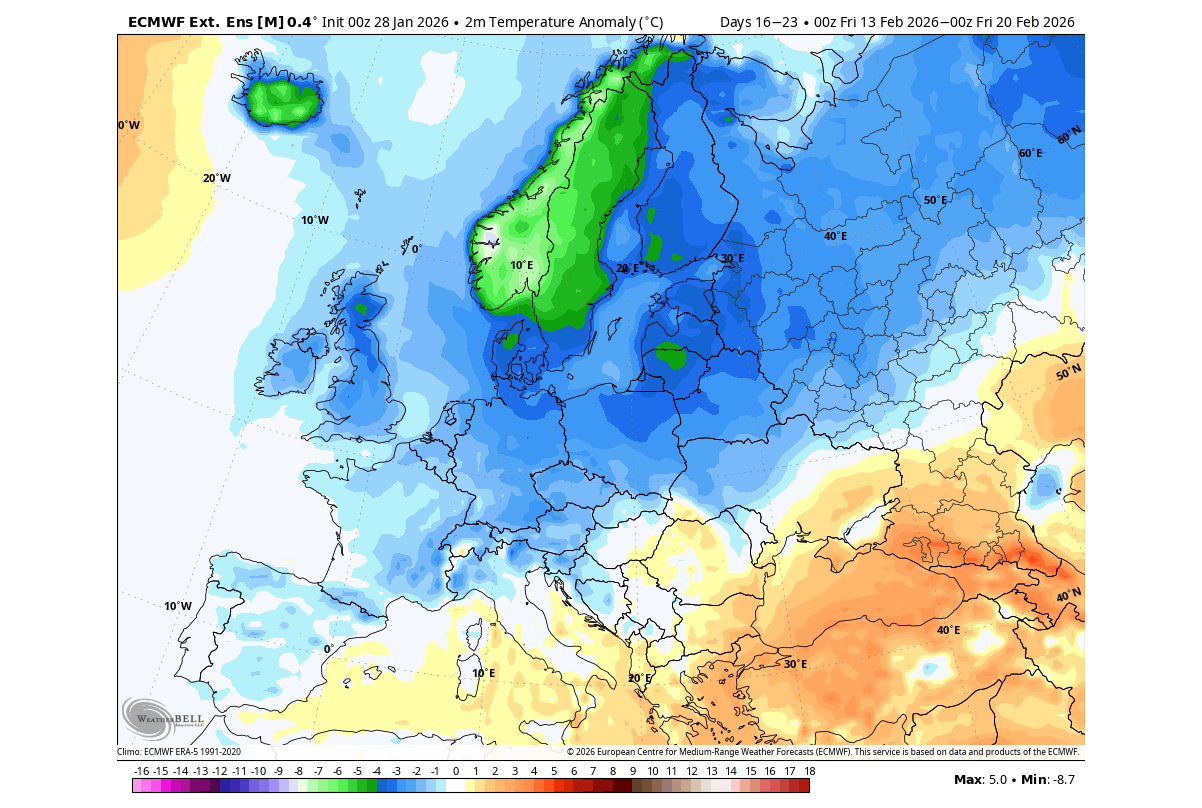
Across Europe, the temperature anomaly forecast for mid-February shows the cold airmass descending from the north. This also shows almost an exact copy of the expected temperature pattern after a stratospheric warming event, seen in the previous section.
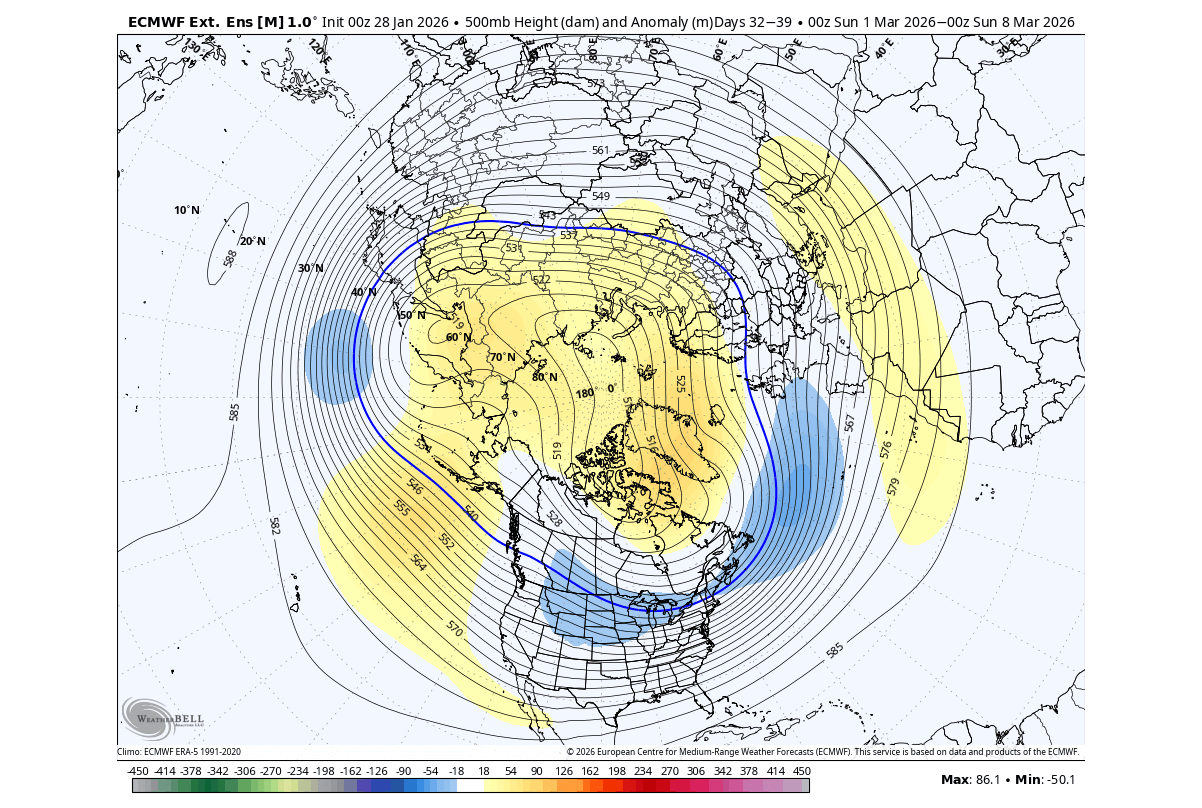
Looking ahead into early March, the latest pressure forecast trend shows continued collapse of the weather circulation. You can see a clear high-pressure blocking signal over the Polar regions, and low-pressure systems over the United States and towards Europe. This is exactly what the past data suggested could happen after a mid-February SSW event.
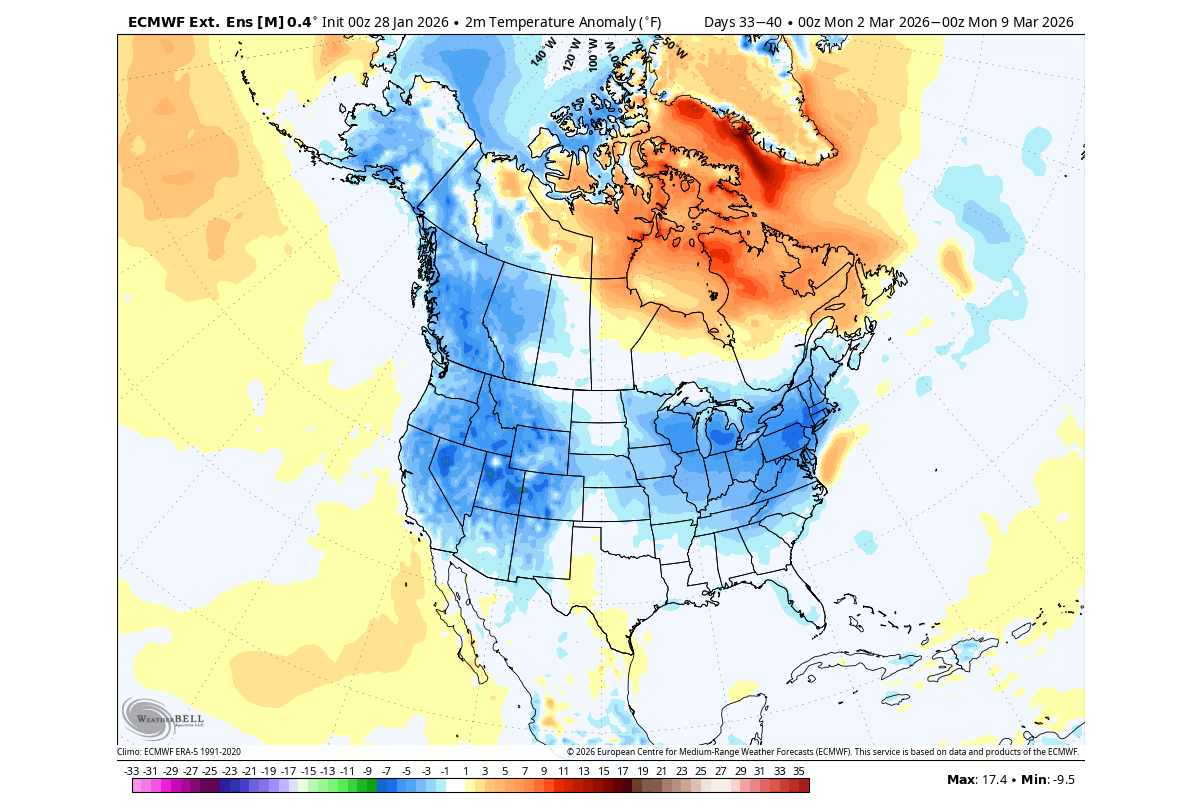
The ECMWF ensemble temperature forecast shows a continued cold trend into early March. We can see below-normal temperatures over western Canada, which usually acts as a source region for cold, before it is released into the United States, as the forecast also suggests.
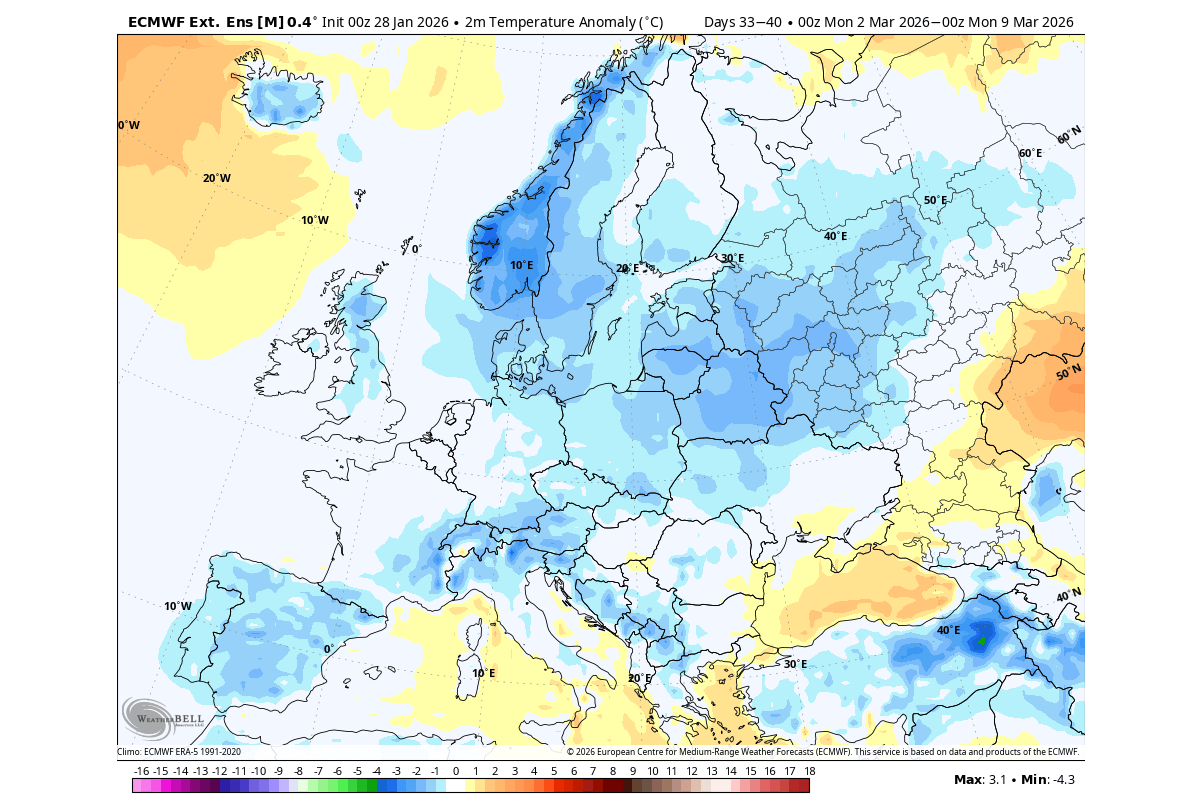
Even over Europe, the temperature forecast for this period is trending cooler over a larger part of the continent. This is expected to occur after a Stratospheric Warming and a Polar Vortex collapse, when colder air is released from the Polar regions. But some caveats apply to these extended-range forecasts.
We have to keep in mind that this is a week 4+ forecast trend. At this range, we do not look at the temperature in New York or Washington on March 1st at noon, but we look at the broad pressure anomalies across the Northern Hemisphere.
The goal is to identify the expected signals following a stratospheric warming event, which can confirm that a specific pattern is developing on a weekly timescale across the Northern Hemisphere.
Currently, we see all the right signs, which give confidence that a textbook weather response to the stratospheric warming event will occur across the United States, Canada, and Europe.
This article is based on the latest available model/ensemble data, and we will continue to release weekly updates on this developing Polar Vortex situation.
We will keep you updated on the global weather pattern development, so don’t forget to bookmark our page. Also, if you have seen this article in the Google App (Discover) feed, click the like button (♥) there to see more of our forecasts and our latest articles on weather and nature in general.
The main forecast images in this article are from WeatherBell and weathermodels.com, using a commercial forecaster license.
Don’t miss:
La Niña is Dissolving Rapidly, Marking the Start of a Major Atmospheric and Oceanic Shift for 2026