The latest forecasts indicate a new disruption of the Polar Vortex, following a Stratospheric Warming event confirmed for mid-January. Latest high-resolution model data reveals a breakdown of the polar circulation, forecast to release Arctic air across North America and Europe.
The Polar Vortex is usually the “keeper” of cold, locking it into the polar regions when strong. But when disrupted or collapsed, the cold air can escape, creating proper winter weather across the mid-latitudes.
Using the latest ensemble data, we are tracking how this stratospheric anomaly will redefine January weather patterns, potentially locking in a cold air release that could last well into early February.
The Large Polar Vortex Structure
Since we have a lot of new readers, or readers not that familiar with the Polar Vortex, we decided to include a very short rundown on what the Polar Vortex really is.
In simple terms, the Polar Vortex is a name for the broad winter circulation over the northern (and southern) hemispheres. You can imagine the Polar Vortex as a spinning wall over the polar regions, rising from the surface into the stratosphere (over 50km/30 30miles high) and trapping the cold polar air within.
As you can see in the image below, the Polar Vortex is separated into two layers that we monitor at all times around wintertime: the stratosphere and the troposphere. The first is the higher layer, and the second is at a lower altitude. The Polar Vortex rises through both layers, but with different strength, shape, and impacts.
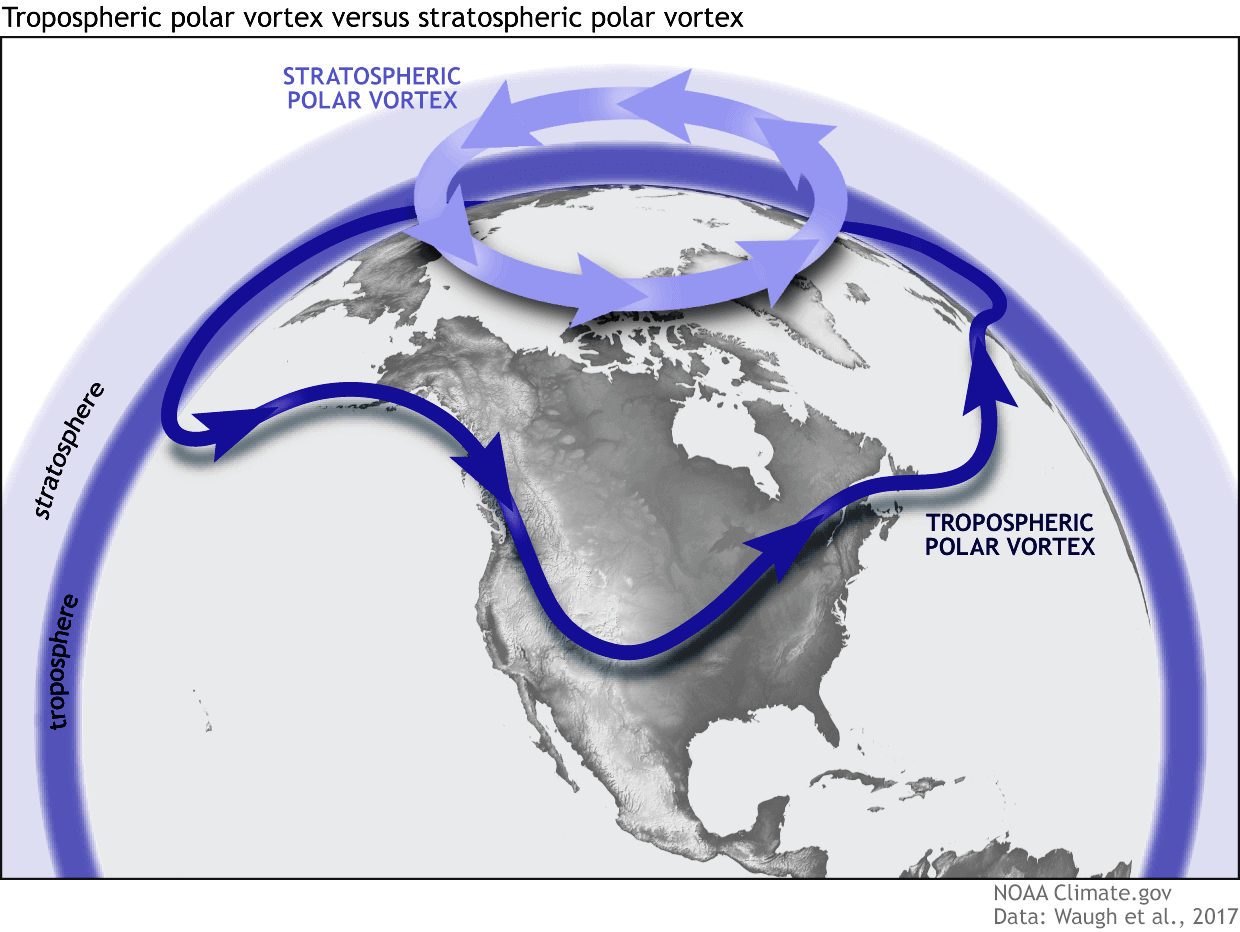
For this reason, we separate the entire Polar Vortex into an upper (stratospheric) and a lower (tropospheric) part. A strong Polar Vortex can lock the colder air into the polar regions, preventing its escape. This usually creates milder conditions for most of the United States, Europe, and other mid-latitudes.
But when the Polar Vortex gets disrupted or fully collapses, it can no longer contain cold air. This allows the cold air to easily escape from the polar regions into the United States and other mid-latitude regions. Below is an example of how a disrupted Polar Vortex brings cold polar air into the United States and Europe.
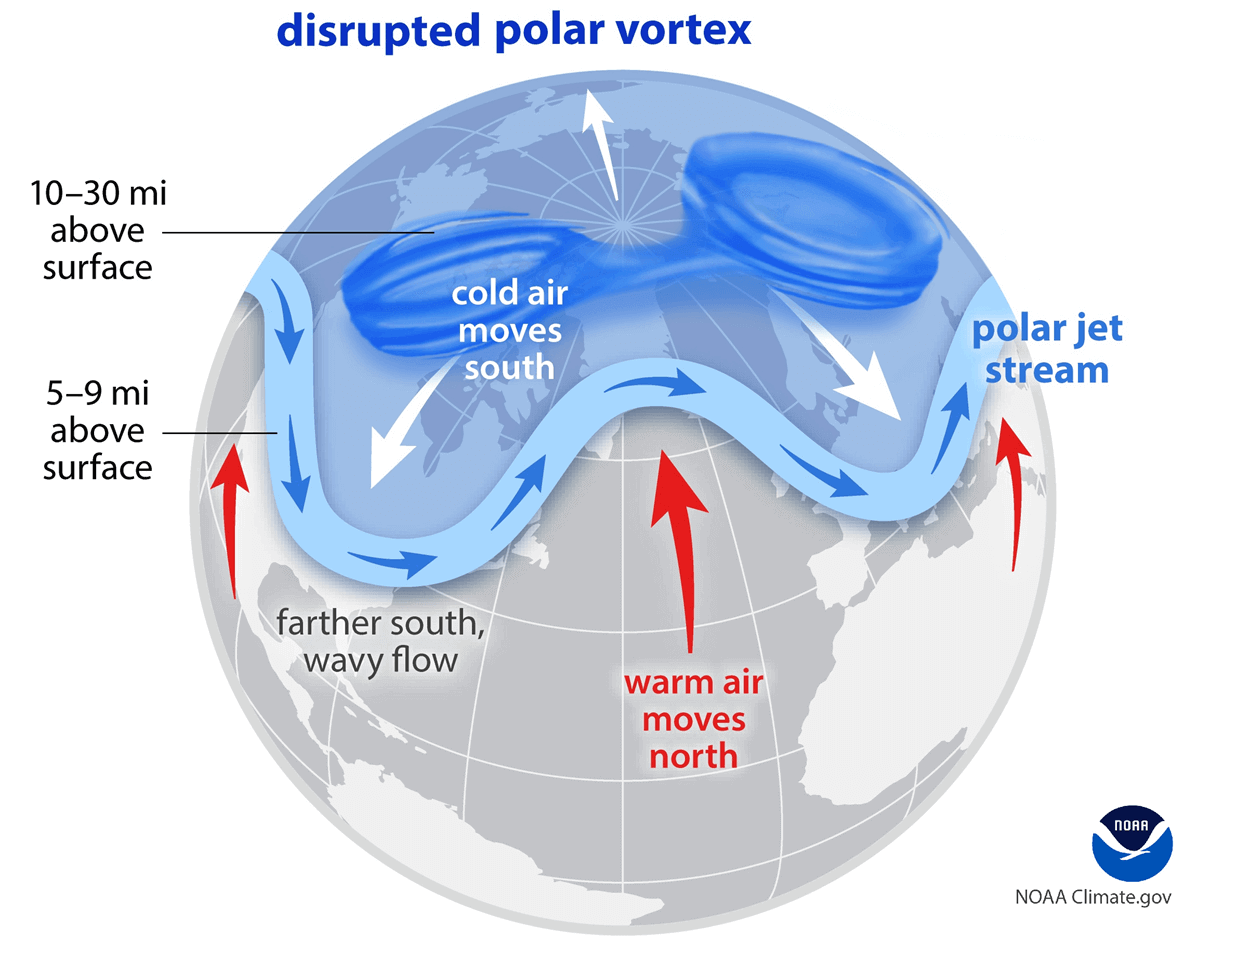
This weak/disrupted Polar Vortex is exactly what you want to see if you like cold weather across the United States, Canada, and Europe. The disruption itself usually comes from the rise in pressure and temperature in the stratosphere, called a Stratospheric Warming (SSW) event.
To better understand what the Polar Vortex is, we produced a high-resolution video below. It shows the latest Polar Vortex forecast in 3D, revealing the upcoming stratospheric warming event and the disruption of its structure.
We will now look at the latest state of the Polar Vortex and how a new Stratospheric Warming event will help to kickstart the winter pattern across the United States, Canada, and Europe.
Polar Vortex First Intensifies
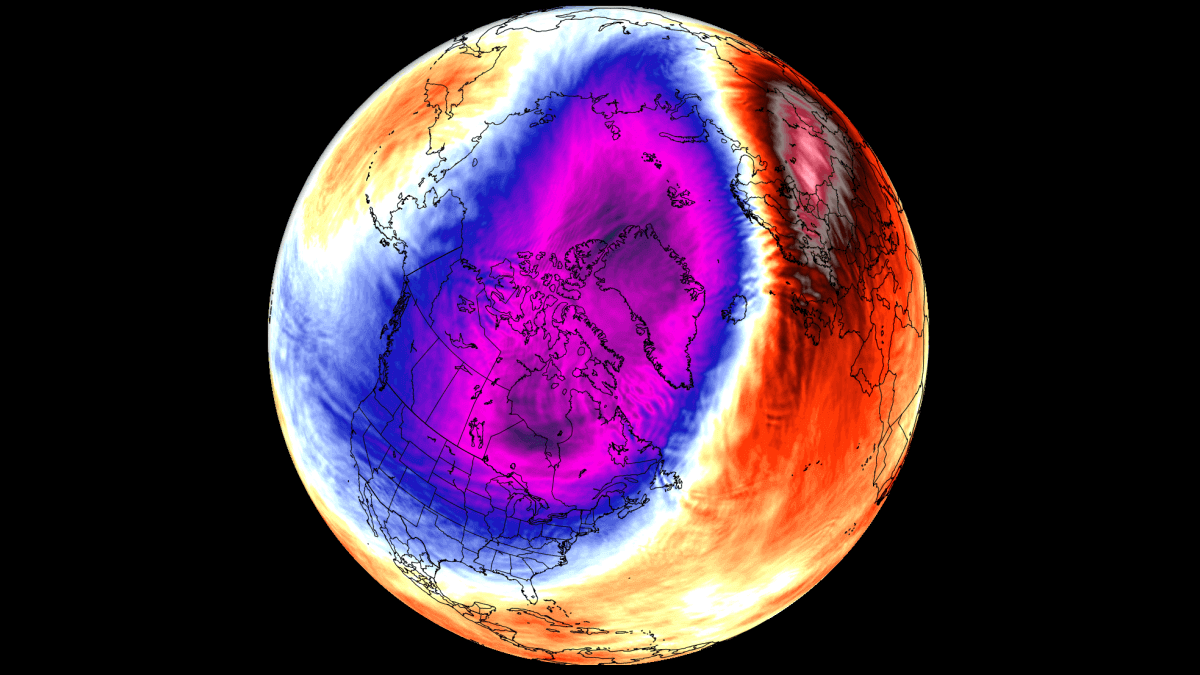
The latest analysis shows that the Polar Vortex is currently trying to regain its circular shape and regain strength. Below you can see geopotential height and temperature analysis in the mid-stratosphere at the 10mb level (30km/18.5miles height). The stratospheric Polar Vortex looks like a large “cyclone” with a cold core near its low-pressure center. Image by weatheriscool.com
While the Polar Vortex is starting to look stronger at this level in the stratosphere, you can still see that a high-pressure area is present, with a weak warming wave in the outer layers.
In the image below, you can see the pressure anomaly at the same time and level in the stratosphere, which shows that the main core of the Polar Vortex has proper low pressure, with two main areas of connection lower, over the eastern United States and Canada, and Europe. You can also better see the high-pressure zone.
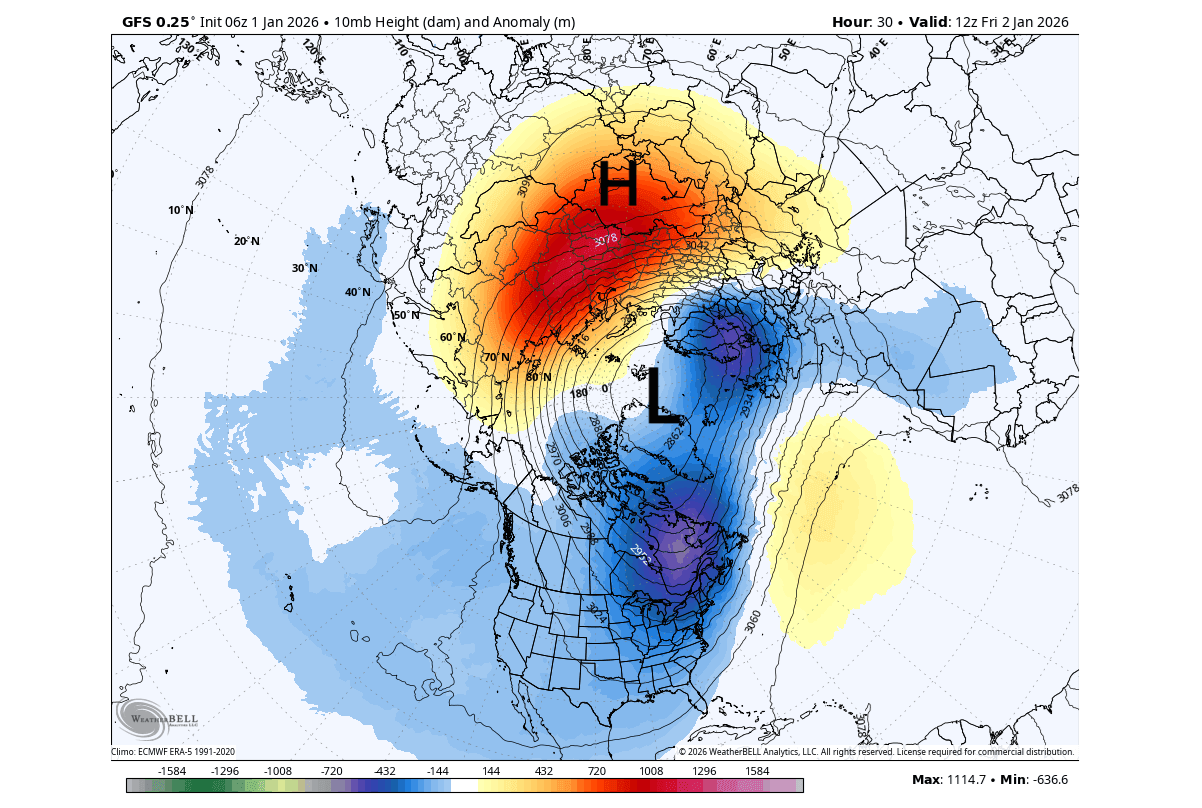
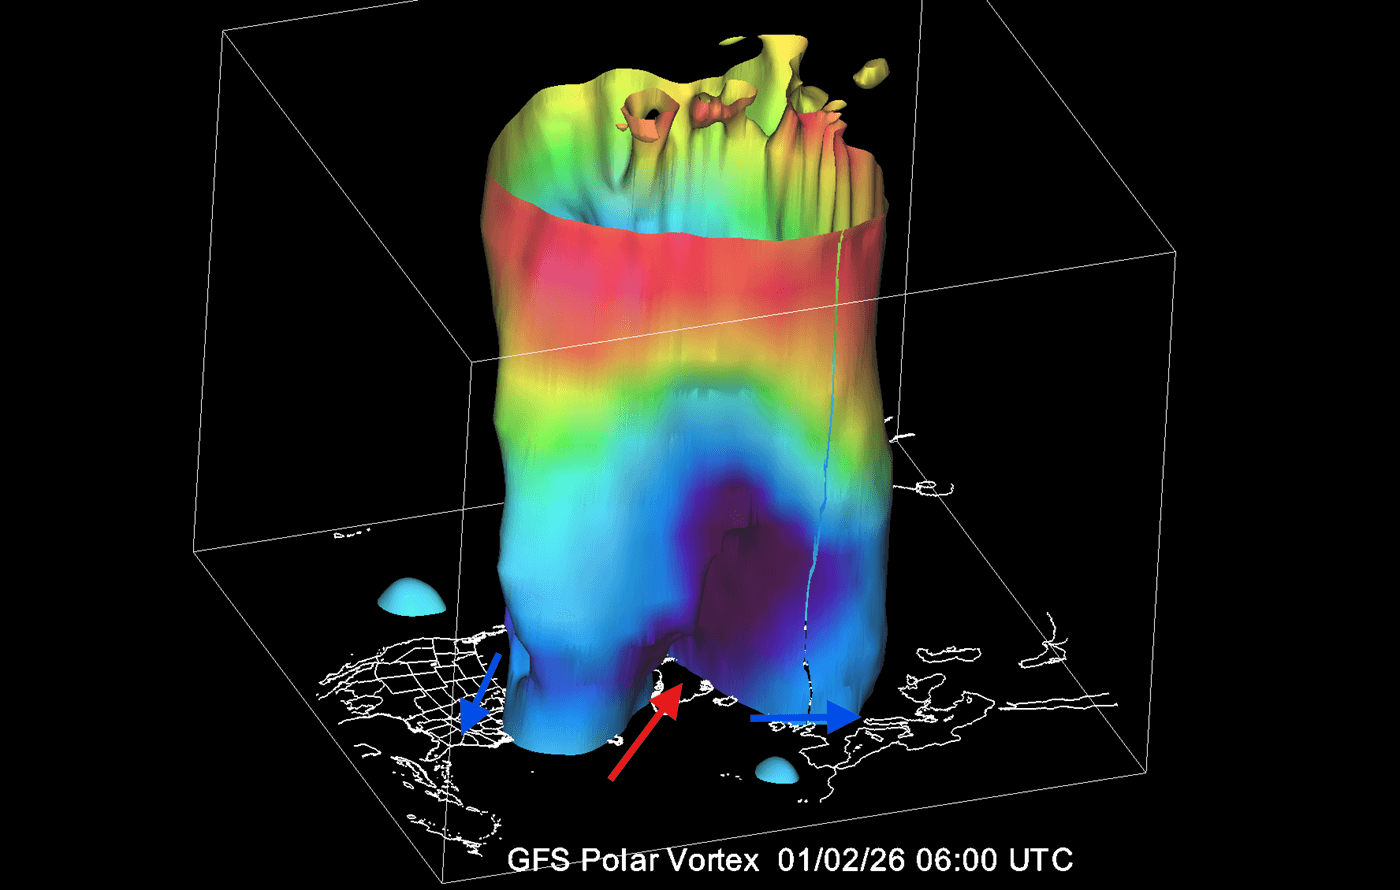
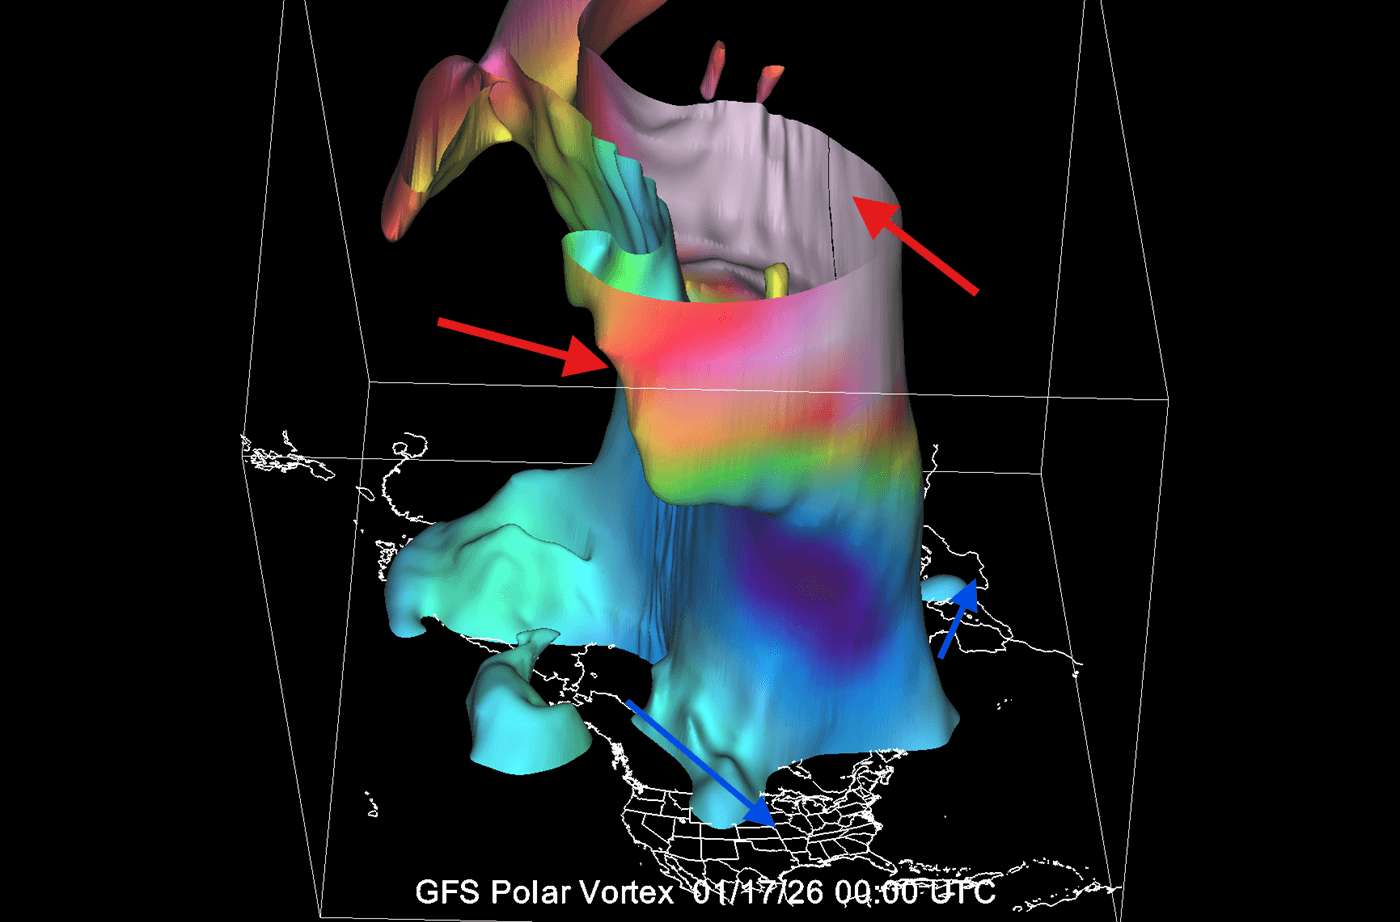
If we look at the latest 3D analysis of the Polar Vortex below, you can see its full structure. It shows the circular shape in the higher stratospheric levels, and you can also see how it connects to the lower levels. What stands out are its two “cold legs”, which are actually areas of low pressure, driving the current cold air into the eastern United States, eastern Canada, and Europe.
This is much better seen in the temperature forecast below for the next 24h. You can see a direct cold-air corridor into southern and eastern Canada, extending into the northern and eastern United States, and covering a larger part of the Midwest. There is also a colder airmass flooding Europe under the second leg of the Polar Vortex.
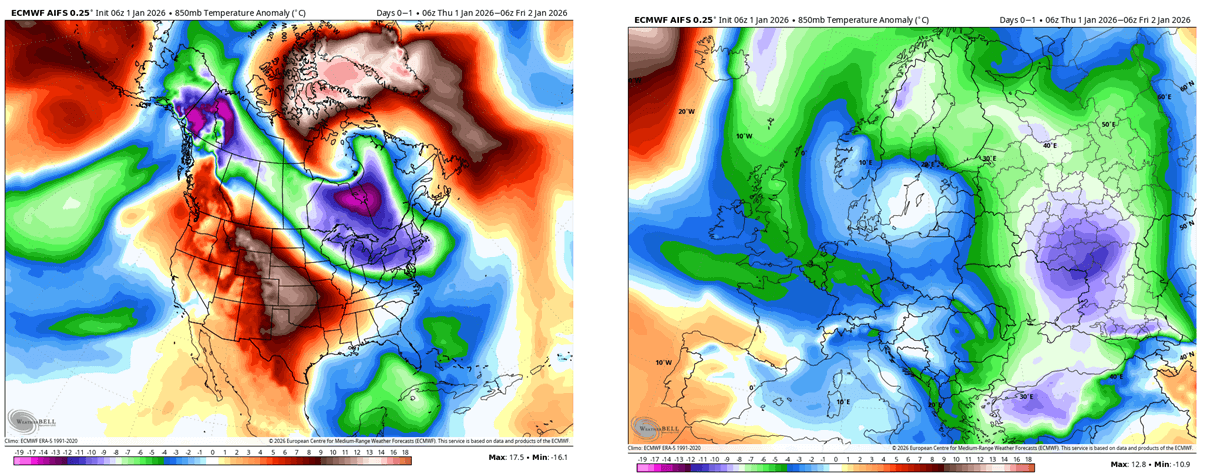
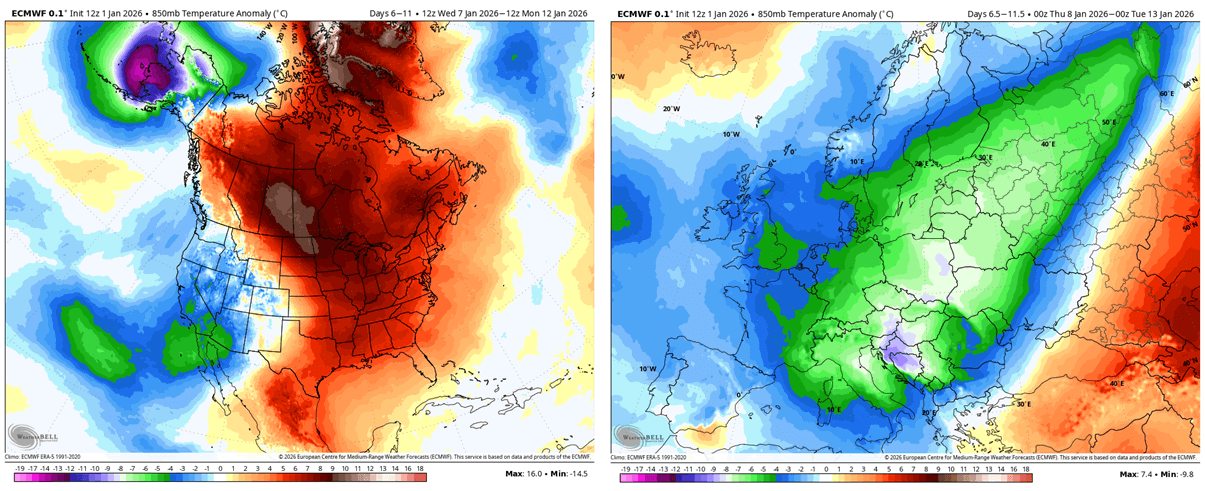
But looking into the second week of January, the ECMWF forecast below shows a brief warmup phase over North America, while cold air will linger over Europe for a while.
This is all related to the overall strength of the Polar Vortex. But how do we actually measure it? The simple answer is the winds. The more organized the stratospheric Polar Vortex is, the stronger the winds around its core, which usually translates to a stronger influence on the surface.
Below is the latest analysis and forecast of the mid-stratospheric winds around the Polar Vortex. The black line shows the long-term average, and the dashed lines are the last few forecasts. You can see that all forecasts indicate a power rise of the Polar Vortex over the next few days, as it also regains its shape.
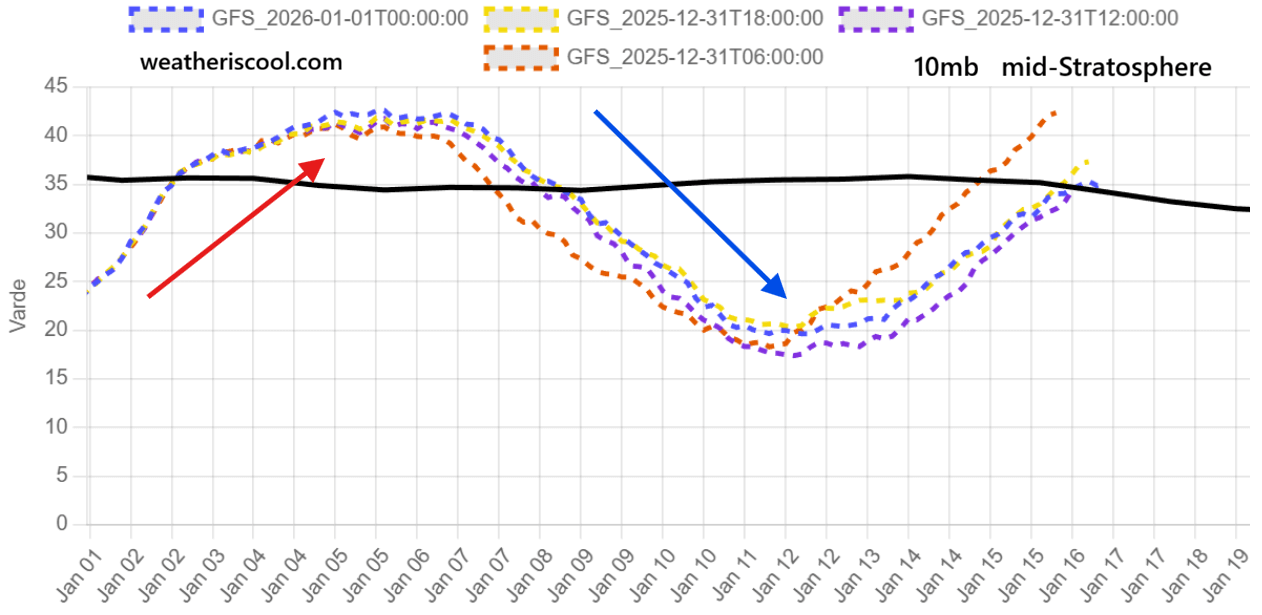
But all the forecasts also show another weakening/disruption of the Polar Vortex into the second week of January. This is associated with a Stratospheric Warming (SSW) wave. This is what we usually track in the power graphs, as it often comes with a weather change in the lower levels.
Below is a simple schematic of how a Polar Vortex starts to weaken during a Sudden Stratospheric Warming (SSW) event. The main disruptive energy comes from the lower levels first, with atmospheric waves reflecting energy up into the stratosphere.
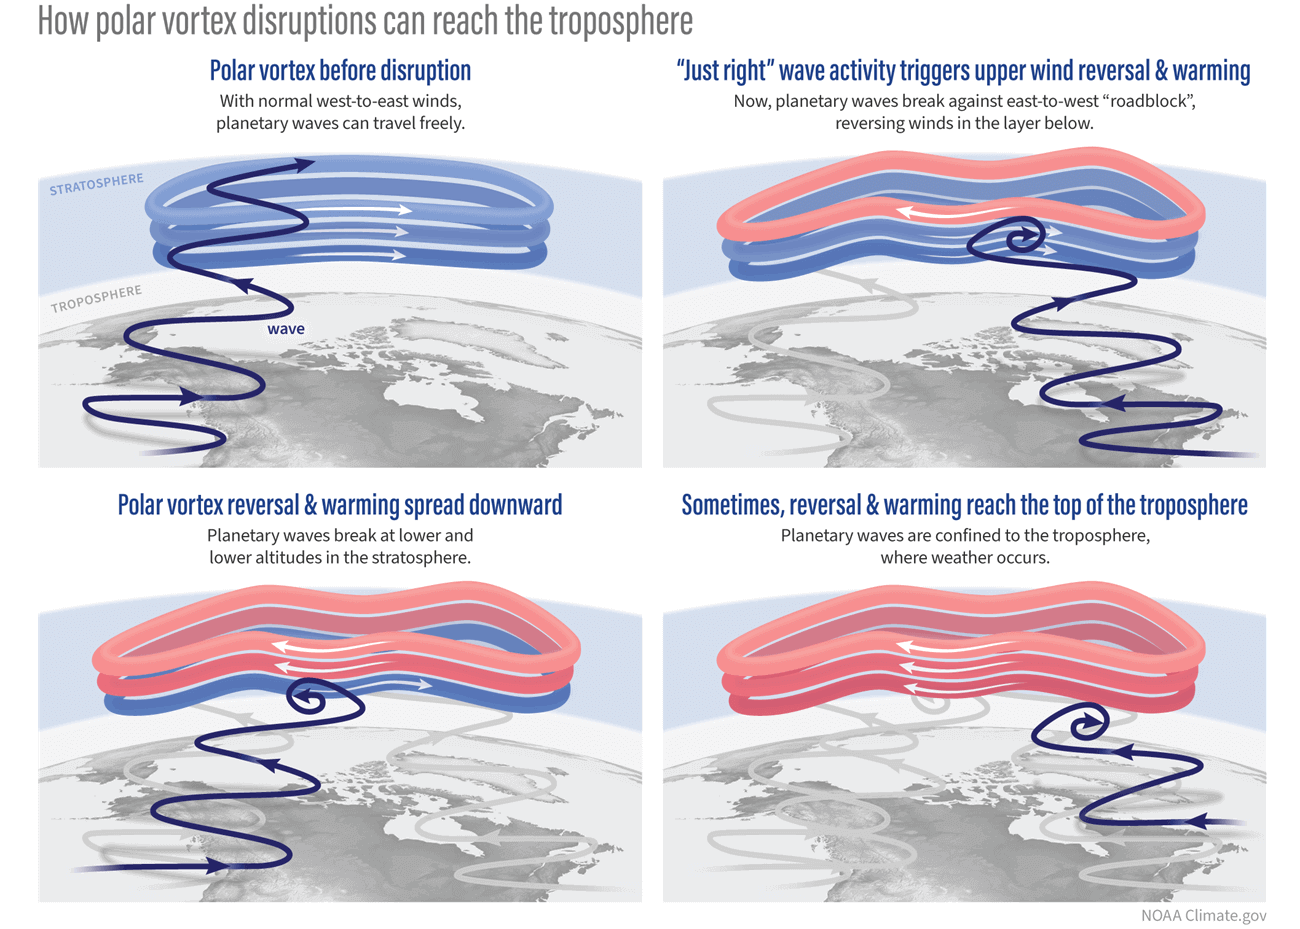
This energy starts to disrupt the Polar Vortex by creating areas of higher temperature and pressure in the stratosphere. The disruption of the Polar Vortex then allows cold air to more freely escape the polar regions, covering the United States and/or Europe in Winter in the process.
The reason we want to know this is because it shows how the lower and upper parts of the atmosphere are connected. A proper combination of pressure anomalies in the lower levels causes a disruption of the Polar Vortex, which can send feedback back down and amplify the pressure patterns to allow cold air release.
New Stratospheric Warming Signal Detected
Below is the 5-day pressure pattern forecast at 500mb, in the lower levels of the atmosphere. You can see a very disrupted pattern, with multiple pressure waves of highs and lows. These strong waves can send a lot of energy up into the stratosphere, and look like something you expect to see before the stratosphere answers back in mid-month.
As mentioned, a stratospheric warming event means a rise in pressure and temperature in the stratosphere, putting stress on the Polar Vortex. The most recent SSW event occurred in late November/early December, with a strong blow to the Polar Vortex.
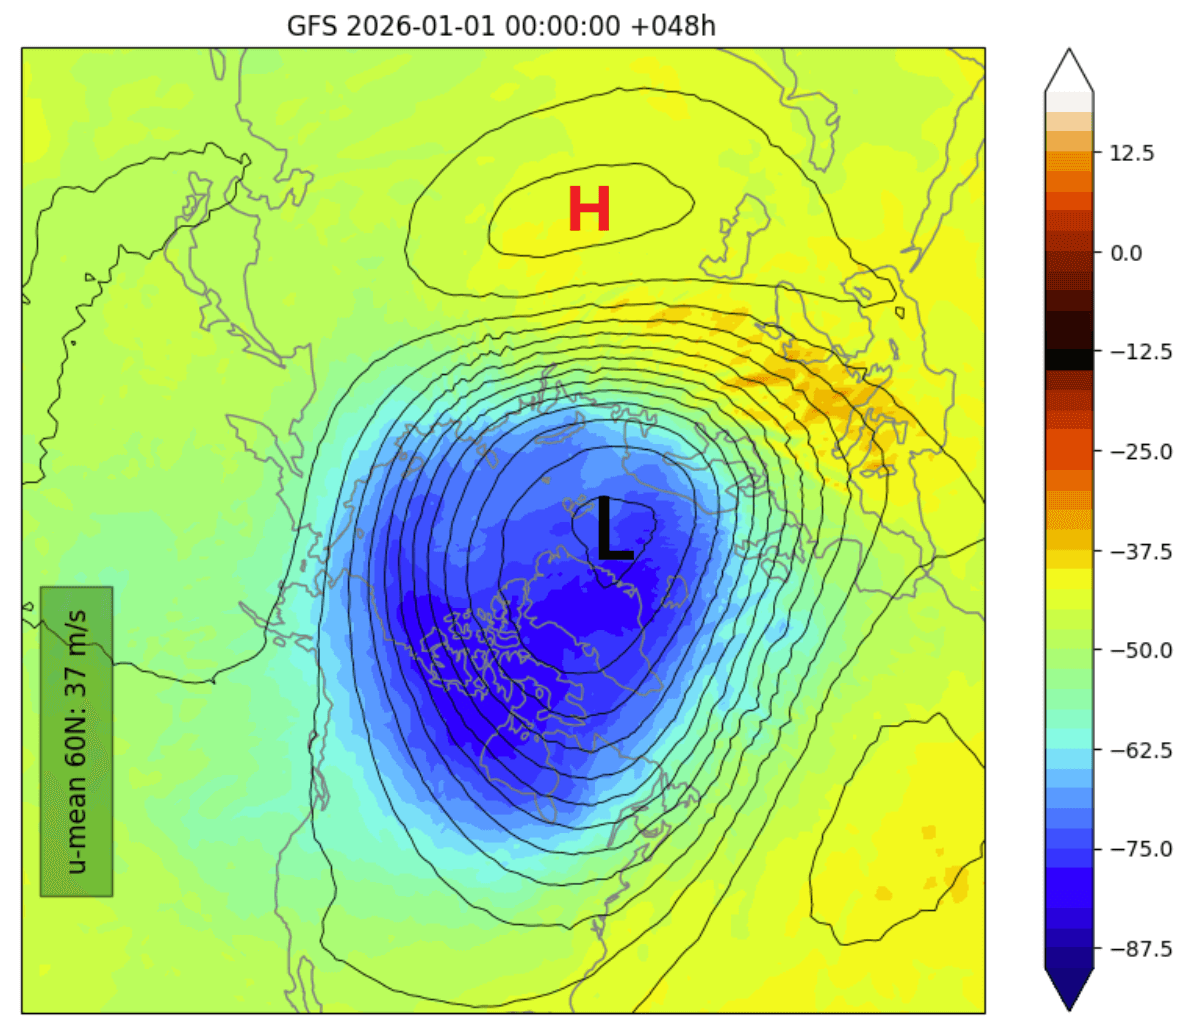
Below is the pressure and temperature forecast for day 10, in the mid-stratosphere at the 10mb level (30km/18.5miles height). You can see a strong high-pressure area (H) in the mid-stratosphere, and a strong warming wave occurring where it comes together with the Polar Vortex (L), deforming and disrupting its structure.
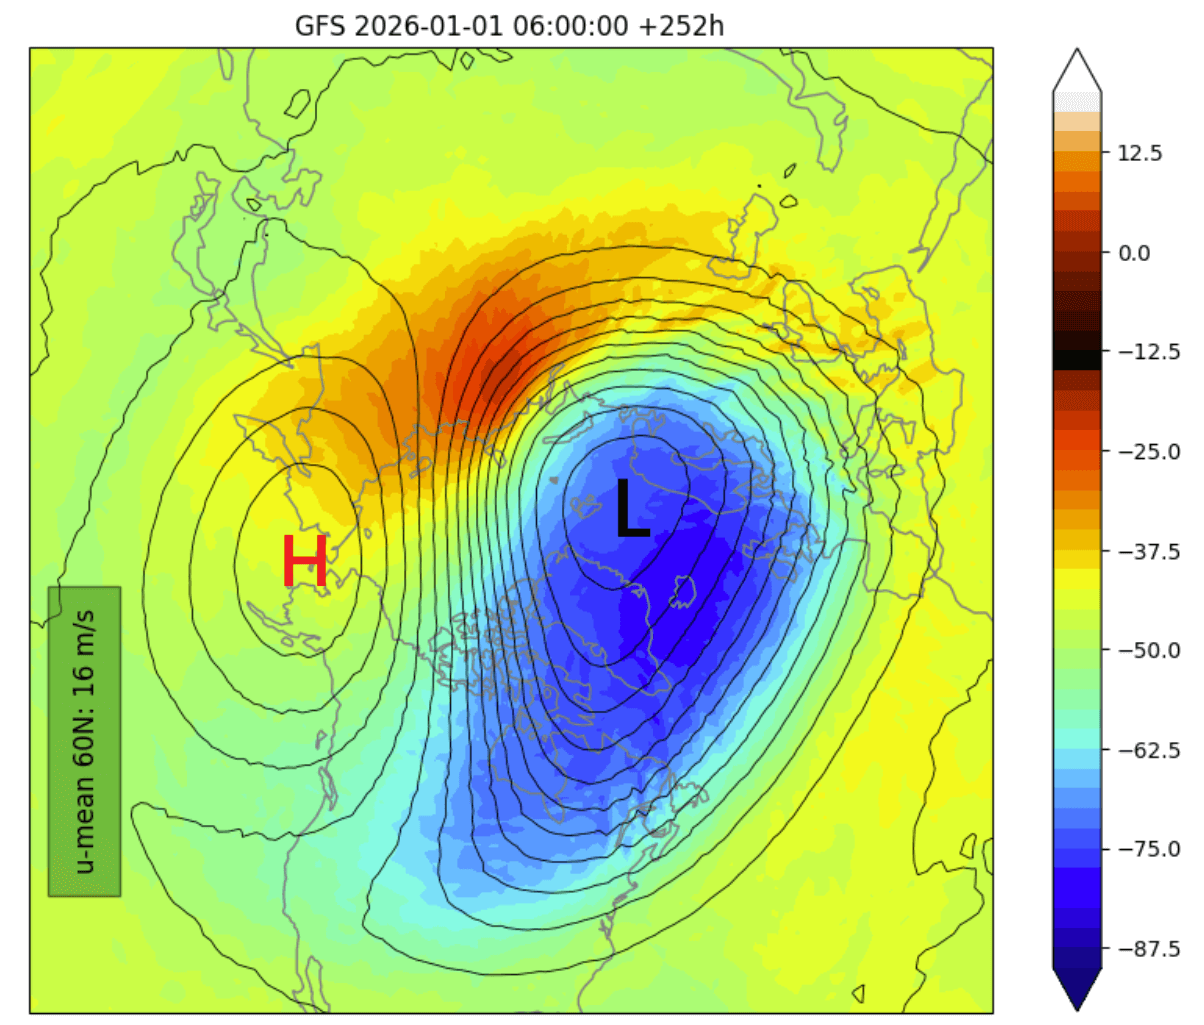
This is an example of a stratospheric warming event where the Polar Vortex is not collapsed, and the stratospheric winds are not reversed, so it’s not classified as a major SSW event. But these events can stretch the Polar Vortex, with its structure sending a lower Polar Vortex leg into North America, for example.
Below is the mid-stratosphere pressure anomaly forecast for the same level and period. In this image, you can clearly see the large high-pressure anomaly in the mid-stratosphere at the 10mb level (30km/18.5miles height), disrupting the Polar Vortex, slowing it down, and causing it to stretch into North America and Europe.

The true extent of the stratospheric warming event is evident below in the latest temperature anomaly forecast at the same 10mb level. You can see a strong warming anomaly over the polar regions, with temperatures in the mid-stratosphere near 20-30 degrees C above normal, and the cold core pushed towards the United States and Canada.

This just shows how, despite being a moderate event, this mid-winter SSW can help to set up a weather pattern change in the lower levels of the atmosphere.
Below is also a 3D forecast of the Polar Vortex for around mid-month. You can clearly see a highly disrupted structure and a deformed core, with a warming event in the upper stratosphere. You can also see how the Polar Vortex is overall deformed, with potential cold “legs” reaching into the United States and Europe.
This is the point where we can start to focus on the lower levels and find hints of the impact on daily weather in January. But to answer that, we first need to find signs of it actually making progress downwards from the stratosphere.
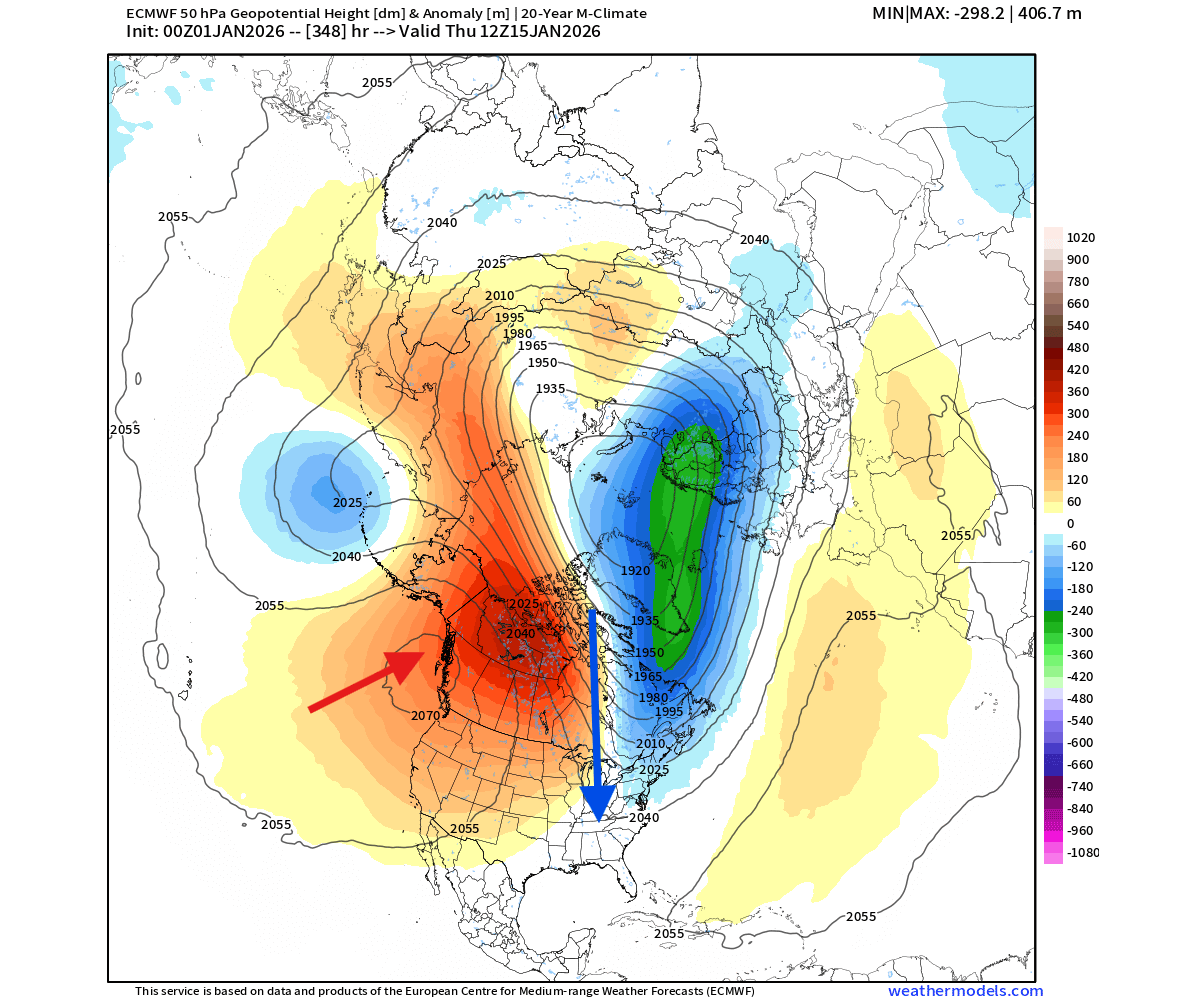
In the forecast graphic below, you can see the pressure anomaly forecast for the lower stratosphere at the 50mb level (20km/12.4 miles). It shows a strong high-pressure anomaly over the northeast Pacific and Alaska, and a clearly displaced Polar Vortex core. It also shows the stretching of the lower Polar Vortex into the eastern United States, Canada, and towards Europe.
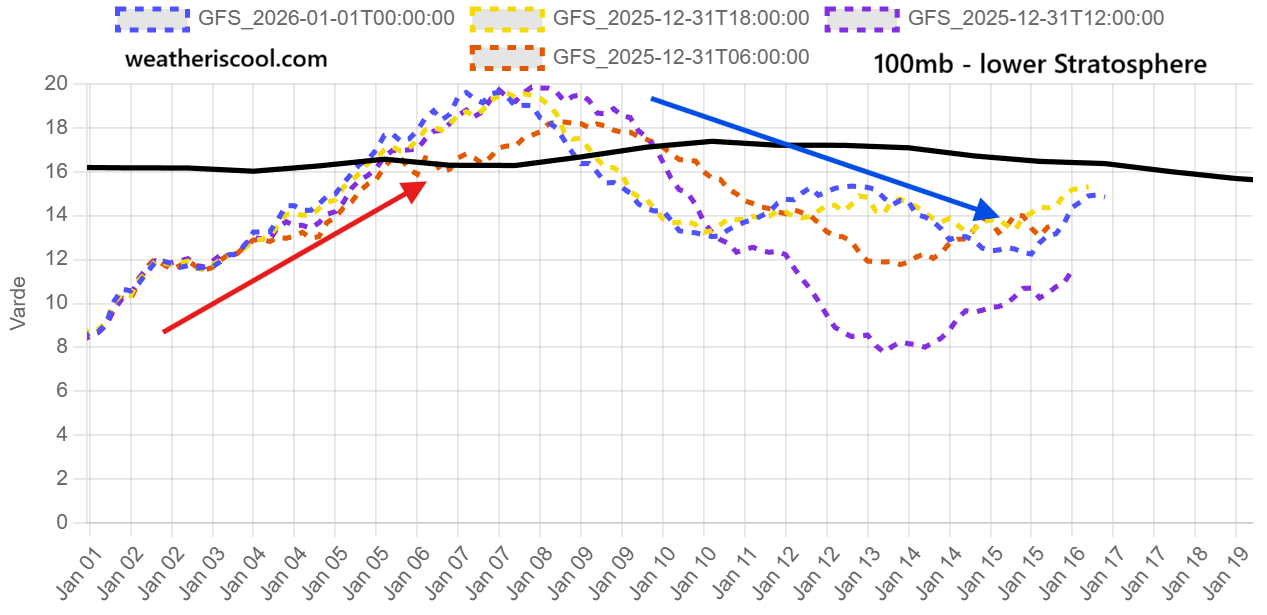
But if we go even lower down, to the bottom of the stratosphere at the 100mb level (16km/10miles height), we can look at the zonal wind speeds again. The forecast first shows an increase, associated with the warmup over North America. But you can clearly see a reduction in the wind speeds, which indicates the arrival of the stratospheric warming effect on the weather patterns towards mid-January.
These warming events are notorious for having weather impacts all the way to the surface levels. And we can look at the ensemble forecasts to find the weather pattern changes over the United States, Canada, and Europe in January.
Arctic Air Targets the U.S. and Europe
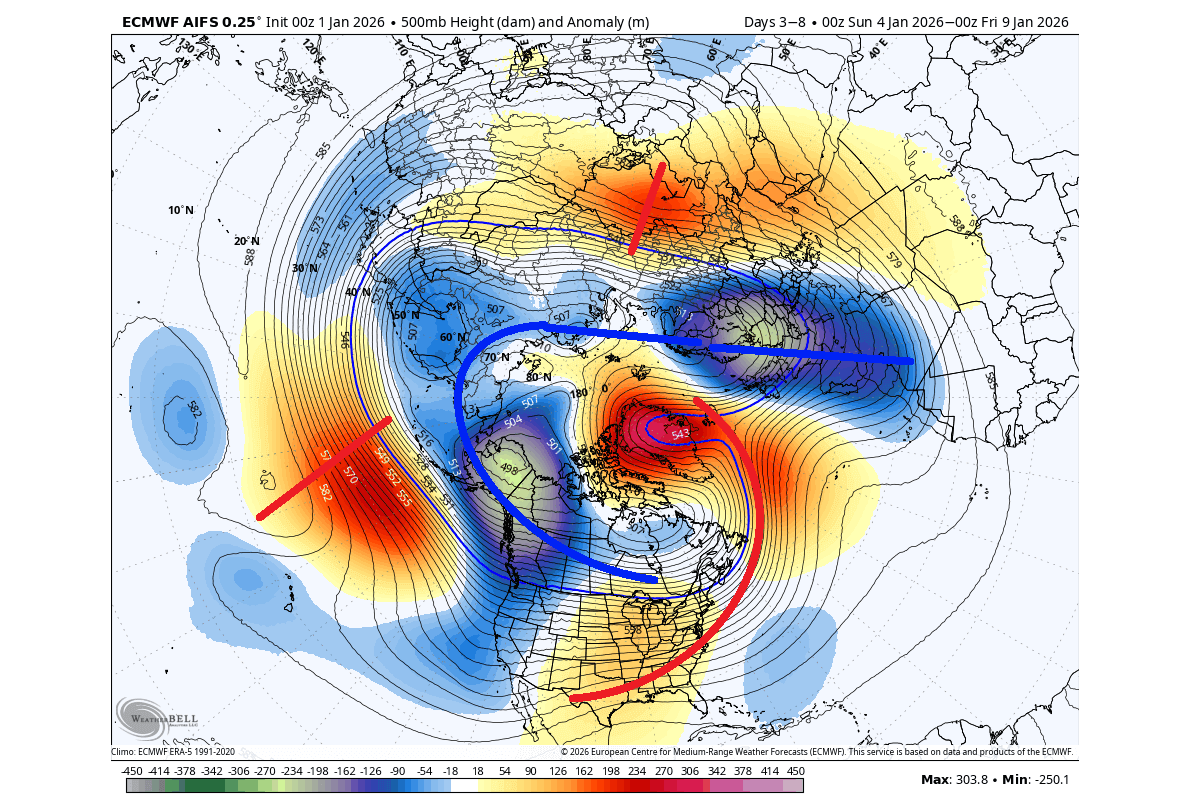
Below is the 500mb pressure anomaly forecast for mid-January, and it shows a different pressure pattern developing. A high-pressure zone is present over the northeast Pacific and the Aleutians, which helps to bring an Arctic flow with a low-pressure Polar Vortex core into eastern Canada and the eastern United States.
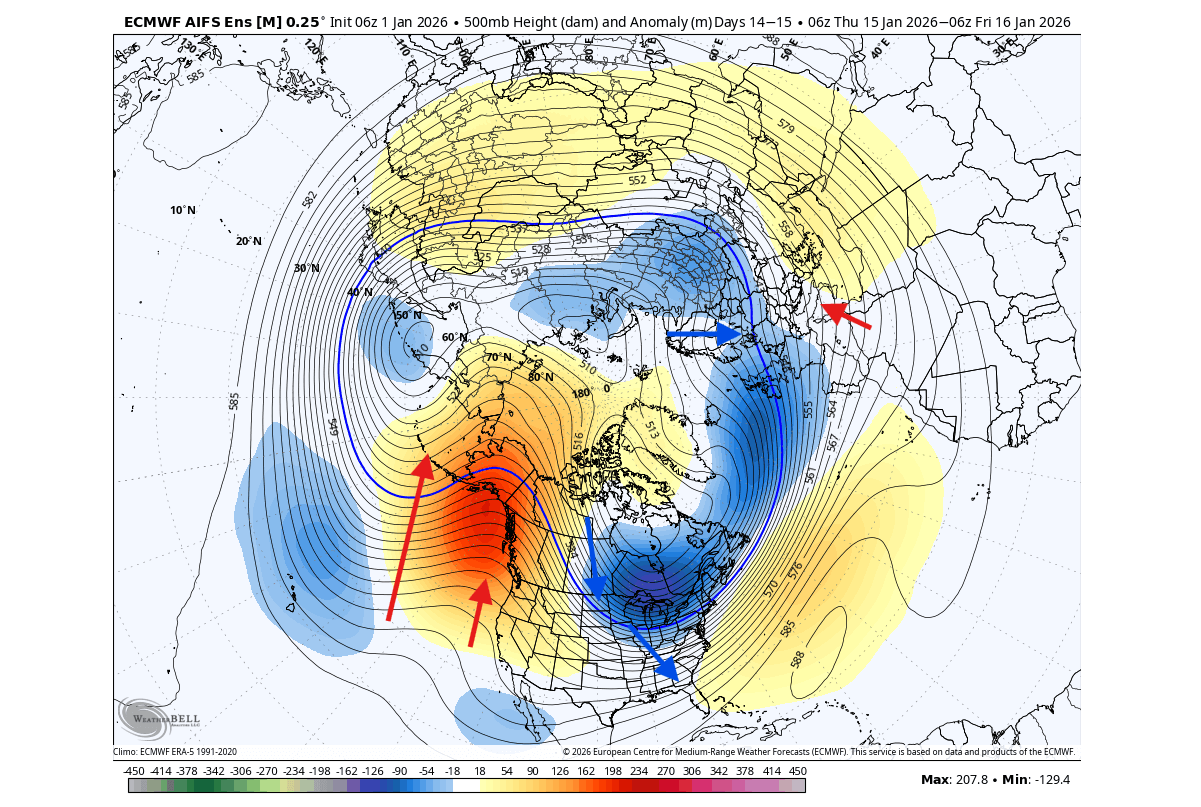
You can see an overall disrupted look, with a lot of pressure waves, and a high-pressure anomaly over the polar regions. A low-pressure area is also evident in the North Atlantic and over Europe.
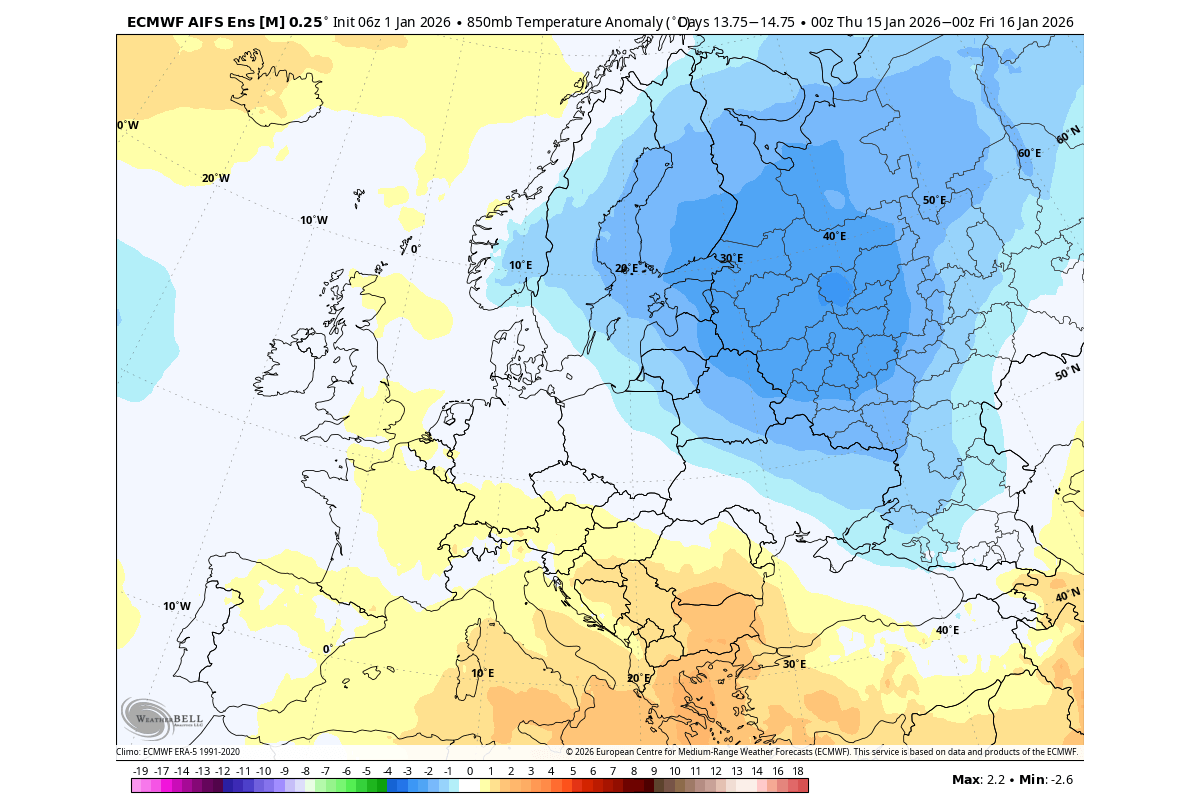
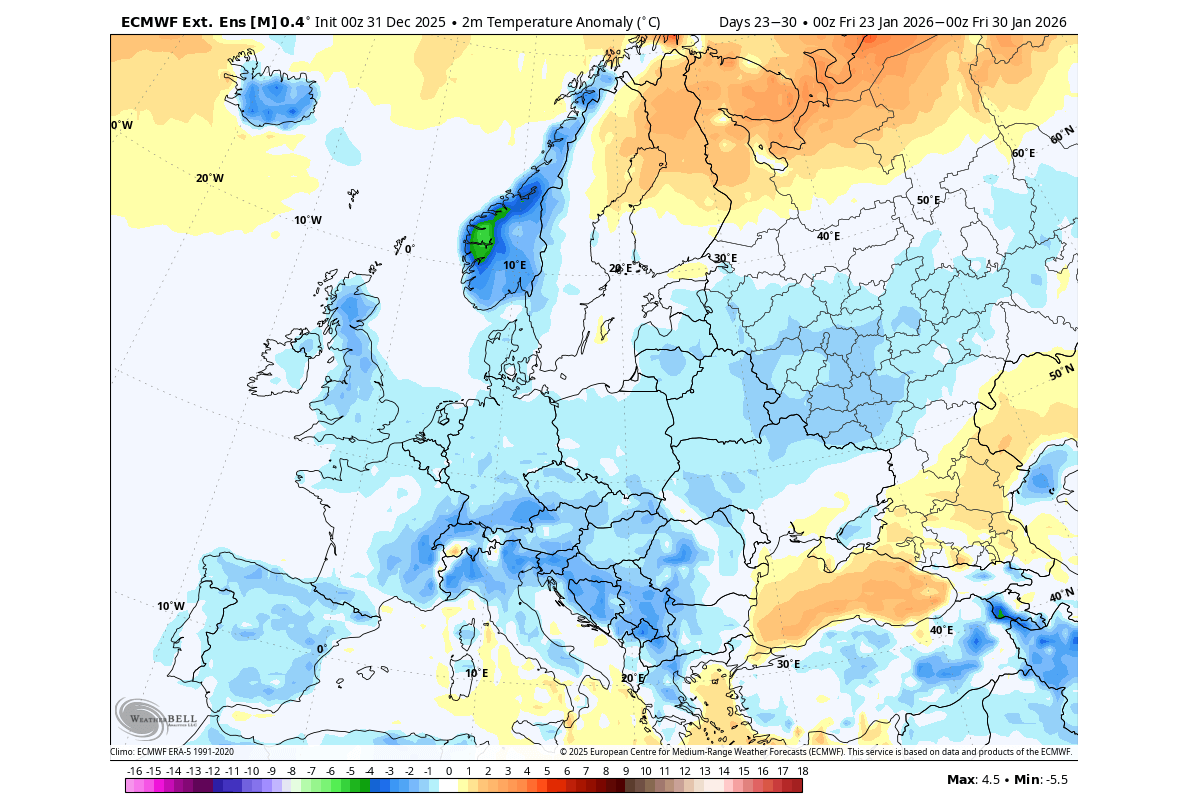
Looking at Europe first, the airmass temperature anomaly forecast for this period shows a supply of colder air over the northern parts. But because there is a low-pressure area in the North Atlantic, this is likely to create a (brief) mild period over the western and southern parts.
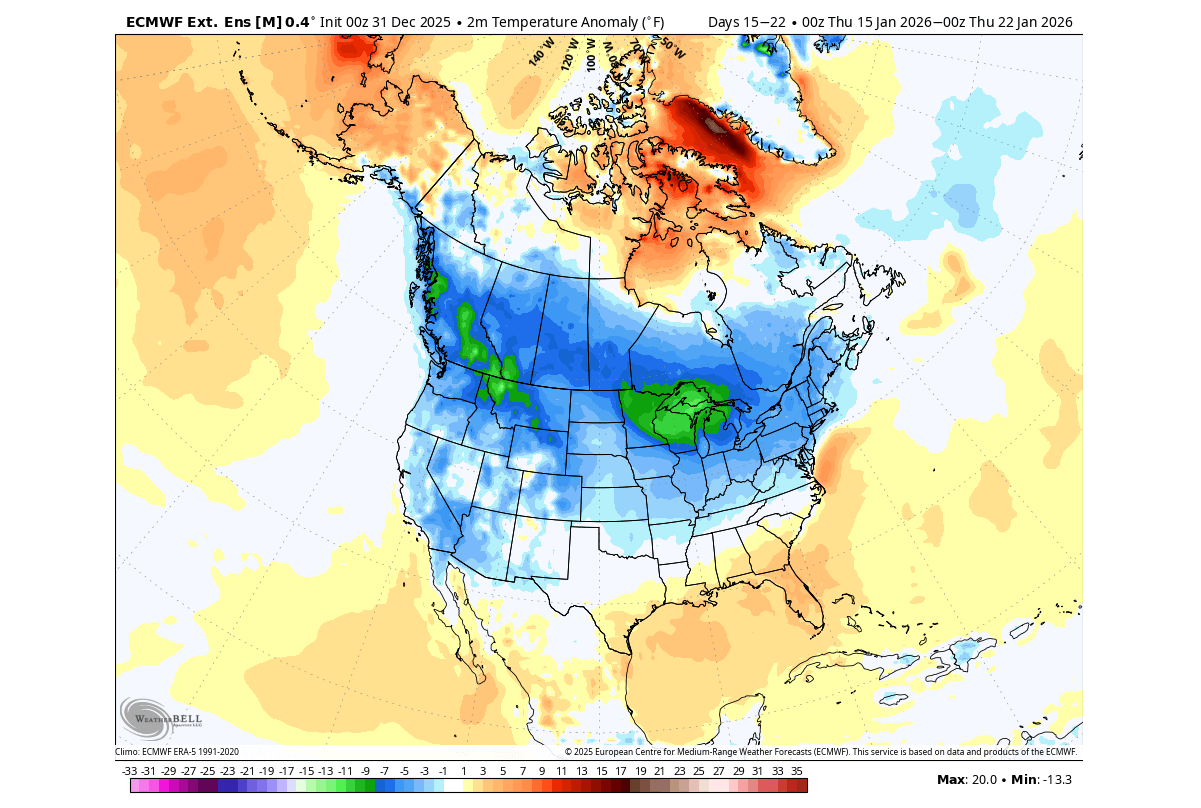
The airmass temperature anomaly forecast for the United States and Canada shows a return to a colder pattern around mid-month. A colder northerly flow is forecast to establish, thanks to the pressure rise to the northwest, and a stretched Polar Vortex into North America, following the Stratospheric Warming phase.

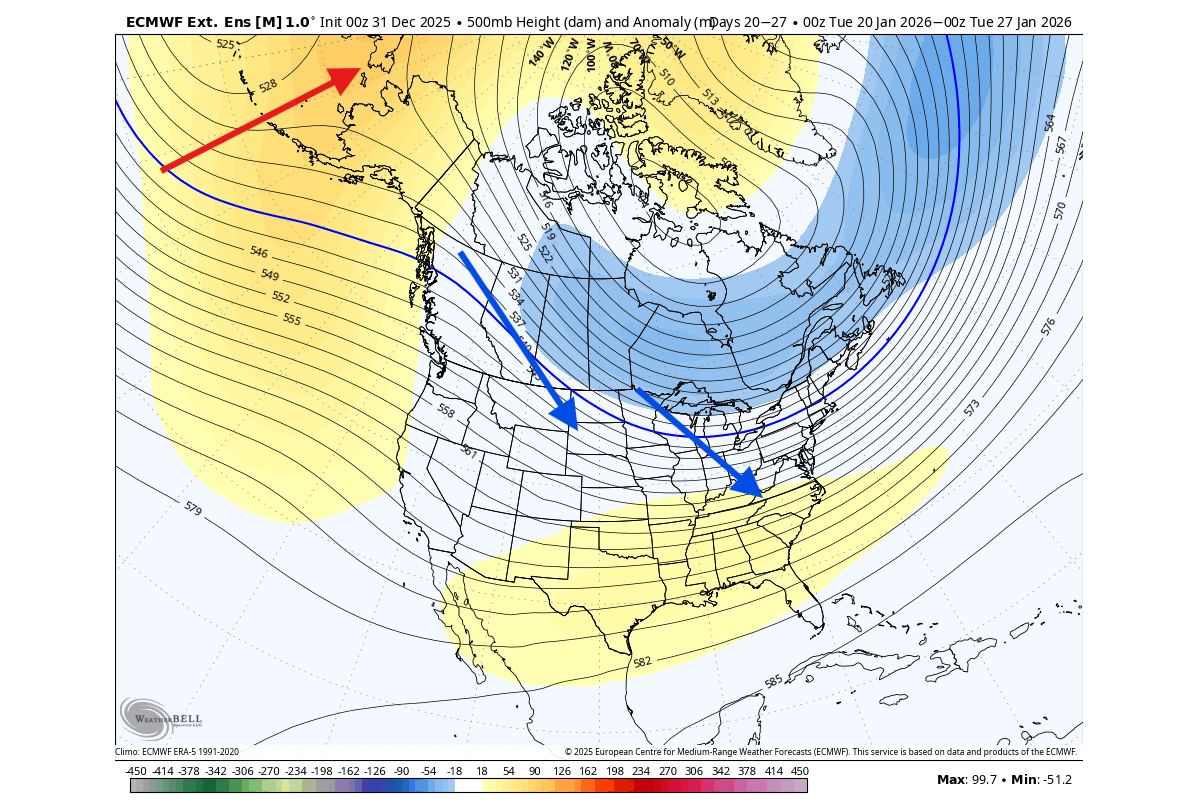
Going into the second half of January, the pressure forecast shows that the Polar Vortex core is forecast over eastern Canada. This allows for a northerly and northwesterly flow from western Canada into the northern, central, and eastern United States. The low-pressure anomaly also extends towards Europe.
The ECMWF ensemble temperature forecast for this period shows this colder pattern, with a stable cold air corridor from southern Canada down into the northern, central, and eastern United States. This is a 7-day average, but the trends for now support the cold air release in the second half of January, following the disruption of the Polar Vortex.
Over Europe, the temperature forecast for this period also shows the colder air covering most of the continent, under a northerly flow and lower pressure. This is expected to occur after a Stratospheric Warming and a Polar Vortex disruption, as it releases the cold air from the Arctic Circle into the mid-latitudes.
Of course, we have to keep in mind that this is the extended range forecast. But what gives us good confidence is that this is not some random forecast, but a pattern following a Stratospheric Warming event.
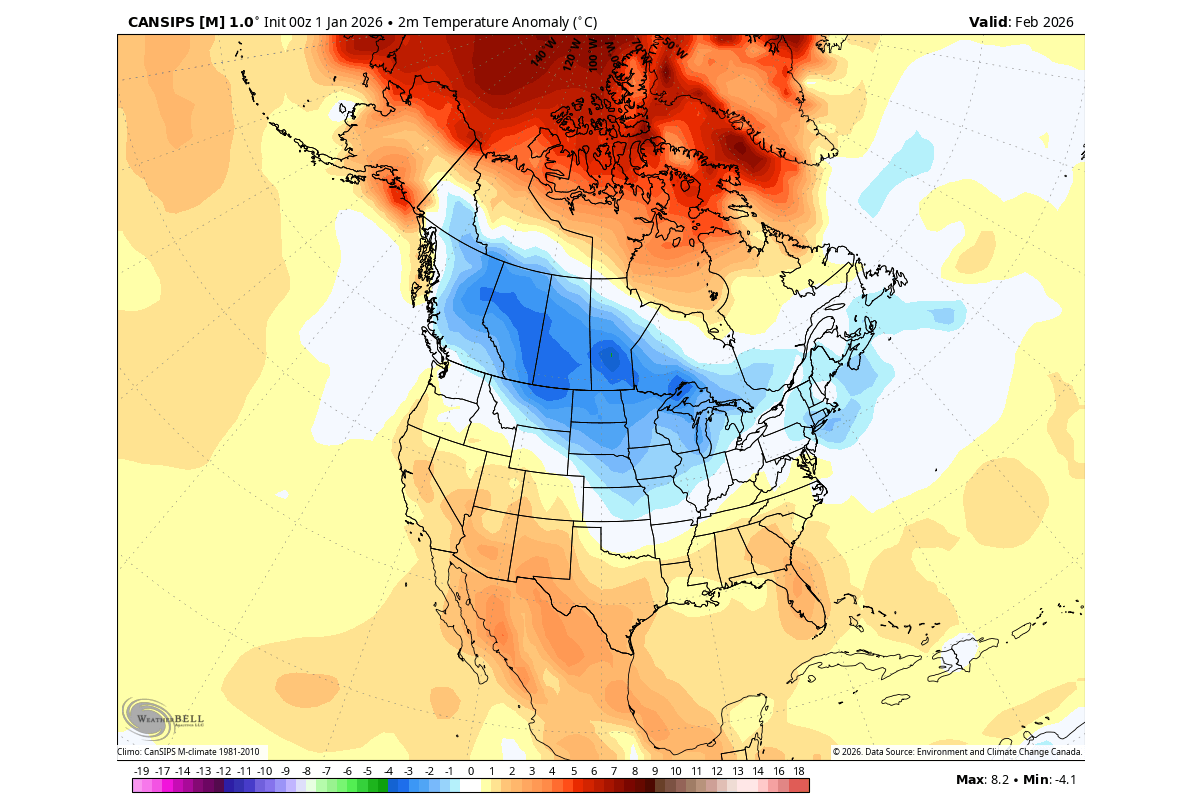
Just today, the Canadian long-range model (CanSIPS) has been updated, and its February 2026 forecast shows continued cold-air support over western Canada and the northern and central United States. This is just a monthly average, but shows the continued support for a northerly flow into the United States continuing into February.
This article is based on the latest available model/ensemble data, and we will continue to release weekly updates on this developing Polar Vortex situation.
We will keep you updated on the global weather pattern development, so don’t forget to bookmark our page. Also, if you have seen this article in the Google App (Discover) feed, click the like button (♥) there to see more of our forecasts and our latest articles on weather and nature in general.
The main forecast images in this article are from WeatherBell and weathermodels.com, using a commercial forecaster license.
Don’t miss:
Long Range Watch: Latest Forecasts Show El Niño Returning in 2026