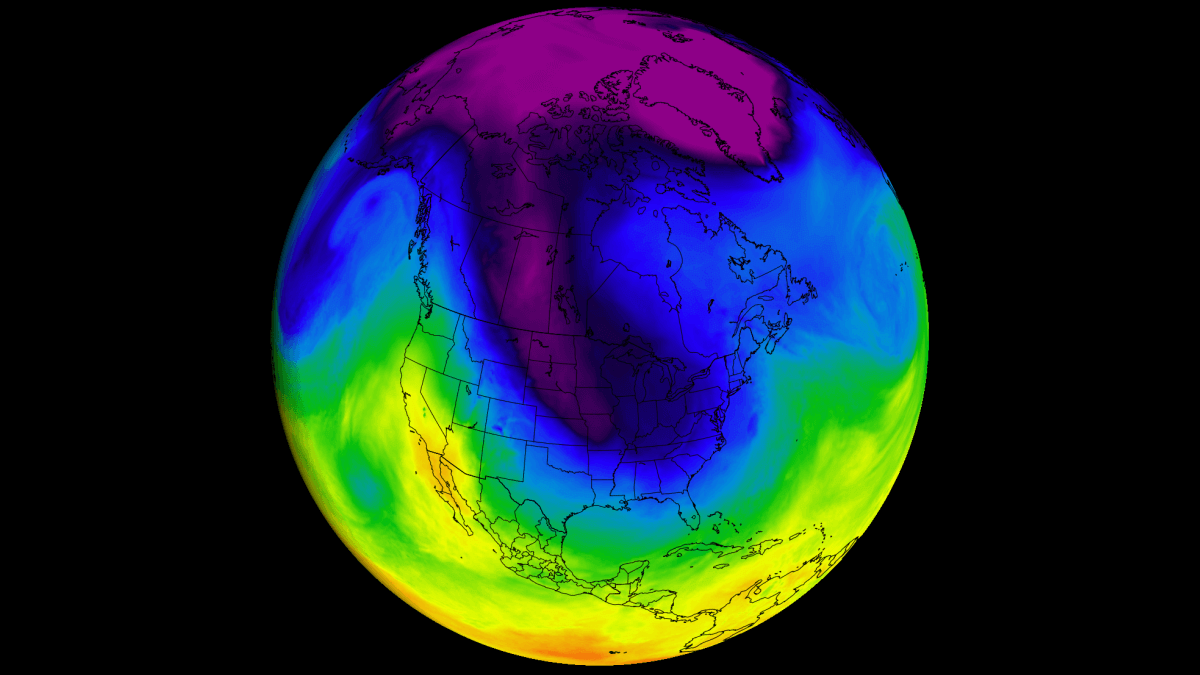
Winter 2025/2026 has been very dynamic in North America so far. Currently, there is a high-pressure ridge building that will spread warmer air for the holidays across the United States. But latest forecasts now show a significant reversal and the return of cold air by the end of the year and in early 2026, with Polar air spreading across the United States and Canada.
A low-pressure area is forecast to drop into the eastern United States, amplified by the Polar Vortex in the Stratosphere.
We will first look at the latest weather patterns and the unusual anomaly over the United States. Then you will see how Winter is forecast to return to the eastern half of the United States and southern Canada, with weather forecasts now trending colder into 2026.
ATMOSPHERIC WAVES
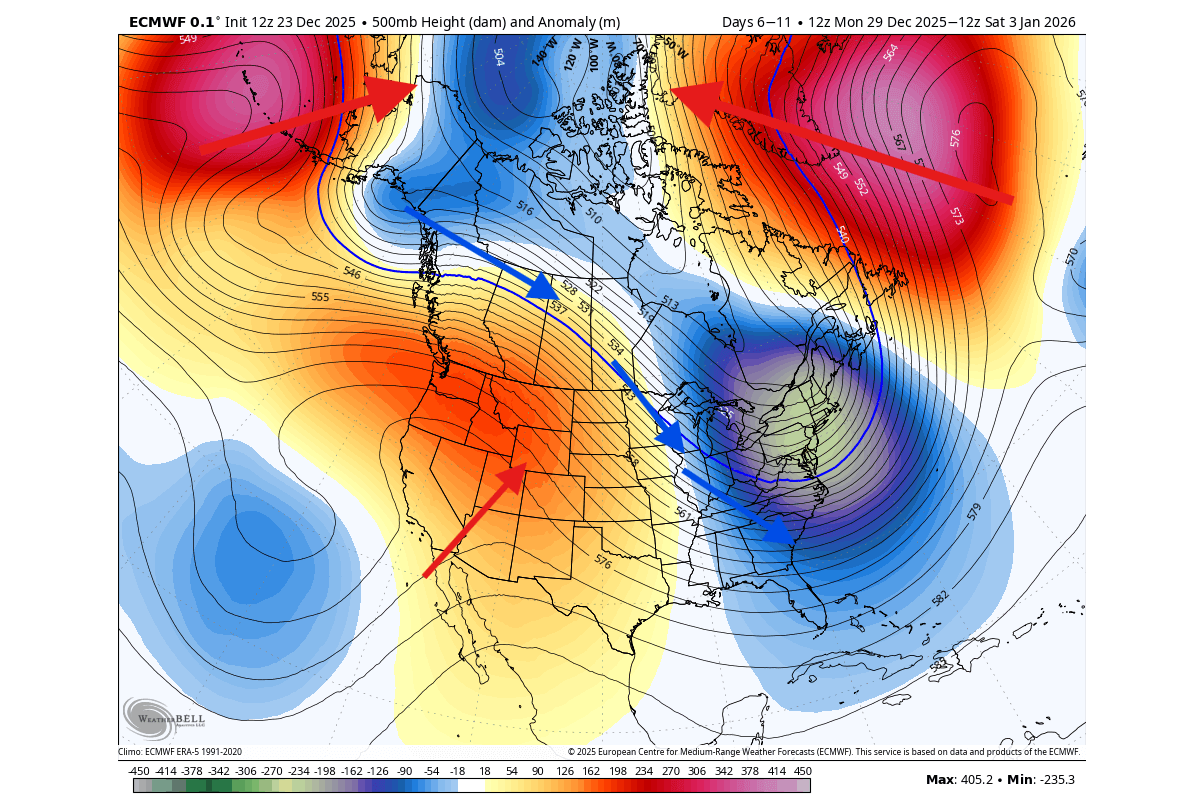
The current weather pattern across the North Pacific and North America is very interesting. In the image below, you can see the pressure anomalies for the next 5 days, which appear in a wave-like pattern of highs and lows. Such pressure waves are an attempt of the atmosphere to balance out the temperature difference between the cold poles and the warm tropics.
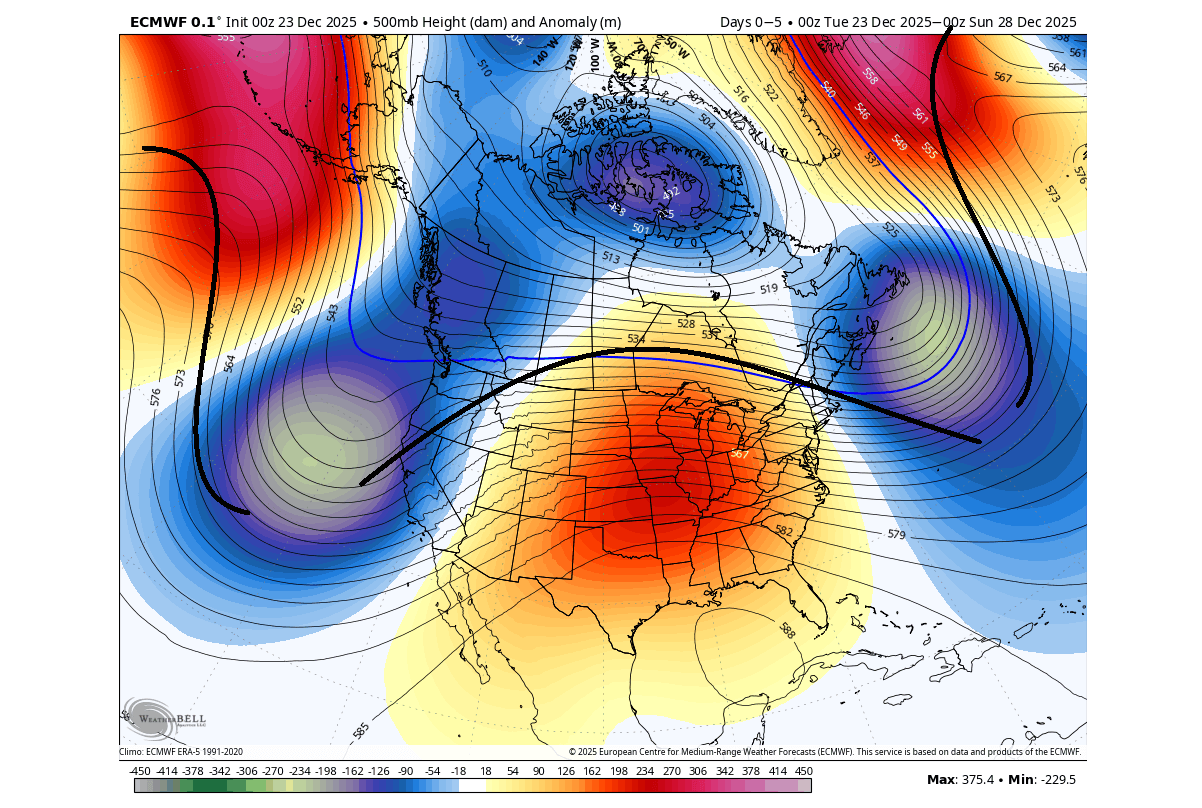
When you see pressure systems in such strong pairs, it can usually mean strong temperature and precipitation anomalies at the surface. The important feature in this forecast is the strong high-pressure area over the United States.
These pairs of pressure systems are also known as Rossby Waves. You can see an example of Rossby waves in the image below from NOAA. As shown, the current pattern above is quite a textbook example of a Rossby wave train from the Pacific into North America.

The violet line connecting these pressure systems is the jet stream. It drives and interacts with the pressure systems, helping to directly influence/shape our daily weather. That is why any changes in the jet stream are very important to monitor.
The term jet stream is behind extreme events, from cold spells and flooding to heatwaves and droughts. It is a fast, narrow current of air flowing from west to east that surrounds the globe. In the image below, you can see an example of the global jet stream in a NOAA analysis.
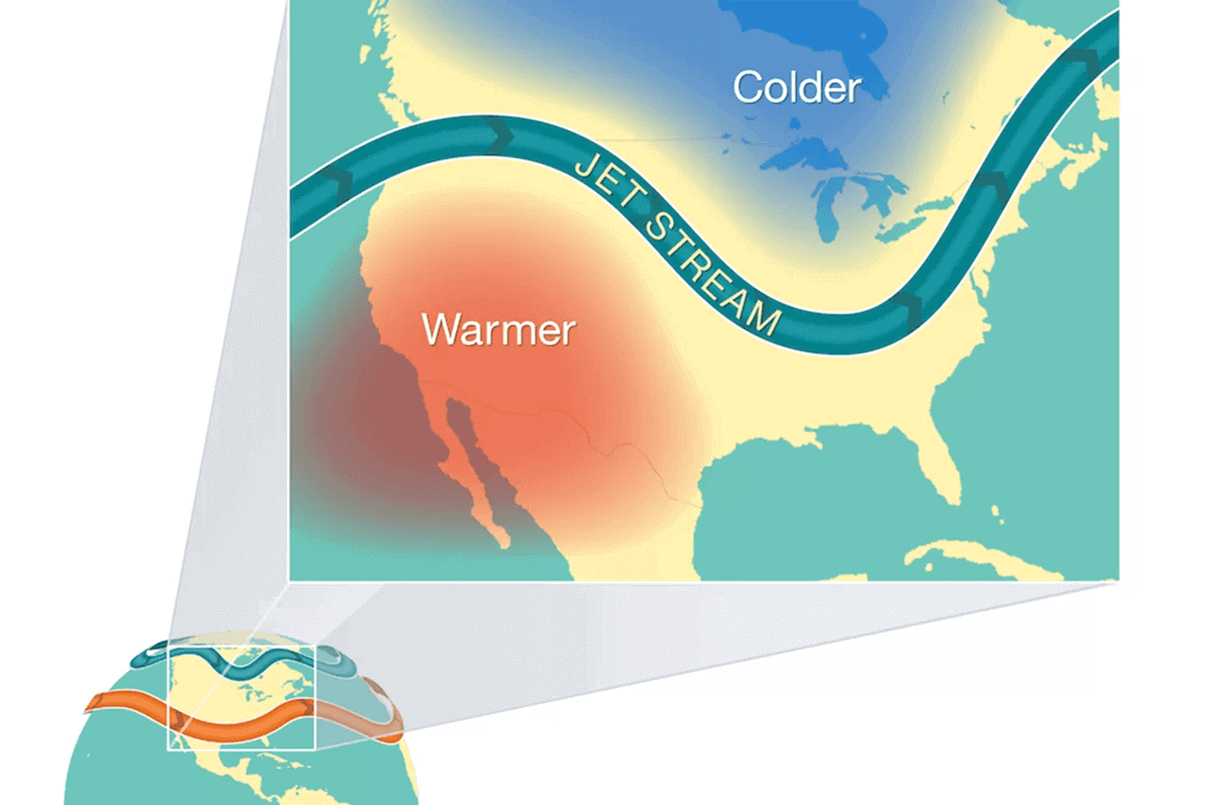
This is nicely seen in the temperature forecast across the Pacific and North America for the next 5 days. Just like with Rossby waves, you can also see the temperature anomalies appearing in waves as a result. A strong warm anomaly will persist for the next few days, driven by a high-pressure system and a rise in the jet stream.
These temperature patterns correspond directly to the location of pressure systems and the jet stream that connects them. The coldest air is usually found when the jet stream is wavy, and these pressure waves are strong, and the low-pressure area of the wave is directly over the United States.
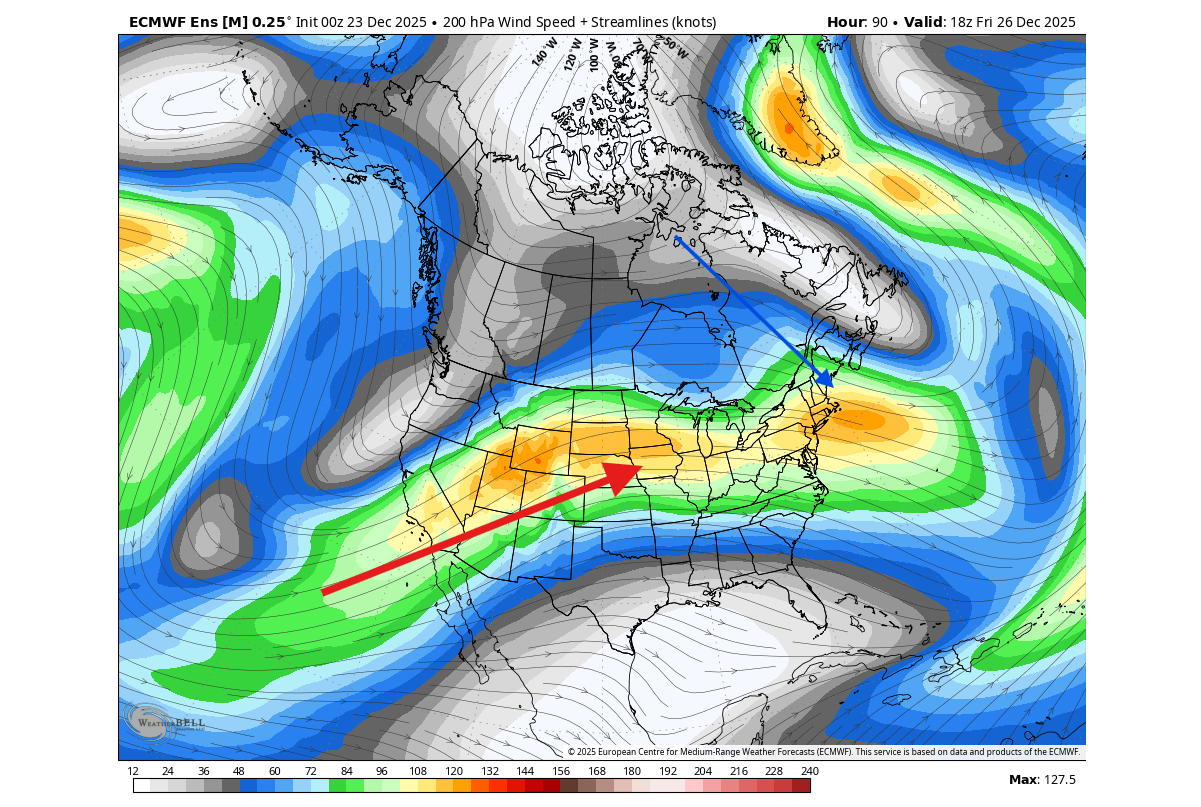
Below is the latest jet stream forecast for Friday. You can see a strong southwesterly jet stream, rising to the north. This indicates a high-pressure zone, and warmer temperatures over the Holidays across the United States, except the Northeast, where a northerly flow is present
The motion of the jet stream is shown in the high-resolution video animation below, where you can see its true flow and movement across North America. It was developed by the NASA/Goddard Space Flight Center Scientific Visualization Studio.
Of course, there is a reason why we are looking at the current pattern and learning about pressure waves and the jet stream.
By the end of the year and into 2026, the atmospheric pressure waves will shift, clipping a core of the Polar Vortex and sending it into the eastern United States with a strong northerly jet stream. This can unlock the Arctic floodgates into southern Canada and the United States.
A WINTER RETURN
During winter, the pressure systems tend to be stronger, especially lows. Because a lot of energy is involved, the weather systems are constantly in motion and interacting with one another. This can create pattern changes on a larger scale, one like we are about to see unfold in the next two weeks.
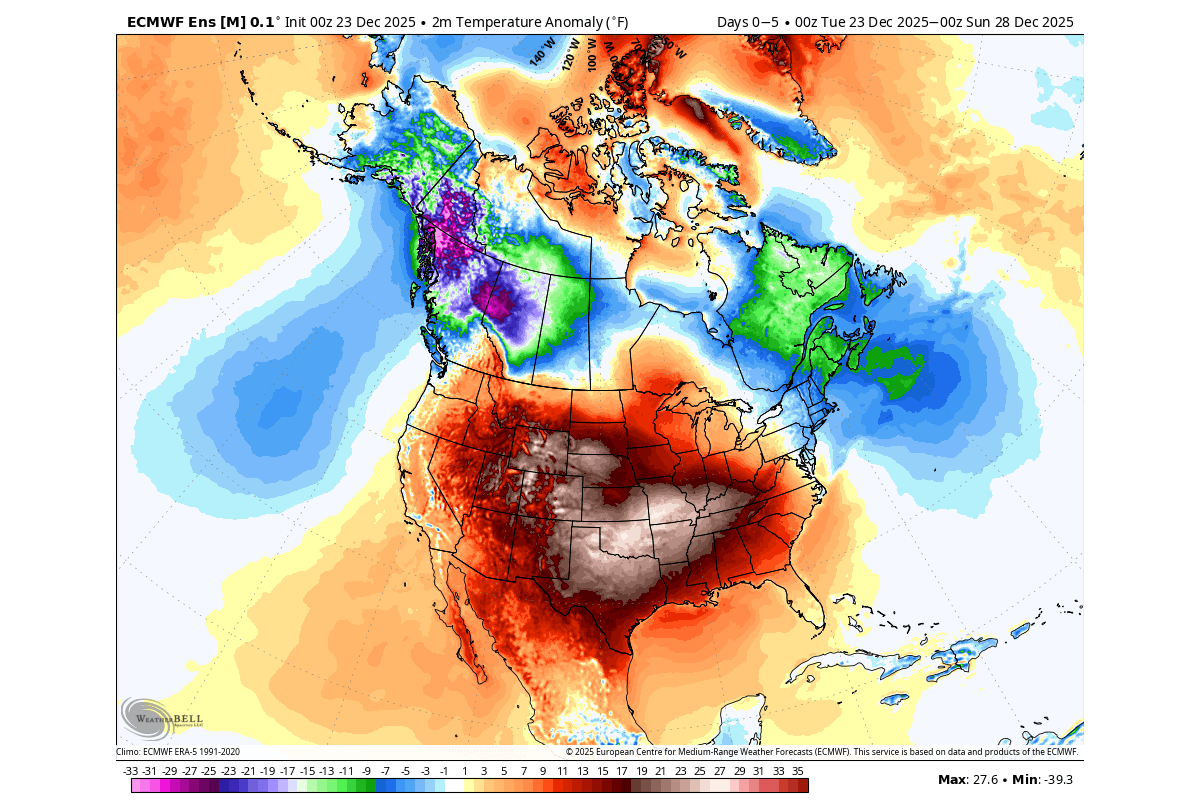
Looking at the ensemble forecast, we can see changes in the weather patterns starting early next week. In the image below, you can see the North Pacific high-pressure area pulling up to the north, and the blocking over Greenland.
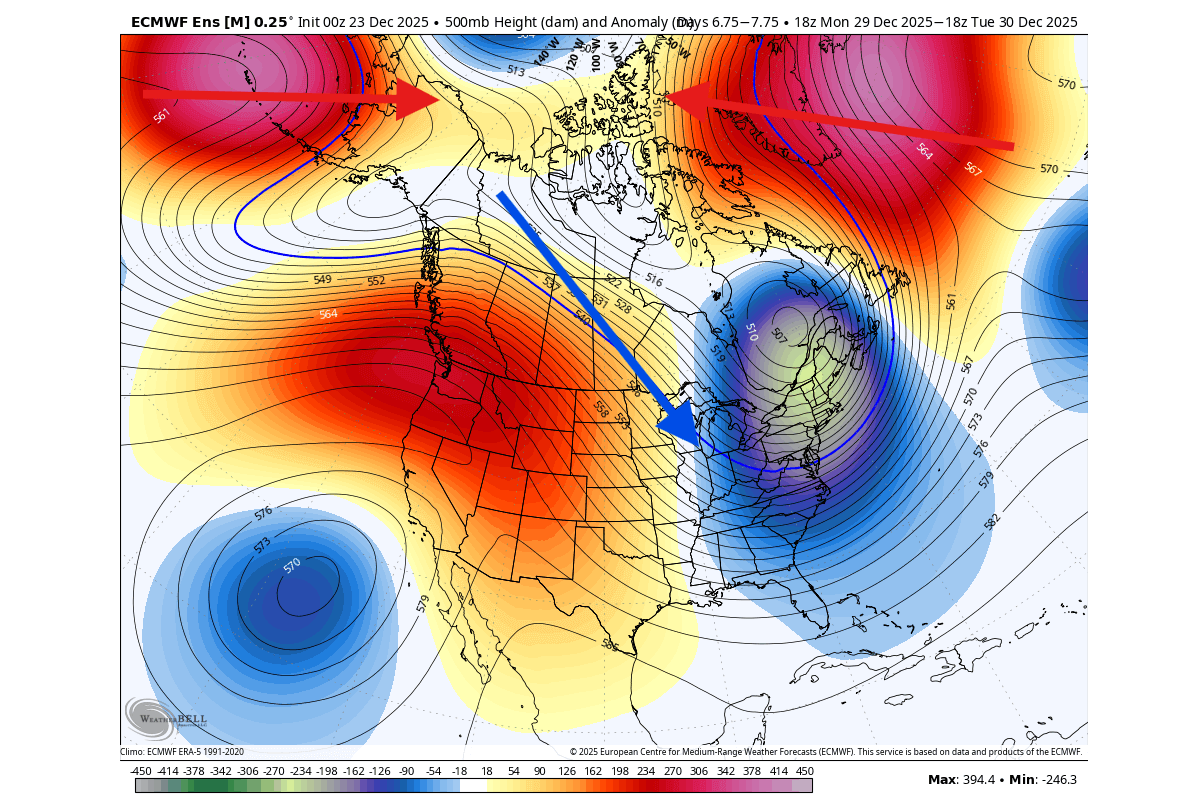
That squeezes a low-pressure area into the eastern United States and eastern Canada. It is still just waves of pressure anomalies, like we showed you in the beginning, interacting with each other, but now in a different order, with different weather outcomes.
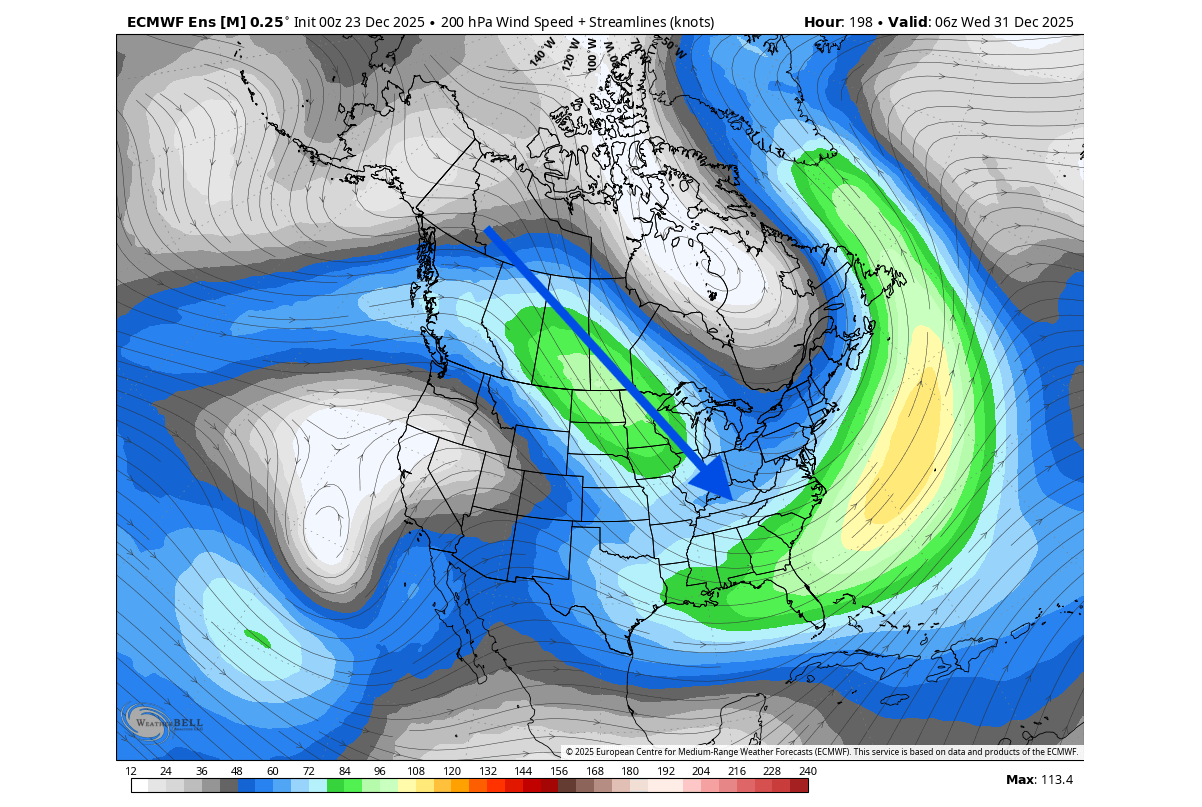
Below is the jet stream forecast for mid-next week, and you can see a very different path now, with a clear northerly polar jet stream. This enables a transport of colder air again, creating a break in the warm pattern over the northern and eastern United States.
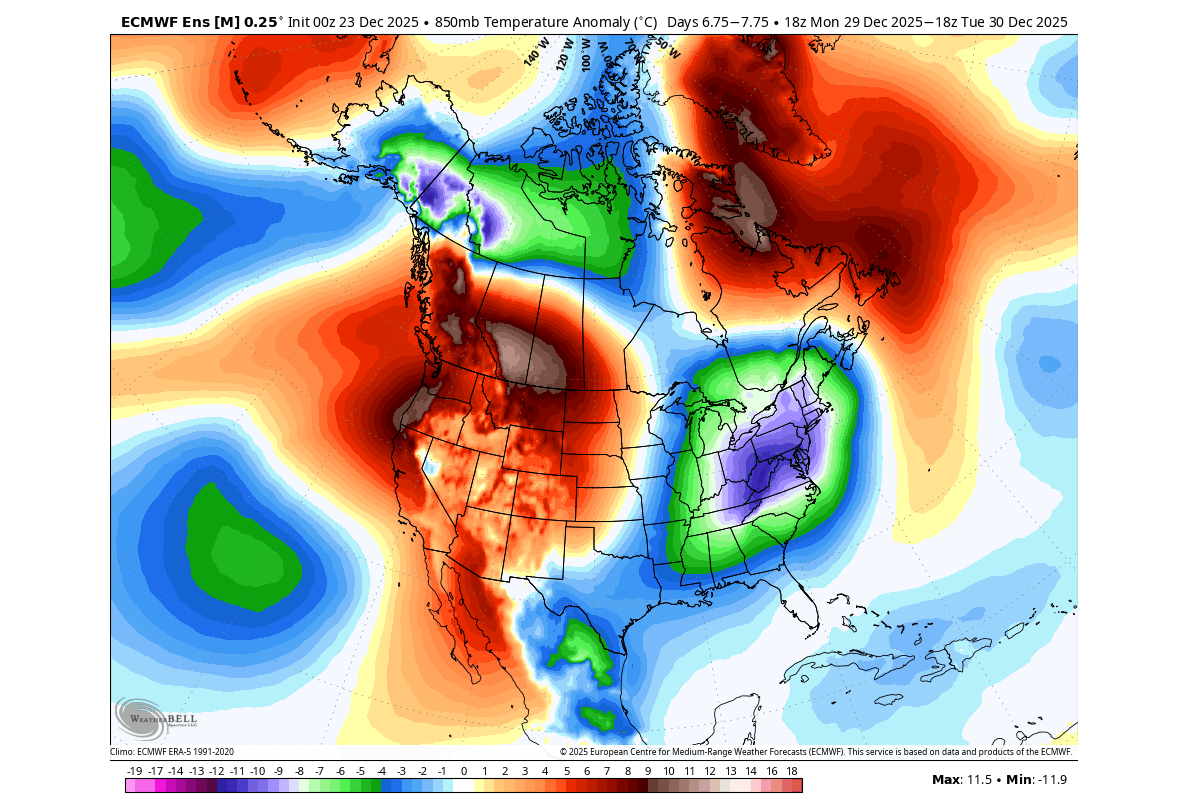
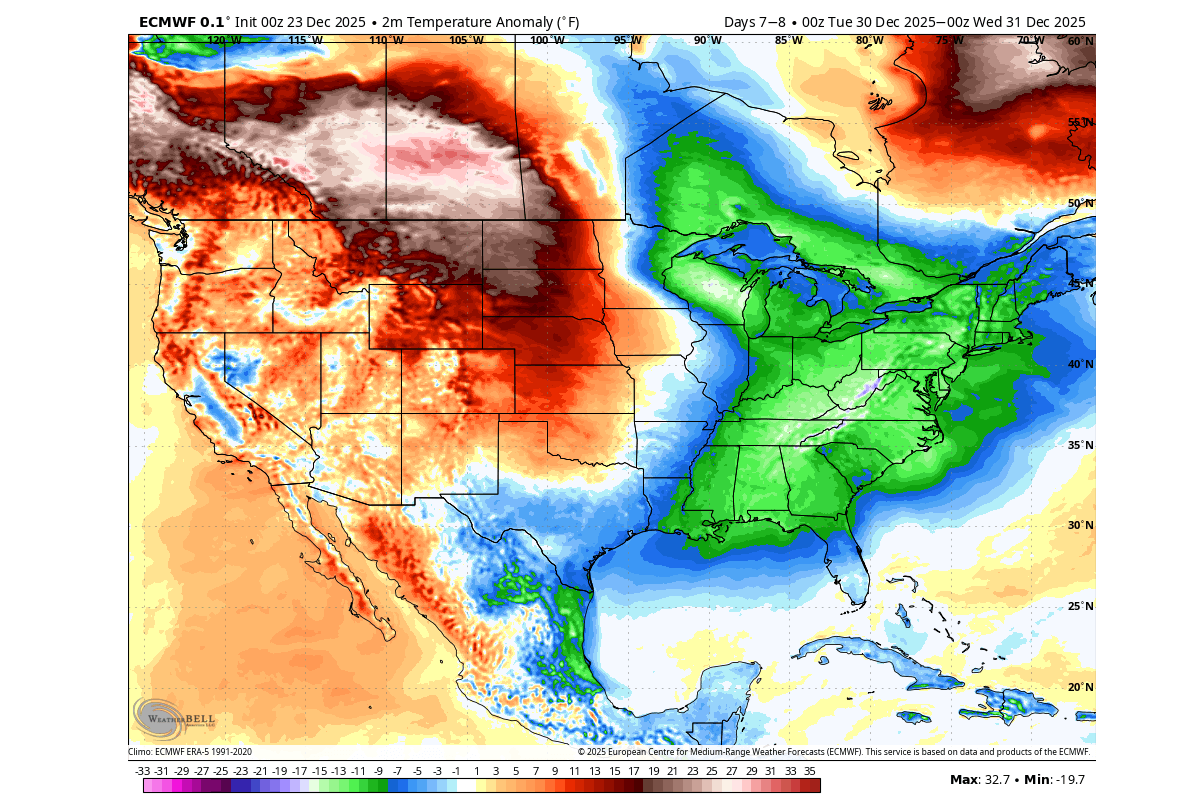
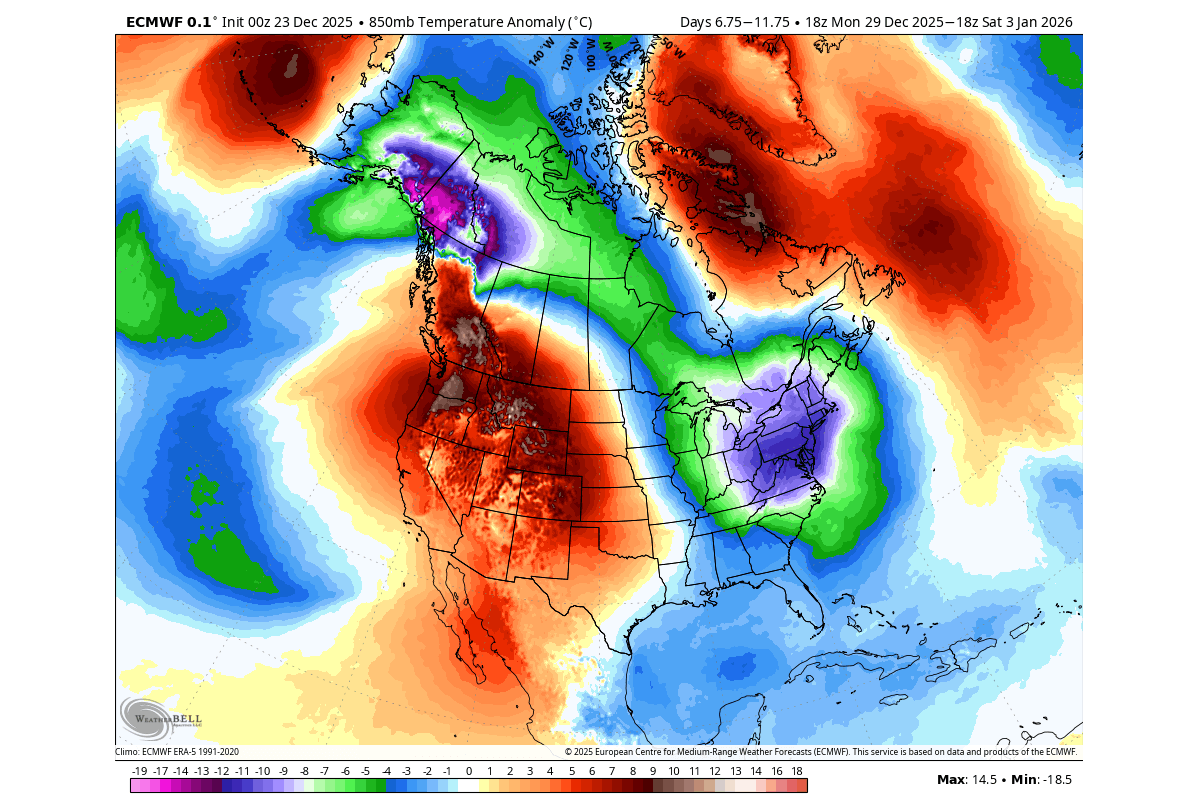
This is revealed in the airmass temperature forecast below for the same period at the 850mb (1500m/5000ft). The reason we look at this altitude first is that we get to see the airmass movement and condition. You can see a cold air anomaly returning over the eastern United States. The source of this cold air is from the northwest, and you can still see the connection to the Polar regions.
Below is the surface temperature forecast for the same period, which shows the first wave of cold air returning to the Midwest, the Northeast, and the eastern and southeastern United States. But just as pressure systems work in waves, you can also see a warm anomaly rising towards the north in the northern U.S. and southwestern Canada.
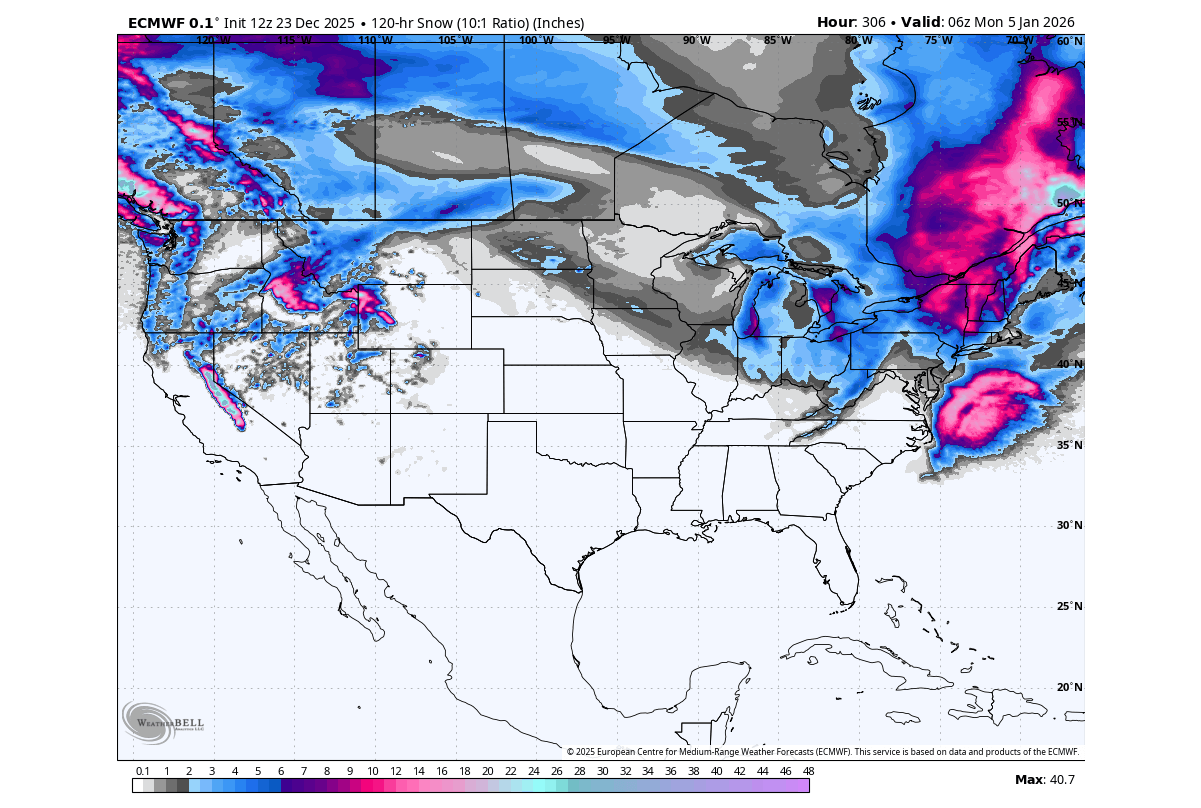
Of course, cold air should also bring along a lot of snowfall, or so we tend to assume. The snowfall forecast for the end of the year shows most of the snowfall to be in southern Canada, but also reaching into the western elevations of the U.S., the upper Midwest, the Great Lakes, and the Northeast.
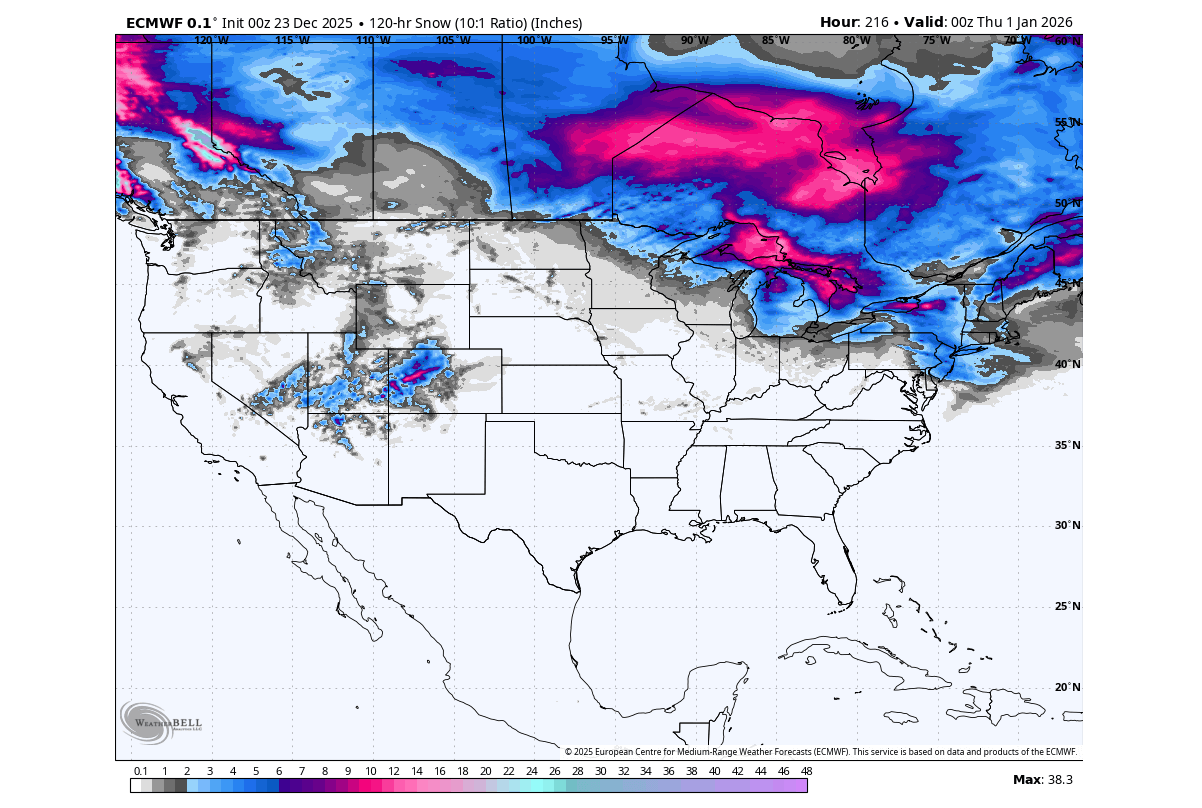
Snowfall also needs moisture, which is often low in drier northern air. This is a side effect of the way the cold air comes down, but the moisture can be found from other sources, depending on the exact pressure system position.
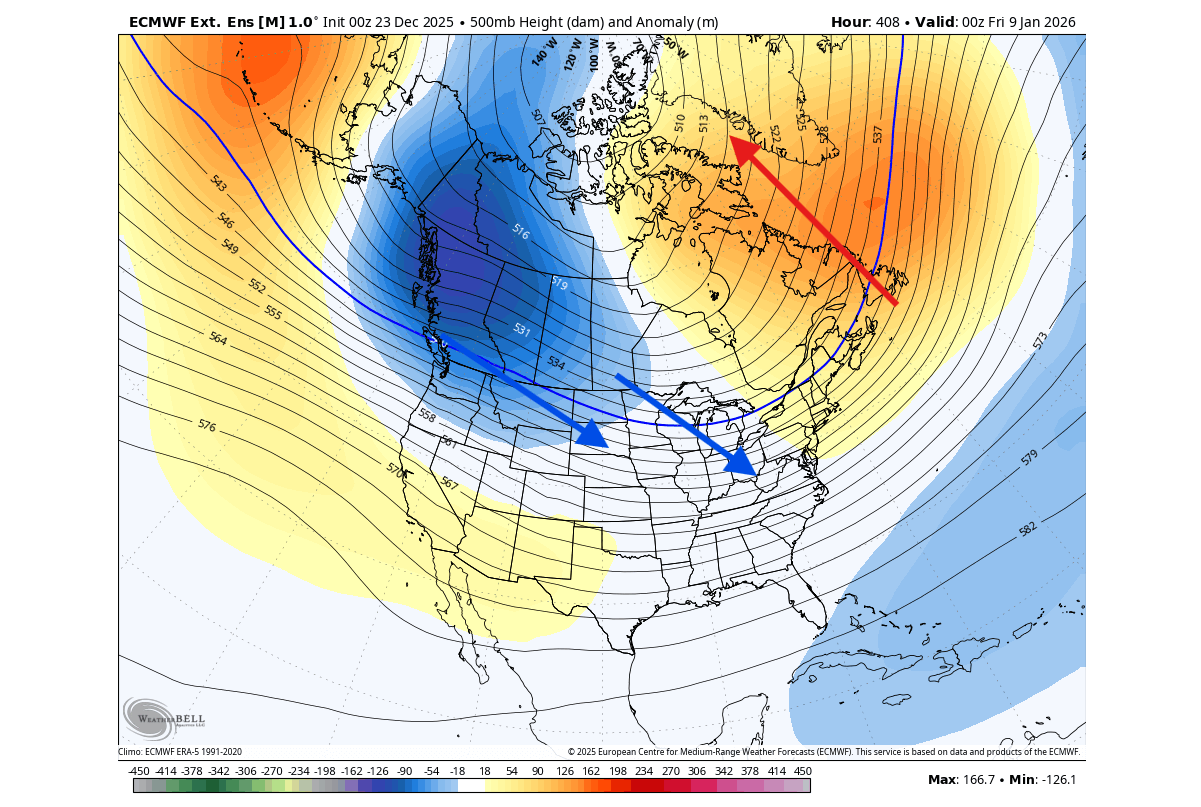
But there is one more important “side effect” to the movement of the high-pressure systems. Below is the pressure/temperature forecast for the lower stratosphere at the 50mb level (20km/12.4miles). You can see the “pinching” caused by the two high-pressure systems at lower levels, with impacts observed here in the stratosphere.
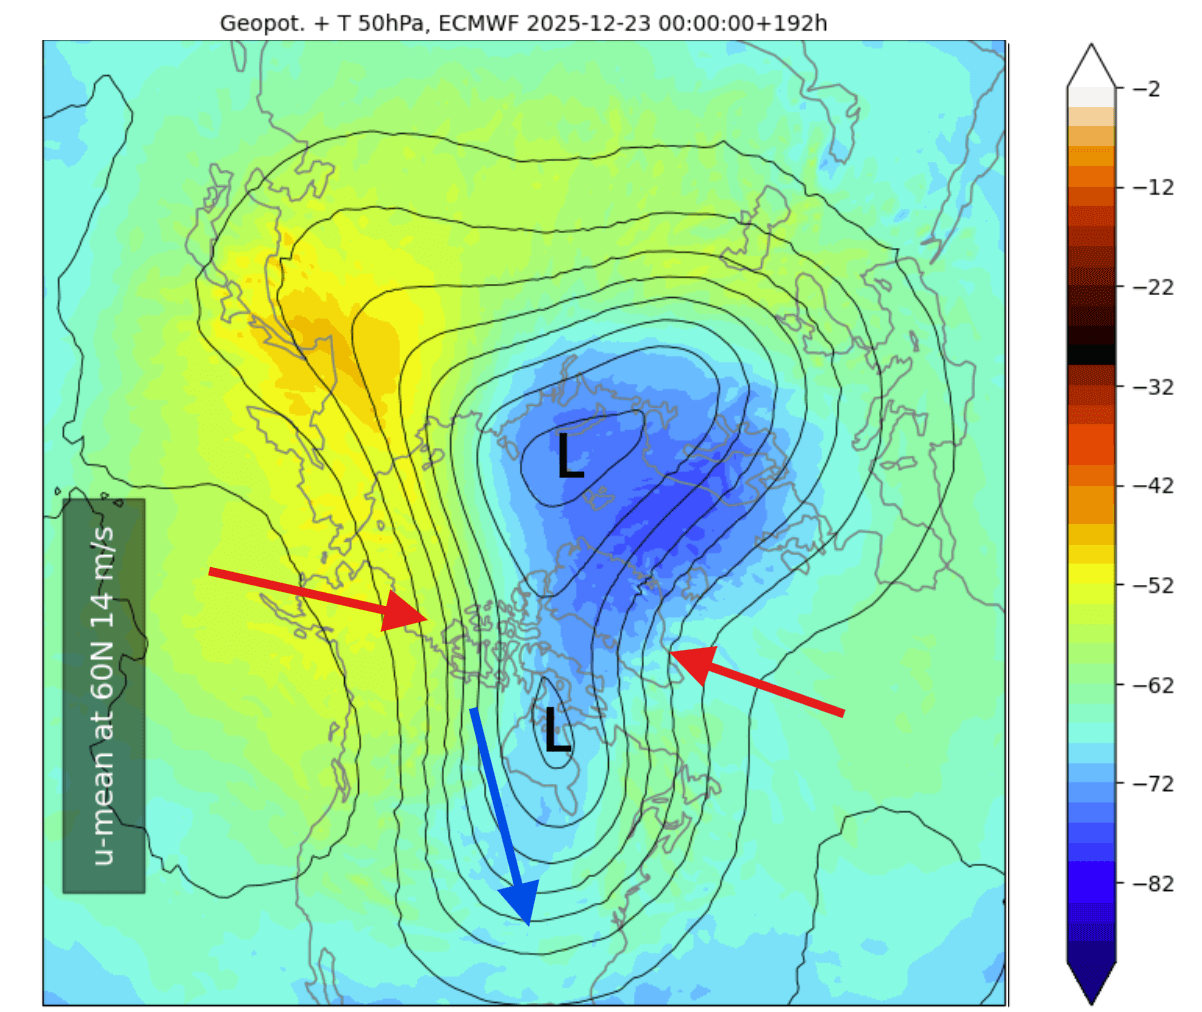
This will push a core of the Polar Vortex back into North America, allowing the northerly jet stream to strengthen in the early days of 2026. The boosted jet stream supports stronger cold waves, as the source region of the air sits deeper in the Polar circle.
A TRUE POLAR VORTEX CORE
The image below again shows the lower stratosphere at the 50mb level (20km/12.4miles), but now the pressure anomaly for the start of 2026. You can see the detached inner core of the Polar Vortex, pushed out of the polar regions into North America, along with a strong northerly jet stream.
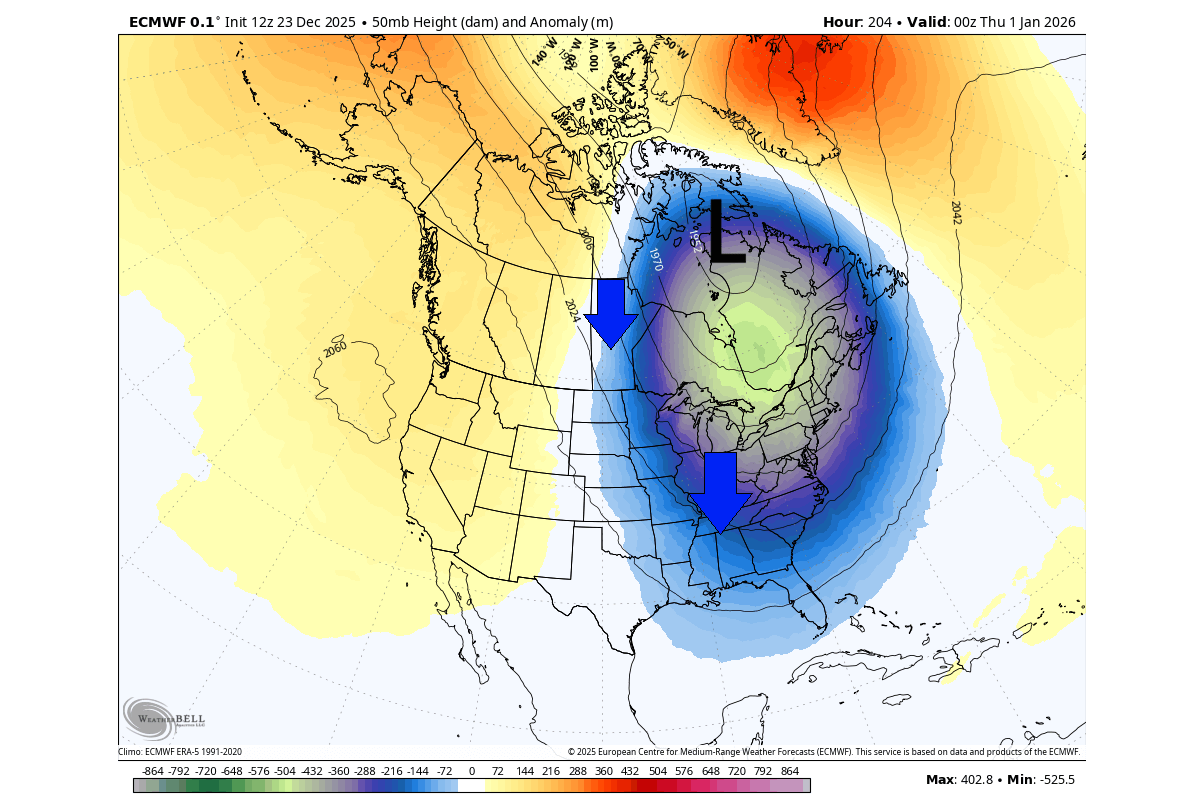
These Polar Vortex cores are notorious when they arrive in North America, as they usually also come with some of the coldest air around.
Below is the pressure anomaly around the same period, and you can see the low-pressure core over the eastern United States and southeastern Canada. Low-pressure systems spin counter-clockwise, so that means a stronger northerly flow, pulling cold air from the Arctic.
You can also see a high-pressure ridge bringing a warmer airmass over the western United States and southwestern Canada.
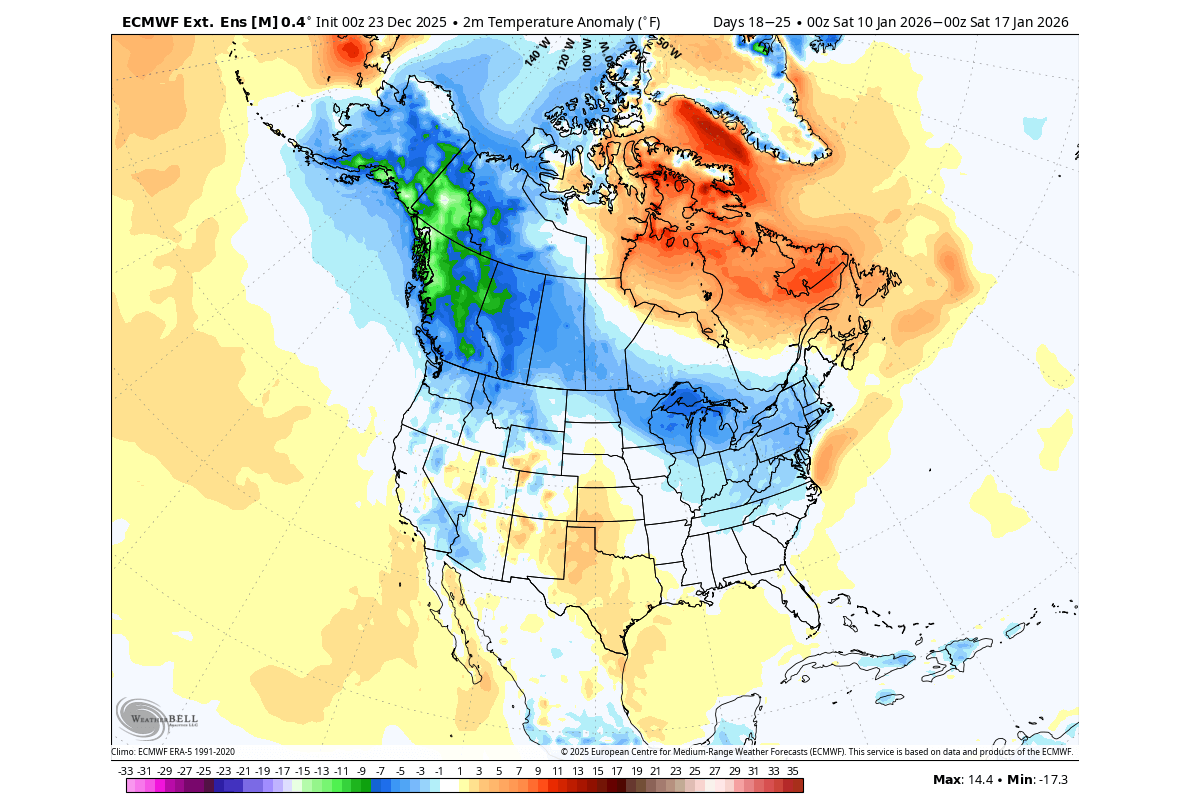
Let’s talk temperatures. Below is the 5-day airmass temperature anomaly forecast for the start of 2026. You can very clearly see the strong cold air “blob” that arrived with the Polar Vortex core into the eastern United States, with a visible source region back to the northwest.
But at the surface, the forecast is even stronger. Below is just a single-run forecast from the ECMWF, on January 2nd. It reveals the full extent of the cold air anomaly, with temperatures significantly below normal for early January. We see impacts from southeastern Canada over the whole eastern United States, and down to the south coast.
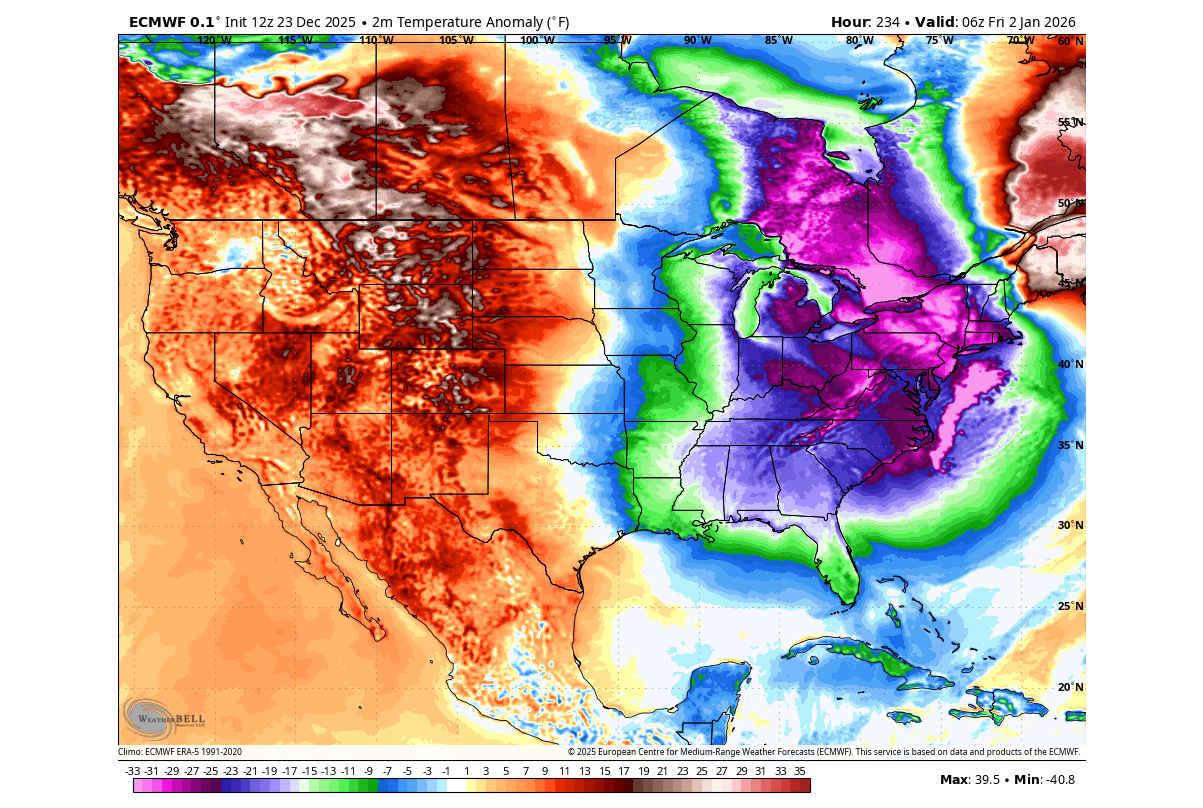
An event of this scale can bring deep negative temperatures into the upper Midwest, with negative temperatures also around the Great Lakes and the Northeast. This can also bring single digits to the low 10s deep across the Midwest and in the east, with freezing temperatures reaching the southeast and northern Florida.
This individual forecast serves as a very good example of what this pattern overall is capable of. We will, of course, monitor the developing situation closely.
We can also look at some of the latest snowfall forecasts during such an event. Due to the lead time being well over 10 days, there are a lot of unknown details that we need for snowfall. But the forecast example shows snowfall over the Midwest, the Northeast, and also over the eastern coastal areas.
Overall, we are looking at a significant atmospheric event preparing for the end of the year and in the first days of 2026. But what are the trends for the rest of January?
COLD CONTINUES IN JANUARY
Going a few days ahead into the second week of January, the pressure pattern still looks favourable to allow cold air transport into the United States. A low-pressure anomaly is indicated from western Canada into the northern United States.
The temperature forecast below, for the same period, shows cold anomalies across western Canada, which is the main source region, charged by the Polar air. This cold air is forecast to also cover the northern United States, the Midwest, and the eastern United States.
At this point, we have to be clear: we are looking at extended range ensemble forecasts. This means that what we observe are forecast trends, which show a clear cold air support over parts of the United States and Canada. It’s a very good start at this range, and has reverted from previous warm trends for January.
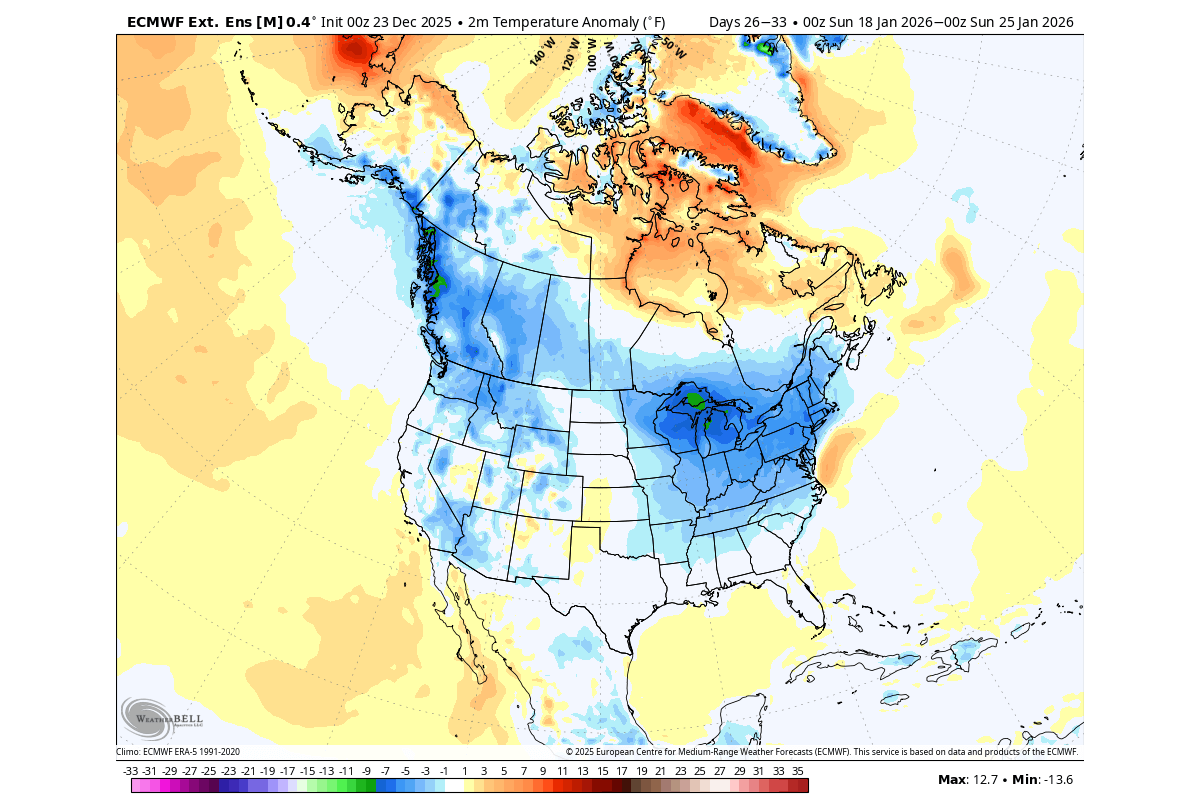
The second half of January shows continued high-latitude blocking, with high-pressure anomalies inside the Polar circle. This allows for a low-pressure area to remain over Canada, supporting a more northerly jet stream, which enables colder air transport into the United States.
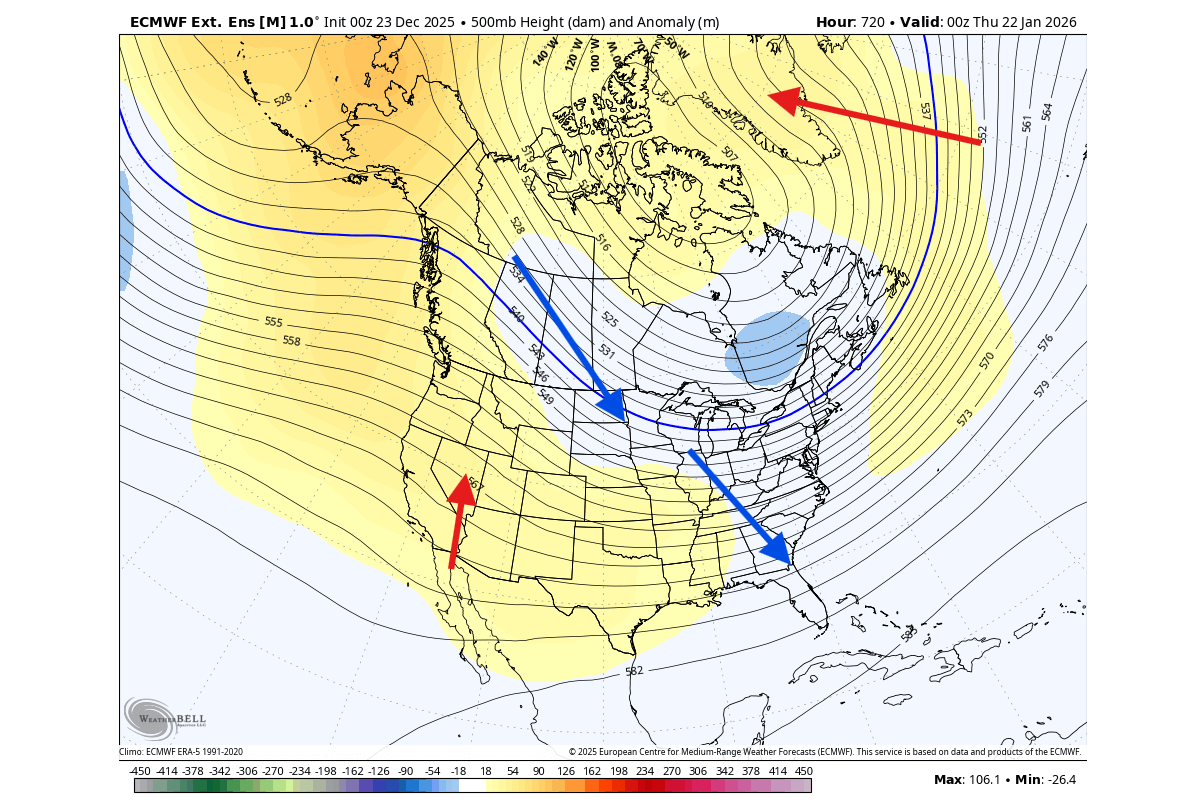
And that is exactly what the temperature forecast trend shows for the second half of January, with continued cold air anomaly over Canada, expanding into the northern and eastern parts of the United States. In total, this gives confidence for some wintery weather in January.
We will keep you updated on the global weather pattern development, so don’t forget to bookmark our page. Also, if you have seen this article in the Google App (Discover) feed, click the like button (♥) there to see more of our forecasts and our latest articles on weather and nature in general.
The main forecast images in this article are from WeatherBell, using a commercial forecaster license.
Don’t miss:
El Niño Watch: Latest Forecasts Show El Niño Returning in 2026