The Arctic Sea Ice melt season is in full swing, and we are currently at historically low levels for this time of year. The weather forecasts indicate that the trend could continue with sea ice extent reaching its lowest point on record in September, raising the likelihood of an impact on Winter 2025/2026 over the United States, Canada, and Europe.
Arctic sea ice plays a significant role in the global weather system, especially in influencing the winter weather patterns over the Northern Hemisphere.
We will first look at the latest sea ice conditions in high resolution and how the current melt record low compares to previous years. We are also going to look at the weather pattern forecast and the expected melt, and of course, how a record low ice extent can impact Winter 2025/2026.
ARCTIC SEA ICE MELT SEASON
The Arctic region is a large ocean, and it has no large-scale landmass. It is the smallest and shallowest of the world’s oceans, and it is also the coldest.
In the image below, you see the Arctic Ocean as it would look without water, revealing a very complex underwater terrain. You can see the main regions of the Arctic Ocean, and on the right, you can see the usual surface currents of the ocean and the sea ice. Image from a recent study.

The Arctic sea ice has its own seasonal cycle, and you can see it in the image below from NSIDC. It shows the change in sea ice extent over a single year. The melt season usually starts in late March and lasts well into September. There, it reaches a grand minimum before starting to re-freeze in October.

On the graph, you can see lines for the past 46 years. The dashed red line is the year 2012, which still holds the record for the lowest ice extent since satellite measurements began.
The seasonal sea ice melt cycle is driven by seasonal temperature changes. As the days start to get longer and the Sun’s influence over the Polar regions becomes strong enough, temperatures rise, and the melting process begins on the outer edges of the ice sheet.
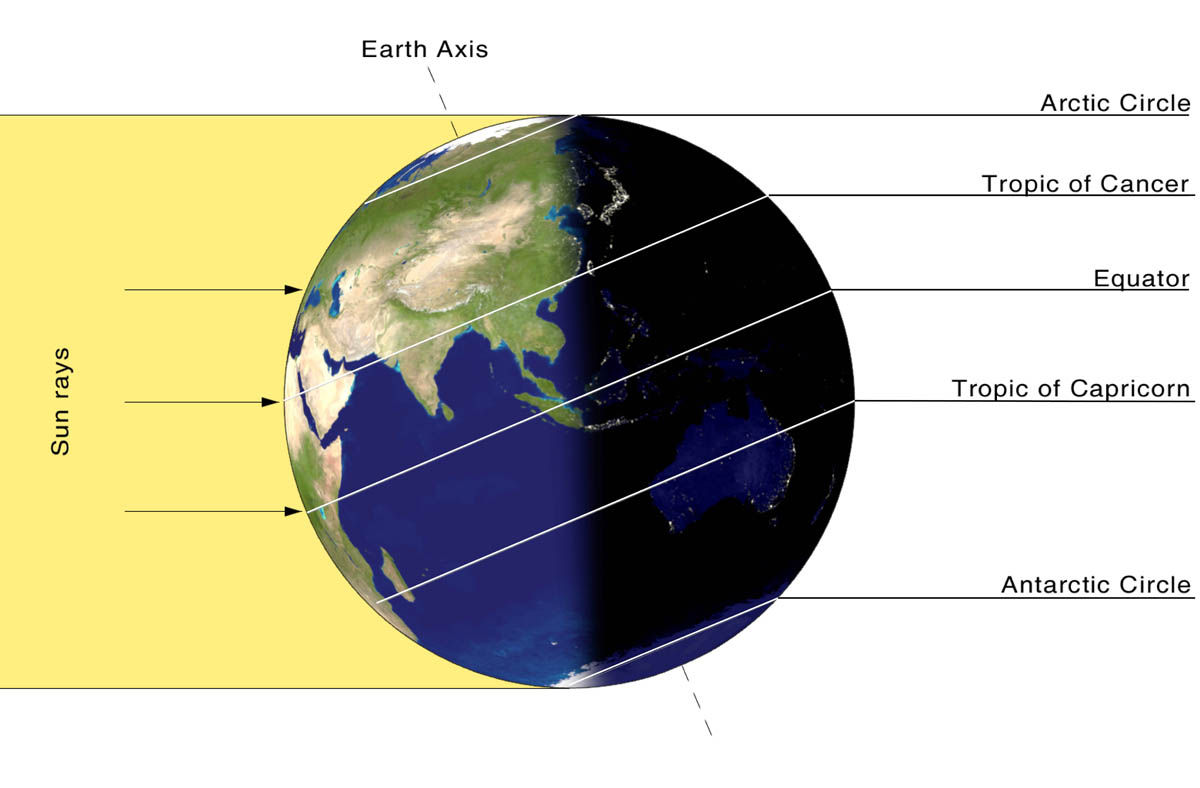
During Summer, there is 24/7 sunlight over the Polar regions. This means a near-constant sea ice melt process. The image below shows the tilt of the Earth’s axis and the angle of the incoming sunlight during a Northern Hemisphere Summer Solstice.
We produced a high-resolution video, which shows the 2025 sea ice melt season since April. You can see the constant strong movement of the icecap, influenced by the ocean currents, and also strong weather and wind dynamics.
This brings us to the latest conditions and the current record low sea ice extent for this time of year.
LATEST CONDITIONS AND THE RECORD LOW
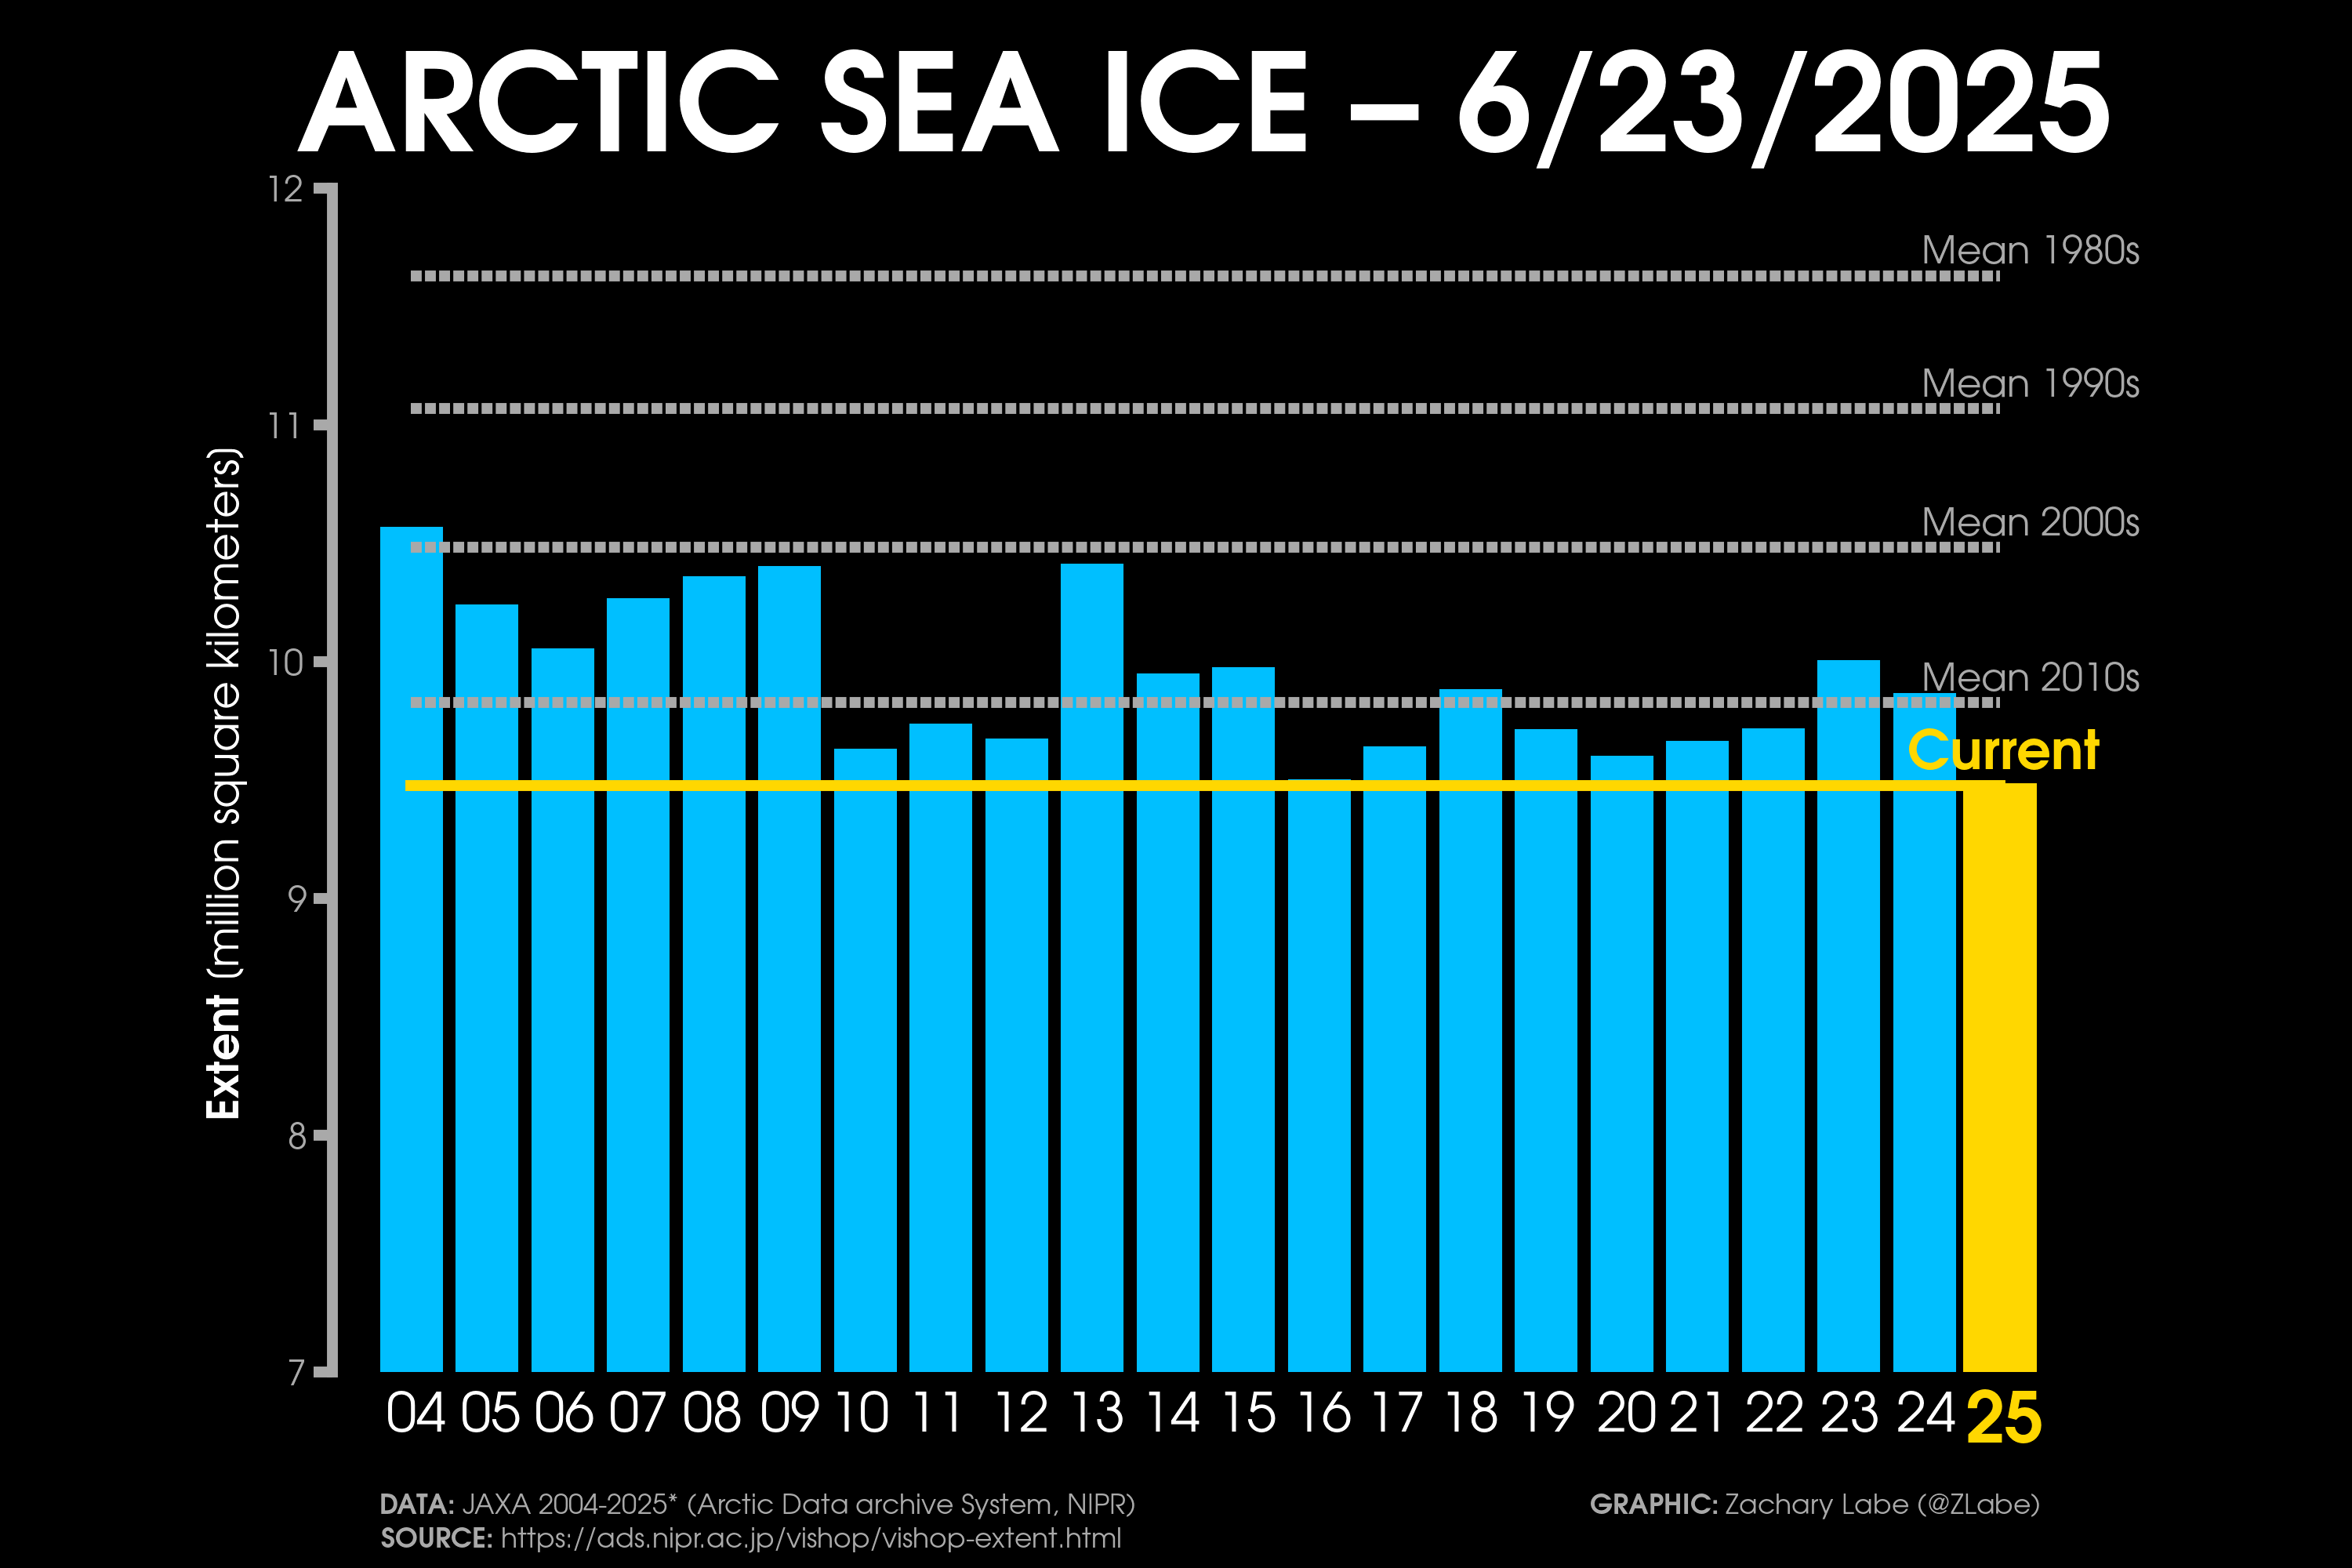
The graph below from NSIDC shows the latest total Arctic sea ice extent, which is running below the long-term average. The dashed line represents the 2012 melt season, which ended with a record-low sea ice extent in September. You can see that the 2025 season is currently at the record low extent for this time of year.

If we compare the current state to last year (green line), you can see a big difference compared to 2024. The sea ice extent is around 0.6 million square kilometers lower than this time last year. It is also around 0.1 million square kilometers lower than 2010, which was the previous low for this time of year.

We can look at the great analysis image by scientist Zachary Labe, Ph.D., which shows the total ice extent compared to the past decades, showing 2025 as the lowest of the years at the current time of year.
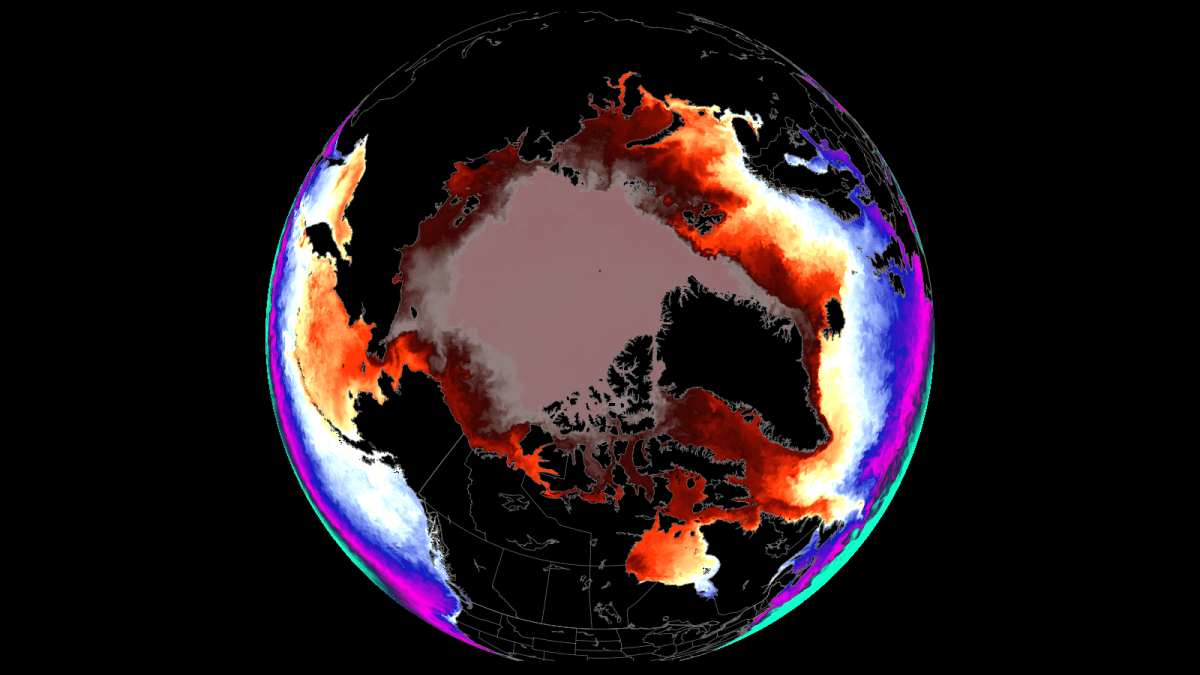
But Arctic sea ice is much more than just extent and area. Below you can see our own graphic, which shows the sea ice concentration. This tells us what is the fraction of the sea ice in the ocean. We can see the strongest concentration is in the central regions. It is reducing towards the edges, where it meets the seasonally warmer air further out of the pole.

You can see the melt process in the image below, which shows the forecast change in sea ice concentration over the next 10 days. It is clearly visible how the outer edges of the icecap will experience full melt and sea ice disappearance.

Another important parameter of the Arctic sea ice is, of course, its thickness. It reveals where the icecap is thicker, and where it is thinner and thus much more prone to melting. The thickness change forecast below shows substantial thinning of the western icecap and over northern Canada.

With the area and thickness known, we can calculate the total volume of the icecap. Below is the sea ice volume graph, and it shows that the 2025 melt season is so far running much lower than the past years. The peak volume at the peak has not even reached 20000 cubic kilometers (4800 cu. miles).

This is not a healthy ice cap, and under certain weather patterns, it may not be able to withstand rapid melting and could reach a new record low in September.
WEATHER PATTERNS OF THE NORTH
The weather pattern in June so far has featured a broad low-pressure area spanning from the northern United States over Canada and into the North Atlantic. While this seems like a good pattern for sea ice, with a lack of high-pressure over the pole, it actually brings southerly winds/currents into the Arctic.

The surface temperature anomaly analysis for the month so far shows the warmer-than-normal temperatures over the Arctic Ocean. While the warm anomalies are not that high, the supportive air currents have enabled a faster sea ice melt over the majority of the month.

Looking ahead into the ECMWF forecast for July, we can see a high-pressure area building over the polar regions. There are two low-pressure areas, one over northern Canada and Greenland, and one over Siberia. This creates a special flow pattern over and around the Arctic circle.

The arrows indicate the expected flow, with a warmer airmass being pushed into the polar circle over the eastern Arctic, and the colder air transported out into Canada. This is overall a favorable pattern for increased sea ice melt.
There are warm anomalies forecast in the image below across the southern and eastern parts of the polar circle, as we highlighted in the pattern. But if you look at the western parts, you can see a cold anomaly in the land areas around the Arctic Ocean.

While you can see broad colder anomalies over the western parts of the polar circle, those temperatures are in most areas still not far enough below the melting point. And with the air/ocean currents being supportive for faster melting, we can still see a rapid decline in sea ice extent despite a few degrees of anomaly.
This raises questions about the potential for 2025 to achieve a new record low minimum sea ice extent in September. That would certainly have an impact on the weather patterns over the Northern Hemisphere, particularly for Winter 2025/2026.
WINTER 2025/2026 AFTER LOW SEA ICE
The peak of the sea ice melt season is during September, when the lowest extent is reached. For this reason, we tend to look at the August-October period in the forecasts to have the best idea of how the whole minimum season can evolve. We have seen the July forecast above, so we will look at the current long-range predictions.
Below is the long-range temperature forecast from ECMWF for the August-October period. It shows substantially above-normal temperatures across the polar regions, apart from the far western edge. This would support a strong melting season, bringing the sea ice close to (or further) record low extent numbers.

The pressure pattern forecast also reveals why the current predictions support an increased melt season. You can see a low-pressure area indicated over Greenland, with a high-pressure anomaly over the pole. This enables a southerly flow into the polar circle from multiple areas, accelerating the sea ice melt.

But how does this period “connect” with the Winter weather patterns? Below is a simple correlation between the August-October sea ice extent and the following winter pressure anomalies. As you can see, winters following a low sea ice extent have a higher tendency for lower pressure over the United States, Canada, and Europe.

This is, of course, just a simple linear correlation, but it can indicate a potential signal and connection between two variables. And here we see lower sea ice extent raising the potential for a blocked pressure pattern, and a jet stream breakdown. That enables a northerly flow into the United States, Canada, and Europe.
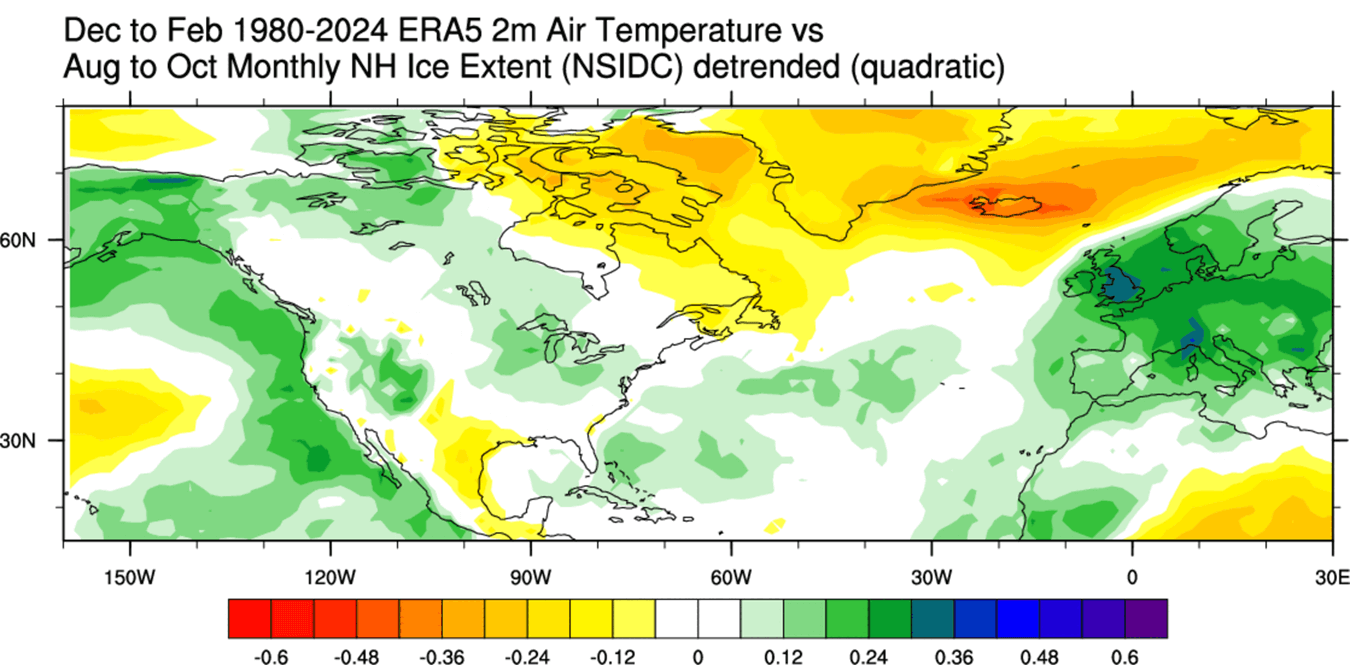
The image below also shows a connection with low sea ice, but for temperature instead of pressure. You can see that the potential for a colder winter is increased over the United States, Canada, and Europe, following a low sea ice extent in the August-October period.
But where does the connection lie for the low sea ice season to help produce a colder winter over the United States, Canada, and Europe? One key element in that connection is likely the stratospheric Polar Vortex.
SEA ICE, POLAR VORTEX, AND WINTER
We often talk about the Polar Vortex, and essentially, it is a common word for the large-scale atmospheric circulation during the cold part of the year.
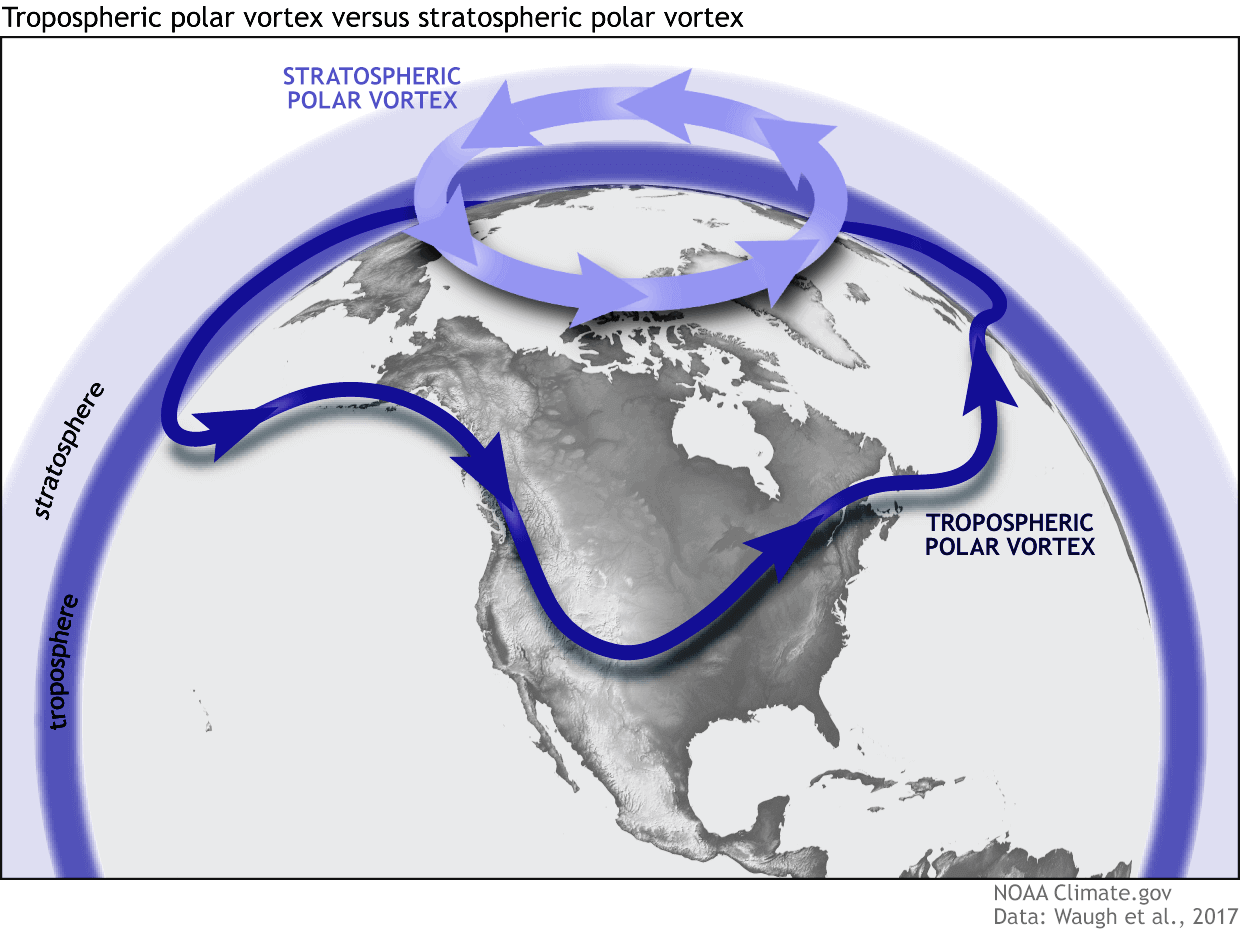
We separate the Polar Vortex into an upper (stratospheric) and a lower (tropospheric) part. Each part plays a different role, so we monitor them separately. However, both parts together form the circulation across the Northern Hemisphere during the colder part of the year (October-March).
Any disturbance of the upper part of the Polar Vortex in the stratosphere can have consequences that extend further down into the lower parts. This can then affect the jet stream and our daily weather patterns.
If we make an analysis of the low sea ice connection with the winter Polar Vortex, you can actually see that in low sea ice years, the Polar Vortex is weaker, and the pressure in the stratosphere is higher. This is one of the “disturbances” that can impact the weather lower down from the Stratosphere.

We can also see the same signal if we look at the temperature connection (correlation). The temperatures in the stratosphere tend to be higher in a weak Polar Vortex. That can often lead to a full-on Stratospheric Warming event (SSW), which can collapse the Polar Vortex, and create a blocking pattern for the United States and Europe that brings along cold air.

So the reason we monitor the overall state of the Polar Vortex is that it can have a profound impact on our daily weather. We mainly separate the Polar Vortex into two different modes:
A strong/stable Polar Vortex usually means strong polar circulation and jet stream. This locks the colder air into the Arctic Circle, creating milder conditions for most of the United States and warmer-than-normal conditions over southern Canada.
In contrast, a weak/collapsed Polar Vortex creates a weak jet stream pattern. As a result, it has a harder time containing the cold air, which can now escape from the polar regions into the United States and Canada. Image by NOAA.

For example, a weak Polar Vortex can greatly increase the odds of cold and snow across the central or eastern United States. In nature, this means a significant disruption of the jet stream and the release of cold air from the polar regions.
This makes it clear that the low sea ice extent can cause a reaction of the Polar Vortex. It usually makes it weaker, and this creates a colder winter for the people in Canada, the United States or even Europe.
We will keep you updated on the global ice and weather conditions, so make sure to bookmark our page. Also, if you have seen this article in the Google App (Discover) feed or social media, click the like button (♥) to see more of our forecasts and our latest articles on weather and nature in general.
SEE ALSO: