Meteorological Fall starts in September, but we are already tracking the large-scale factors at work that will impact the coming weather seasons, like the return of La Niña. It is likely to influence the Fall weather patterns over the Northern Hemisphere, especially the United States and Canada, which will continue into the Winter of 2025/2026.
Forecasts already suggest a significant pattern shift from September to November, mostly over North America, due to the growing influence of the nearby La Niña and other seasonal changes.
This Pacific Ocean anomaly has a known history of seasonal impacts. So, before going into the Fall forecasts, we will quickly look at how La Niña works and what its past influence can tell us for the upcoming season.
THE COLD LA NINA RETURNS
La Niña is a cold phase of the large and powerful oceanic ENSO oscillation. It is a region of the tropical Pacific Ocean that shifts between cold and warm phases. The cold ENSO phase is called La Niña, and the warm phase is called El Niño.
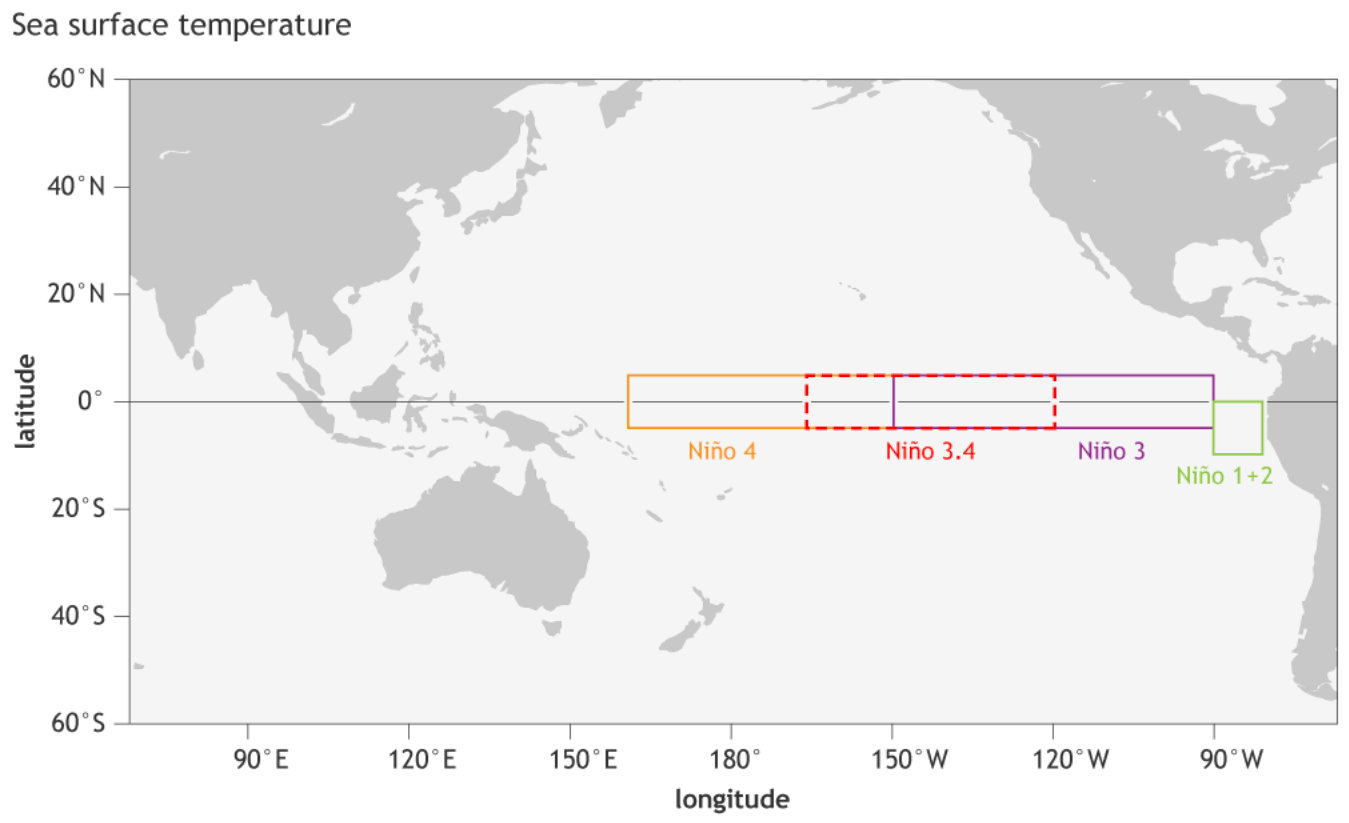
We determine the ENSO phase by the temperature anomalies (warmer or colder) in the ENSO 3.4 region, as shown in the image below. The image also shows all the other ENSO regions, which together cover a large part of the equatorial Pacific.
Below, you can see the typical circulation during a negative ENSO event (La Niña). Air is descending in the eastern Pacific, creating stable and dry weather conditions. At the same time, rising air in the western Pacific causes frequent thunderstorms and plenty of rainfall.
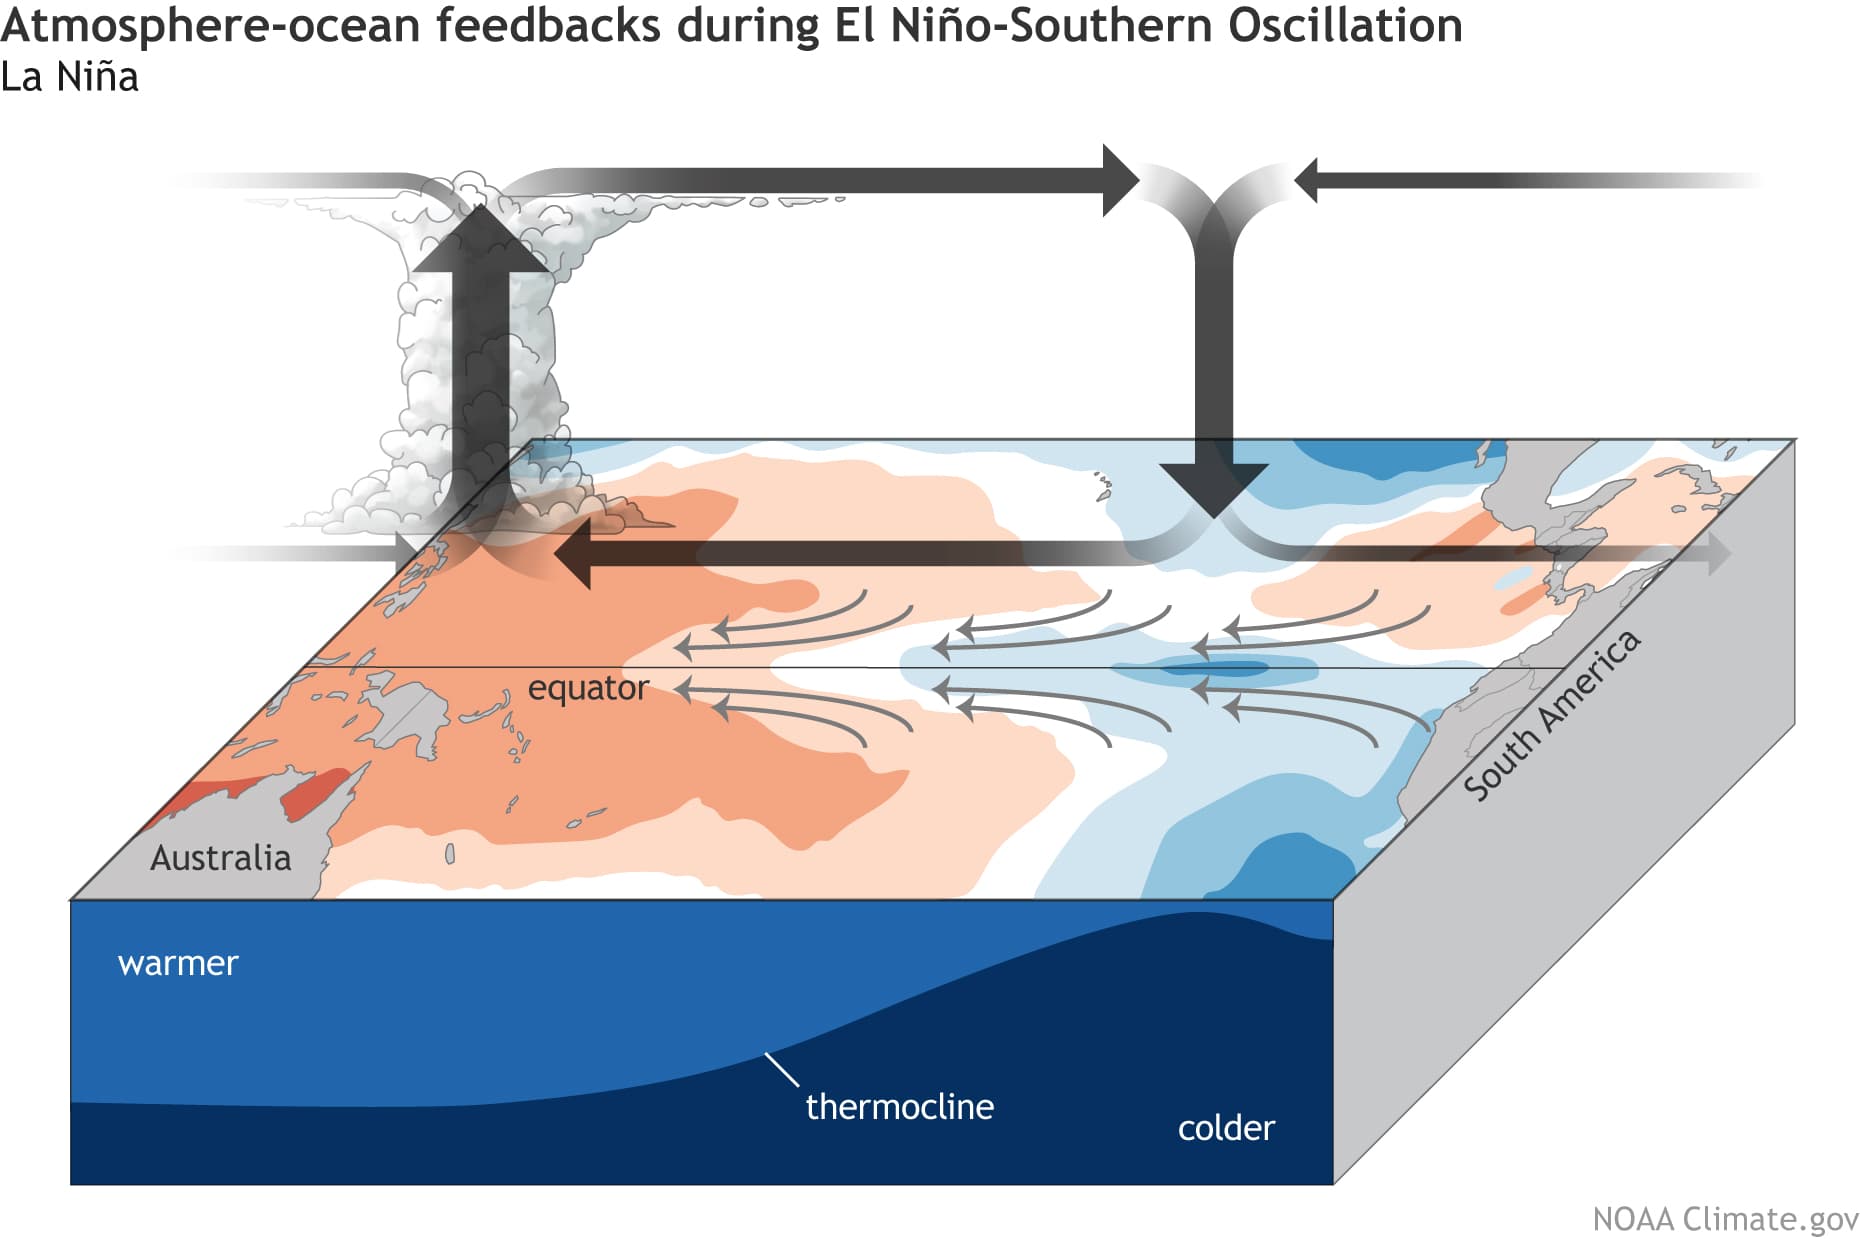
This way, ENSO has a major impact on the tropical rainfall and pressure patterns, impacting the very delicate ocean-atmosphere weather system. This system then distributes the ENSO influence globally, impacting our daily weather.
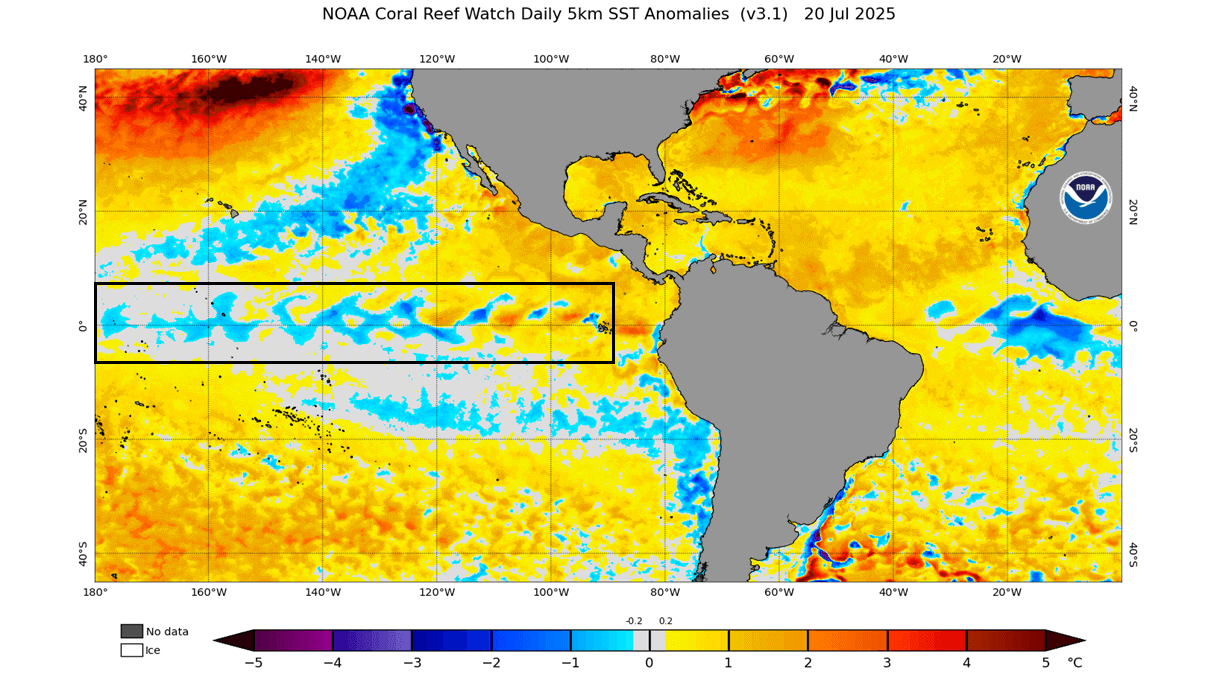
The image below shows the latest ocean temperature anomaly analysis. It reveals normal to cooler surface waters in the central ENSO regions, and a bit warmer in the east. You can see the cold anomalies have a “wave-like” shape. This is because of the strong easterly trade winds that push the waters towards the west, creating swirls on the ocean surface.
We have also produced a video from the latest ocean data, which you can watch below. The video shows changing ocean anomalies over the past weeks, where you can see how the temperatures change across the ocean surface with the trade winds.
We are currently in a neutral phase, coming out of a weak La Niña from the last Winter. But while the oceans are currently calm, the latest forecasts indicate interesting development during the Fall and Winter seasons.
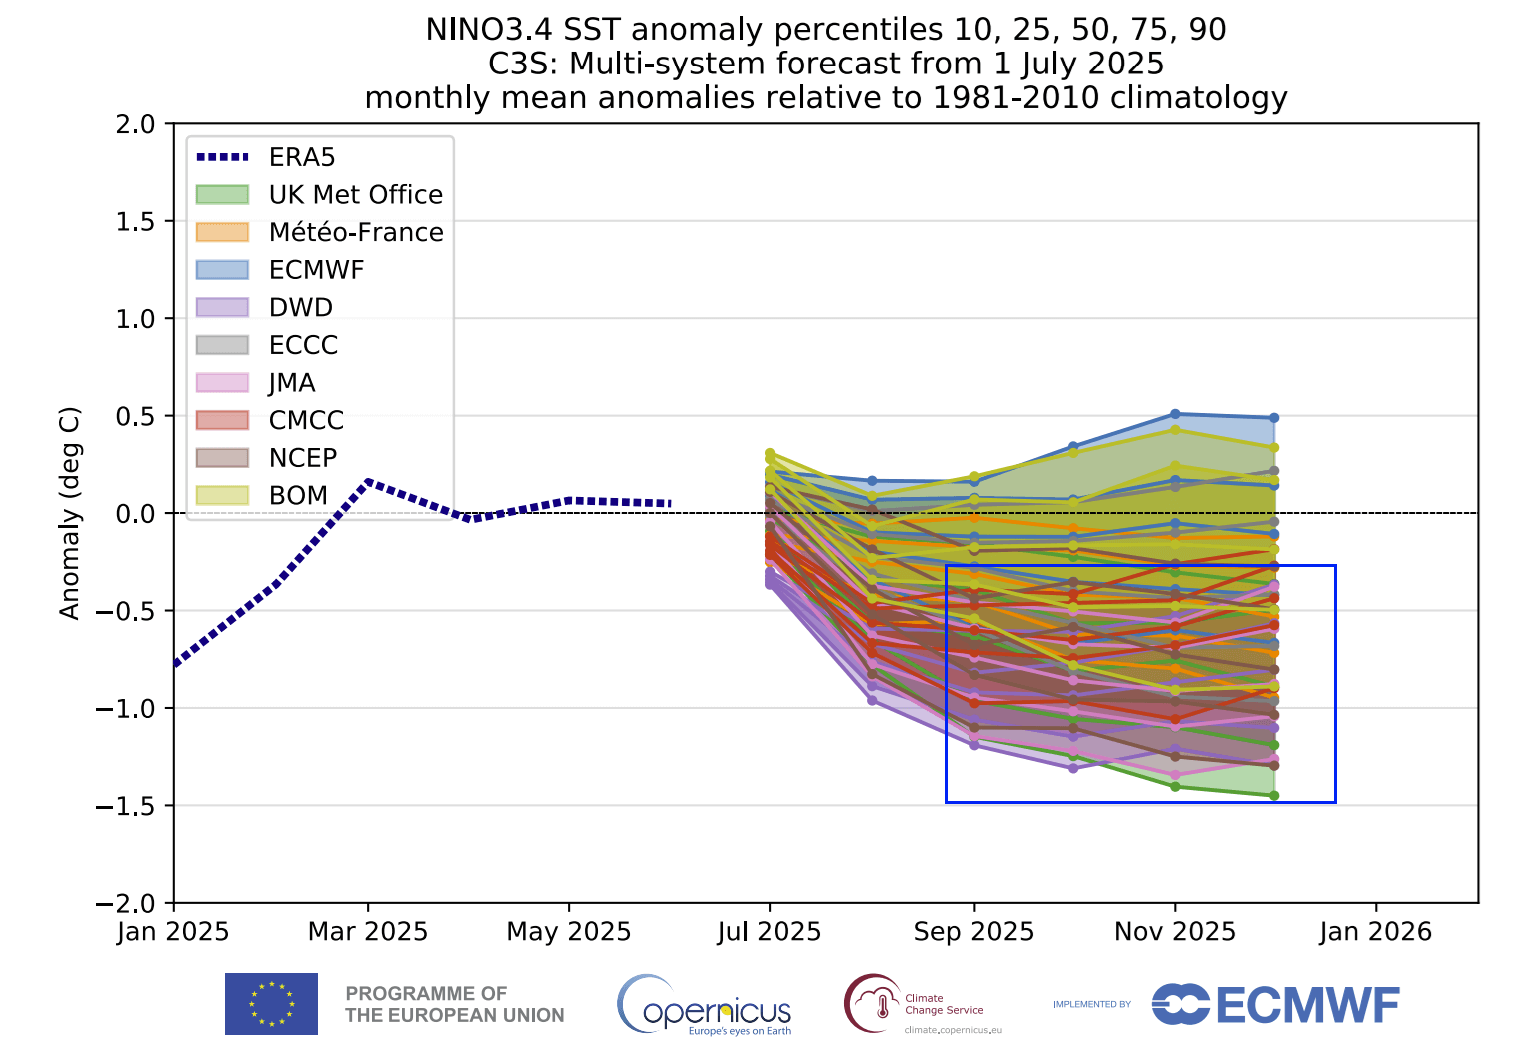
Looking ahead, you can see the ensemble forecasts below for the main ENSO region. The average forecast from all the calculations falls within the colder phase, with a high number of calculations well within the La Niña threshold. The weakest signal is from the ECMWF model, but it has made a step closer to a La Niña since the previous run.
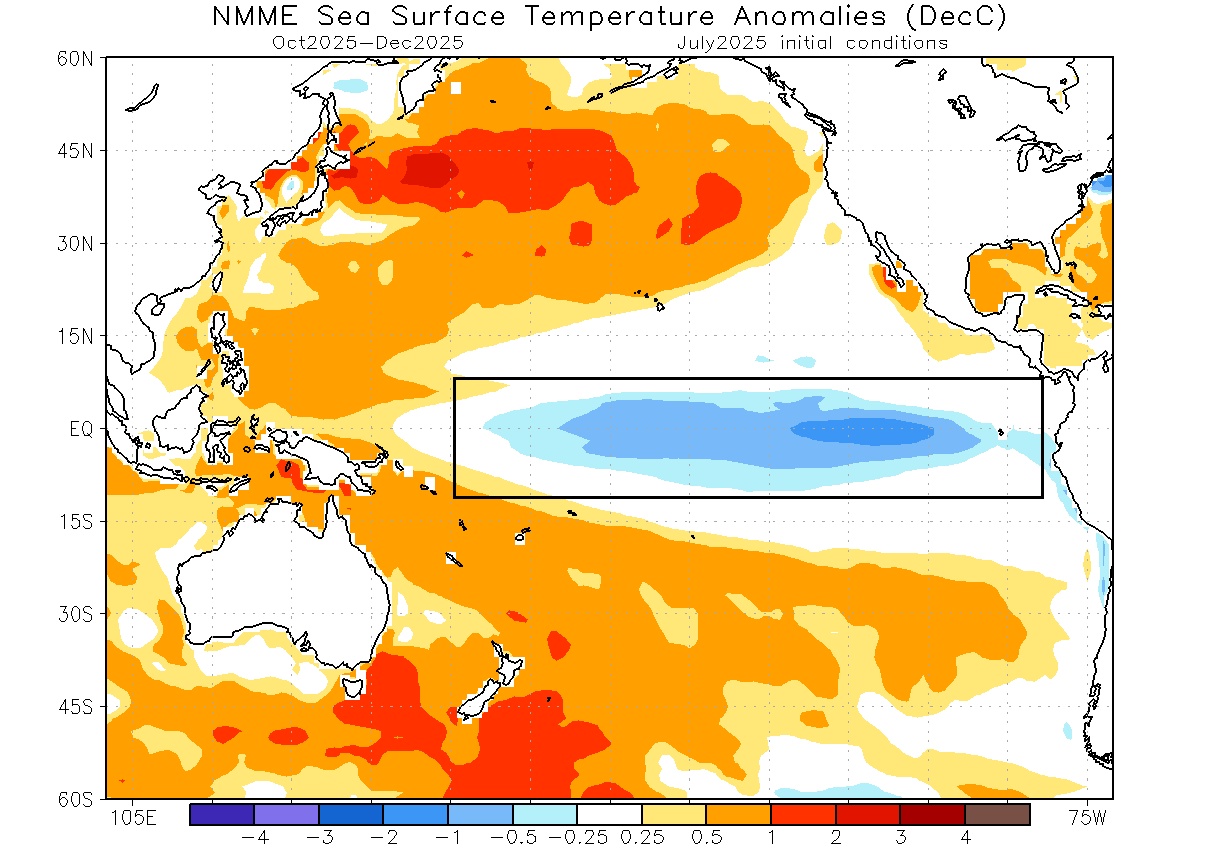
Below, you can see the ocean temperature forecast for Fall and early Winter from the North American NMME model. You can see an area of cold anomalies over the tropical Pacific, indicating a weak to moderate La Niña. Such an event can have a clear impact on the atmosphere during the cold weather season.
Knowing that we will very likely have an active weak La Niña event again, we can check its seasonal influence from previous such events.
FALL WEATHER PATTERNS IN A LA NINA SEASON
Several Fall/Winter seasons have had an active La Niña phase in recent decades. This gives us an opportunity to examine past data to see how the Fall weather patterns usually developed under a La Niña.
We produced special graphics that show some of the more recent weak La Niña Fall seasons, and what their weather patterns were. It can give us some hint of the seasonal weather influence of a weak La Niña.
The temperature analysis shows below-normal temperatures over Alaska and the Pacific Northwest, indicating an influence from a low-pressure area over the west coast. A large part of the United States and southern Canada shows warmer anomalies due to a more southerly flow.

Europe is divided into a cooler southern part and a normal to above-normal northern half. This is due to the easterly flow over the south, produced by the low-pressure system over the area.
Precipitation patterns in a La Niña Autumn season are more dipole-like. We can see a drier-than-normal pattern over most of the southern parts of the United States and wetter conditions over the northern United States and southern Canada.

Over Europe, we see a drier trend over the central and western parts and more precipitation in the north.
Of course, these graphics show a mix of different seasons, all under a weak La Niña. But there are also other factors that play a role in global weather. But the La Niña influence is more direct over North America, so there we can see that it usually produces a warmer Fall over much of the U.S. and southern Canada.
Knowing what La Niña is and how it can impact the Fall seasonal weather, we will now look at the actual forecasts to see if we can find its influence on the coming Fall 2025 weather season.
FALL 2025 FIRST LONG-RANGE FORECAST
For the first Fall 2025 forecast, we decided to focus on the two main (or most used) seasonal models: The ECMWF model and the NMME, which is a combined forecast from several different North American models. Forecast images are from the Copernicus Climate EU project and Weatherbell (commercial license).
All these forecasts are an average picture over 3 months (September-October-November) and show the general prevailing weather pattern forecast for the meteorological Fall.
The pressure pattern forecast shows a high-pressure system in the North Pacific, with another high-pressure area extending from the northeastern United States into the Atlantic. It also shows a low-pressure zone over Canada, with a possible extension into the U.S. later in the season towards Winter.
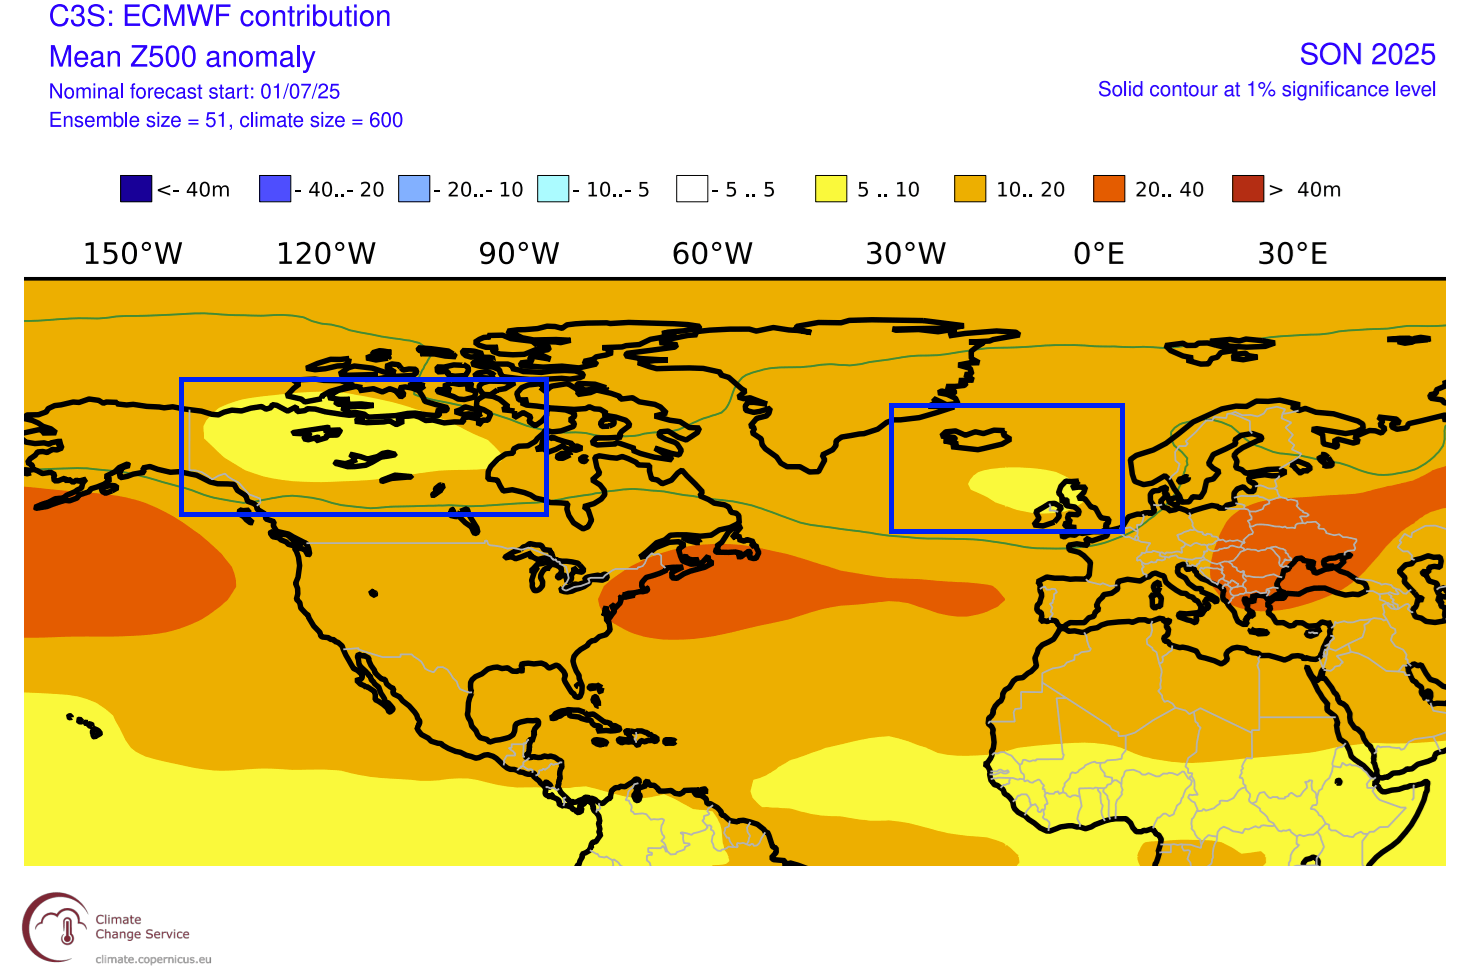
In the European sector, a low-pressure area is indicated over the UK and Ireland. This promotes a westerly flow over the continent and a warmer southerly flow towards the east.
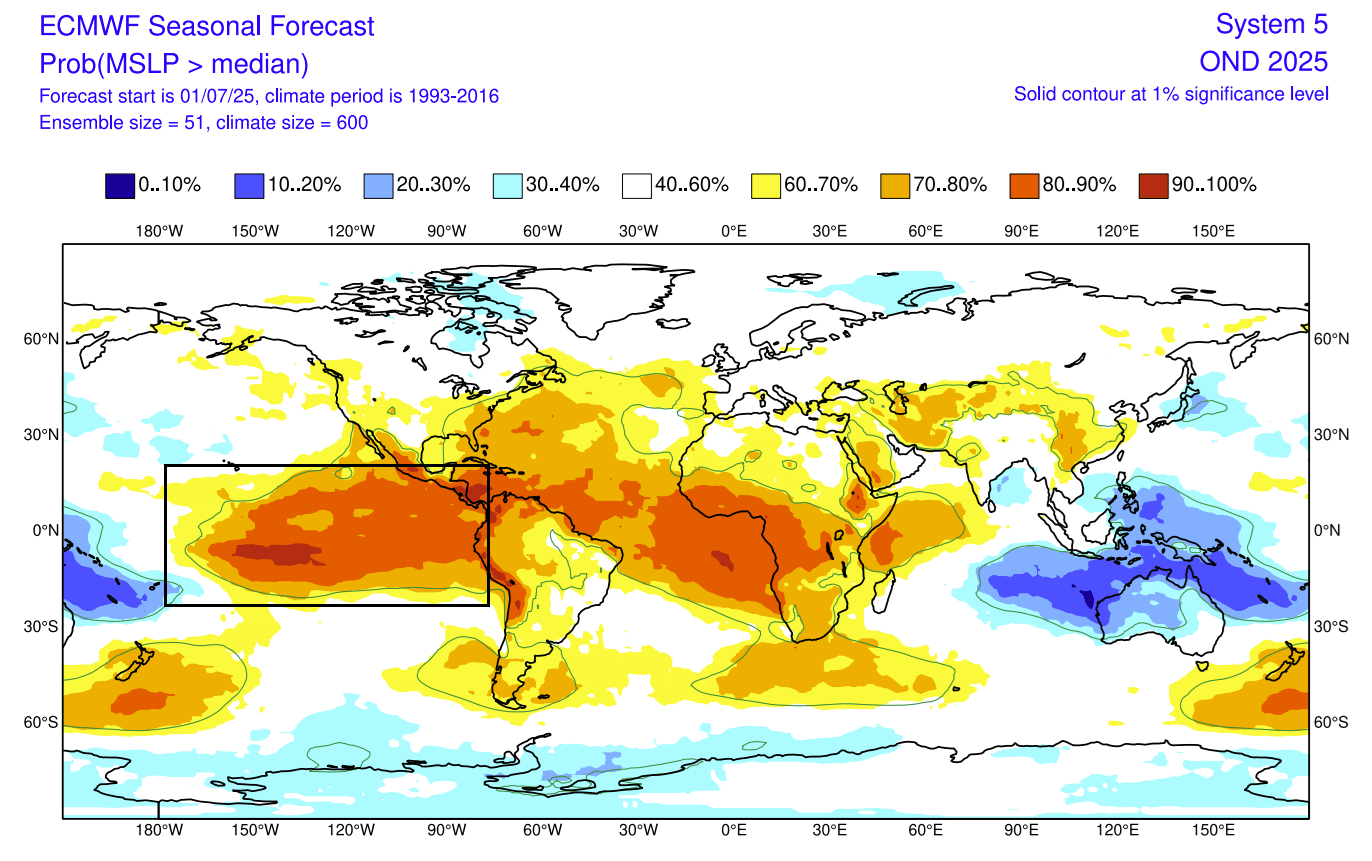
The ECMWF is currently the model least in favor of a new La Niña. But its surface pressure forecast for Fall and early Winter shows a slightly amplified high-pressure zone over the ENSO regions. There is a low-pressure anomaly over the Maritime Continent, which in total indicates a stronger Walker Circulation and a clear signature of an active La Niña-like pattern.
This effect is also reflected in its weather pattern forecast, but how about the temperature and precipitation?
FALL TEMPERATURE AND PRECIPITATION FORECAST
First, looking at Europe, we can see warmer-than-normal surface temperatures over much of the continent. But warmer anomalies are more profound over the southerly flow in the central area and towards the northeast, while the western parts are under a less warm westerly flow.
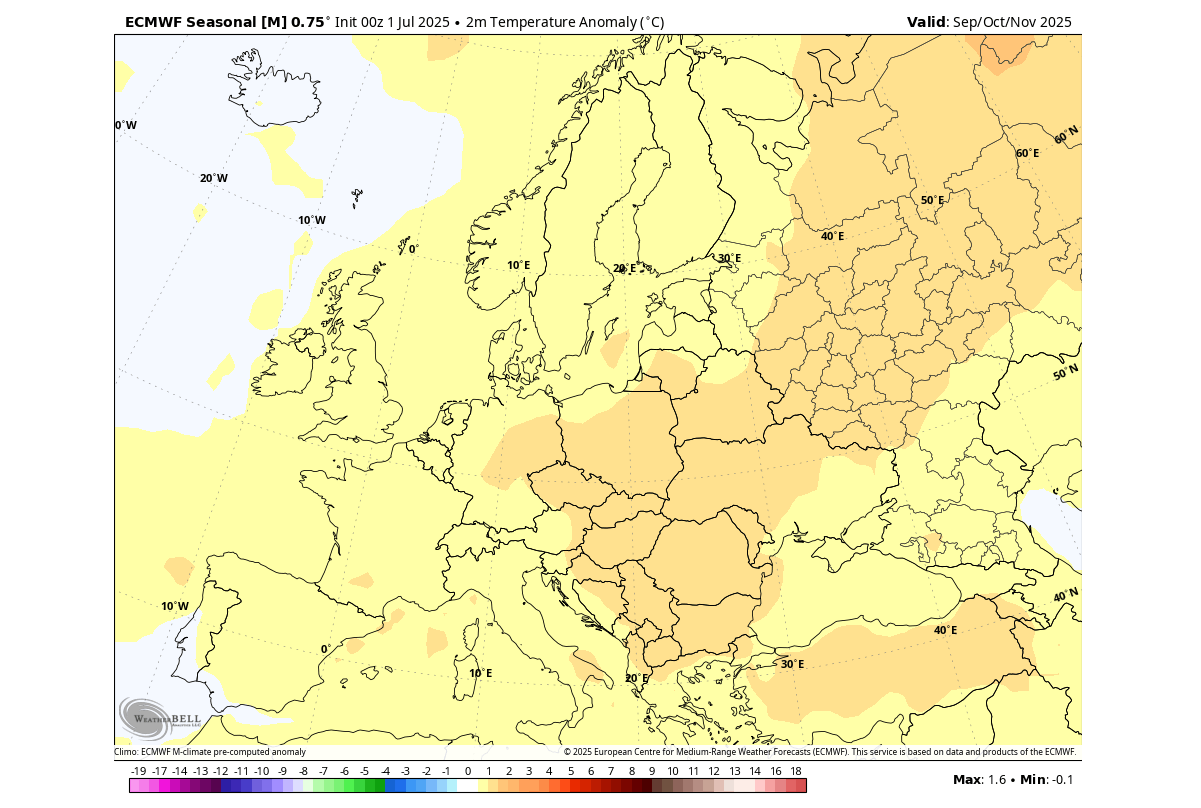
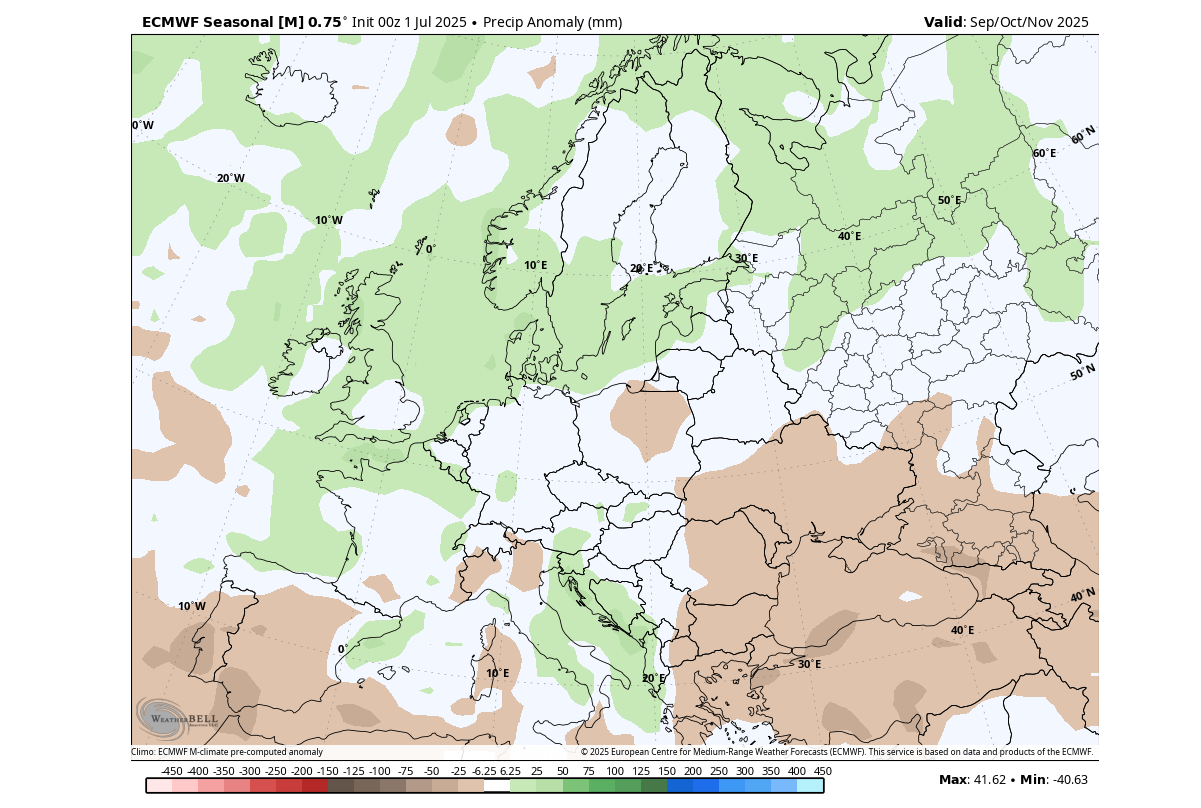
The precipitation forecast shows a drier Autumn over the southwestern and southeastern parts. At the same time, a low-pressure zone is forecast to bring more precipitation to central parts and over a large part of the northern half.
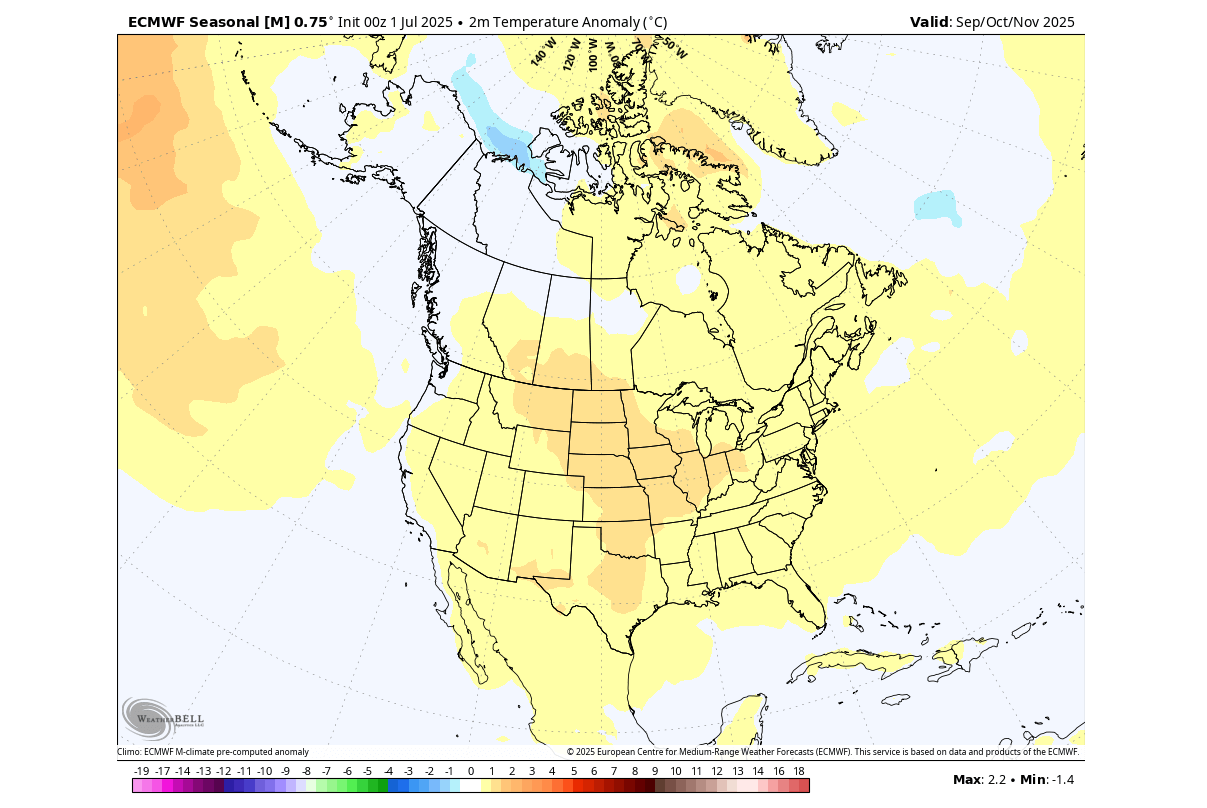
Across the United States, we see the core of warmer temperatures in the central and northern parts and southwestern Canada. The far western and eastern parts do show a pattern of more normal to above-normal Fall temperatures, while the strongest warm anomalies remain over the central parts.
Looking at precipitation, you can see drier conditions over a larger part of the United States and deep southern Canada. More rainfall is forecast for the Pacific Northwest, the southeastern U.S., the lower East Coast, and eastern Canada.
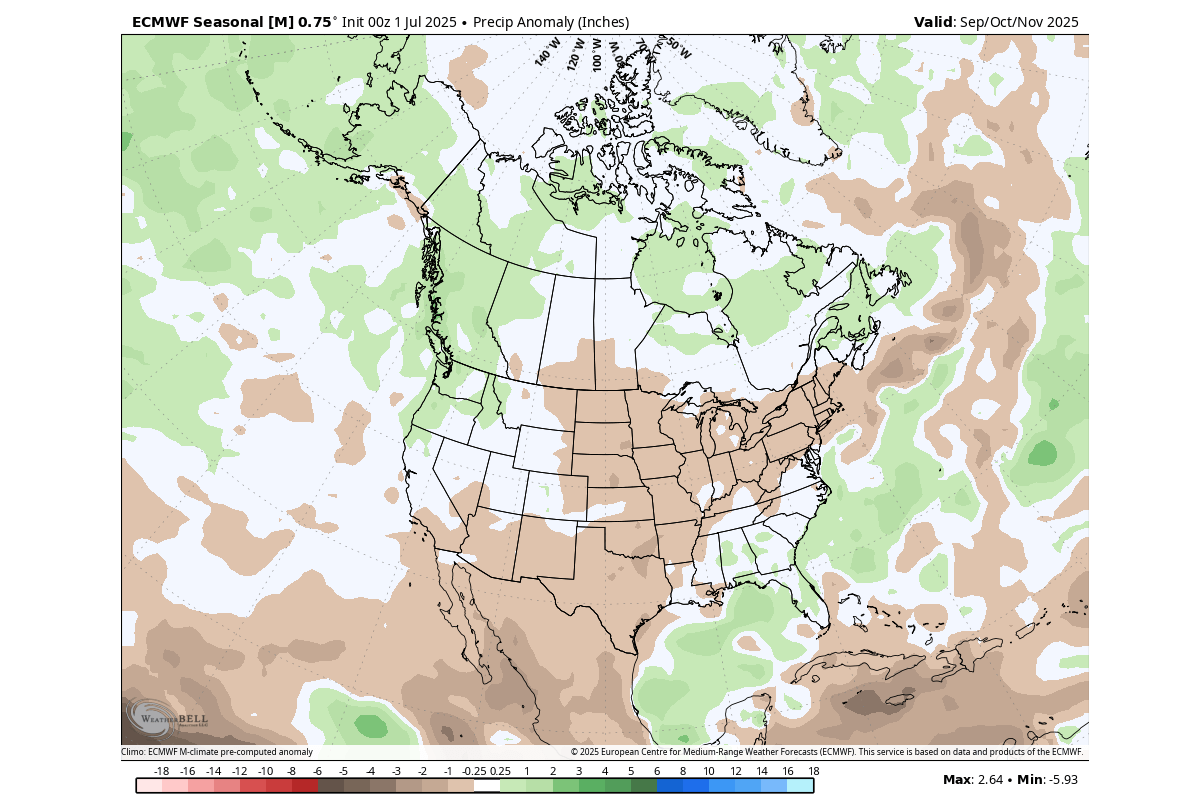
Overall, this suggests a more high-pressure, dominant Fall across the central United States, based on temperature and precipitation patterns. But this pattern is likely more dominant in the first half of the season, as it looks more like an extension of the Summer pattern.
MAJOR PATTERN SHIFT BEFORE WINTER
For this reason, we decided to also look at November, which is the last month of the meteorological Fall. It can give us an idea of the changing weather pattern over the season, as the 3-month average forecast above can hide some monthly variation.
The image below shows the direct comparison between September (left) and November (right) Pressure patterns. You can see a significant change in the position of pressure systems, almost a total reversal. This also brings along a change in temperature and precipitation patterns.
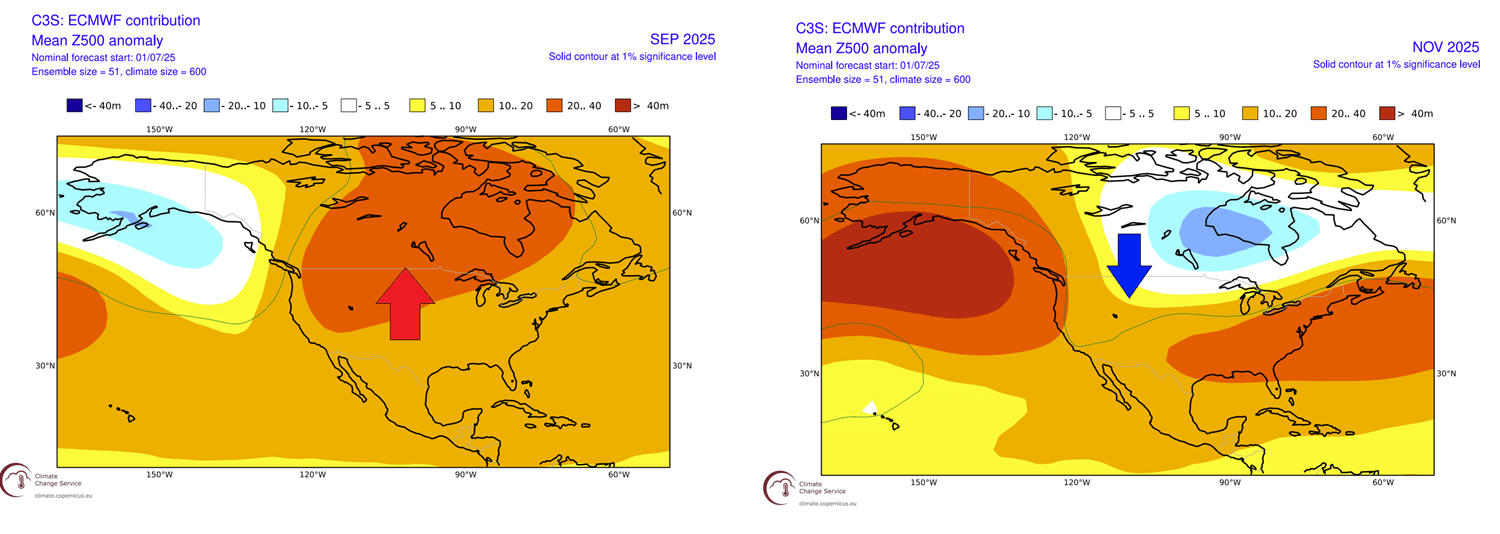
Low-pressure systems spin counter-clockwise. So, having a low-pressure area over Canada in November, it promotes a more northerly flow over western Canada and into the northern United States. That is a large contrast with the spreading warmth under a high-pressure area in September.
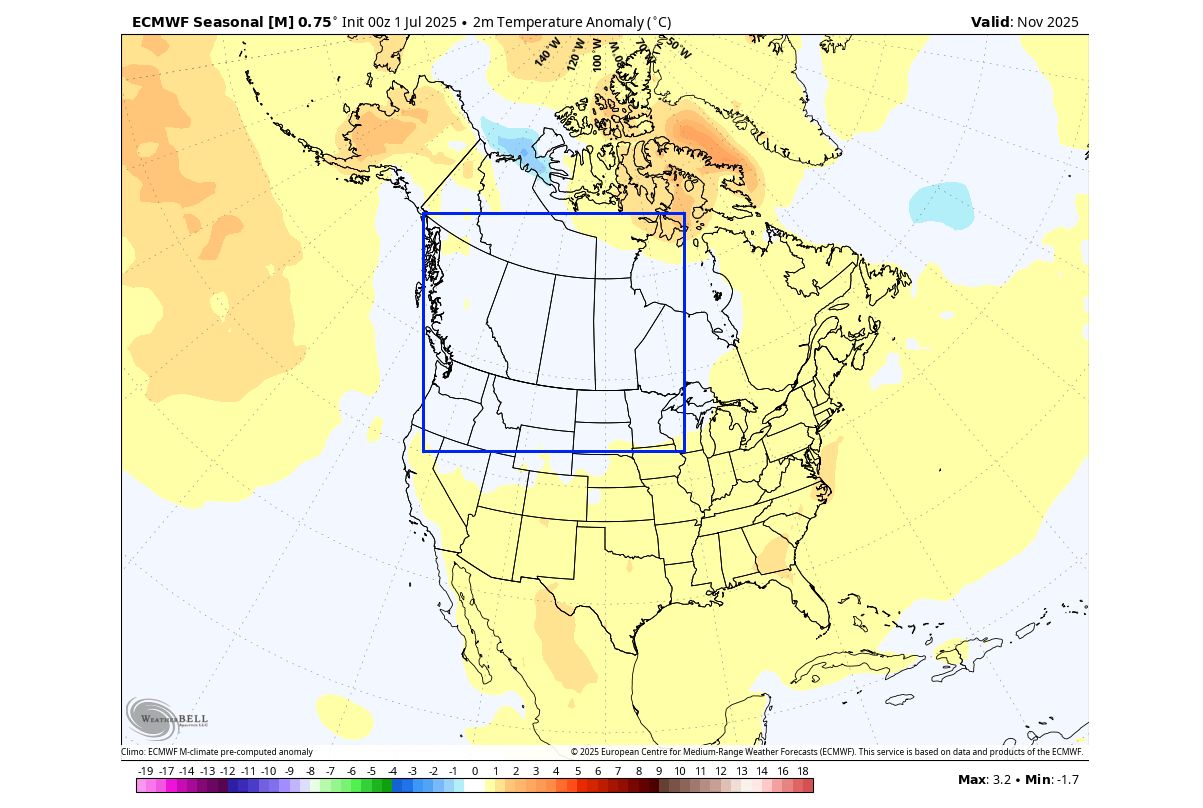
Below is the November temperature forecast, which shows a significant change compared to the 3-month forecast above. The strong warm anomaly over the United States is gone, and the forecast suggests an expansion of the west-Canadian cold pool, also bringing more seasonal temperatures into the northern United States.
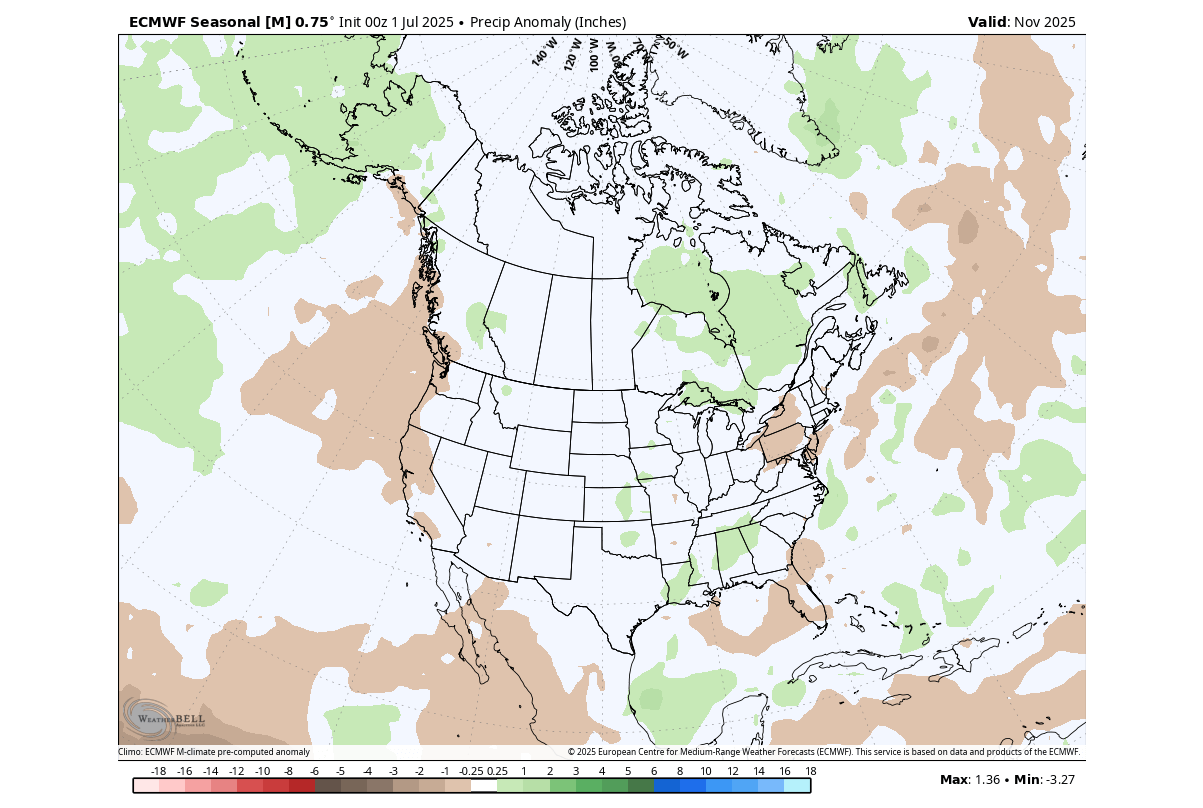
The precipitation forecast also shows a much different pattern than the 3-month average, with no large precipitation deficit forecast over the United States. Less precipitation than normal is seen over the northeastern U.S. and the Pacific Northwest, but the rest of Canada and the U.S. are at normal levels.
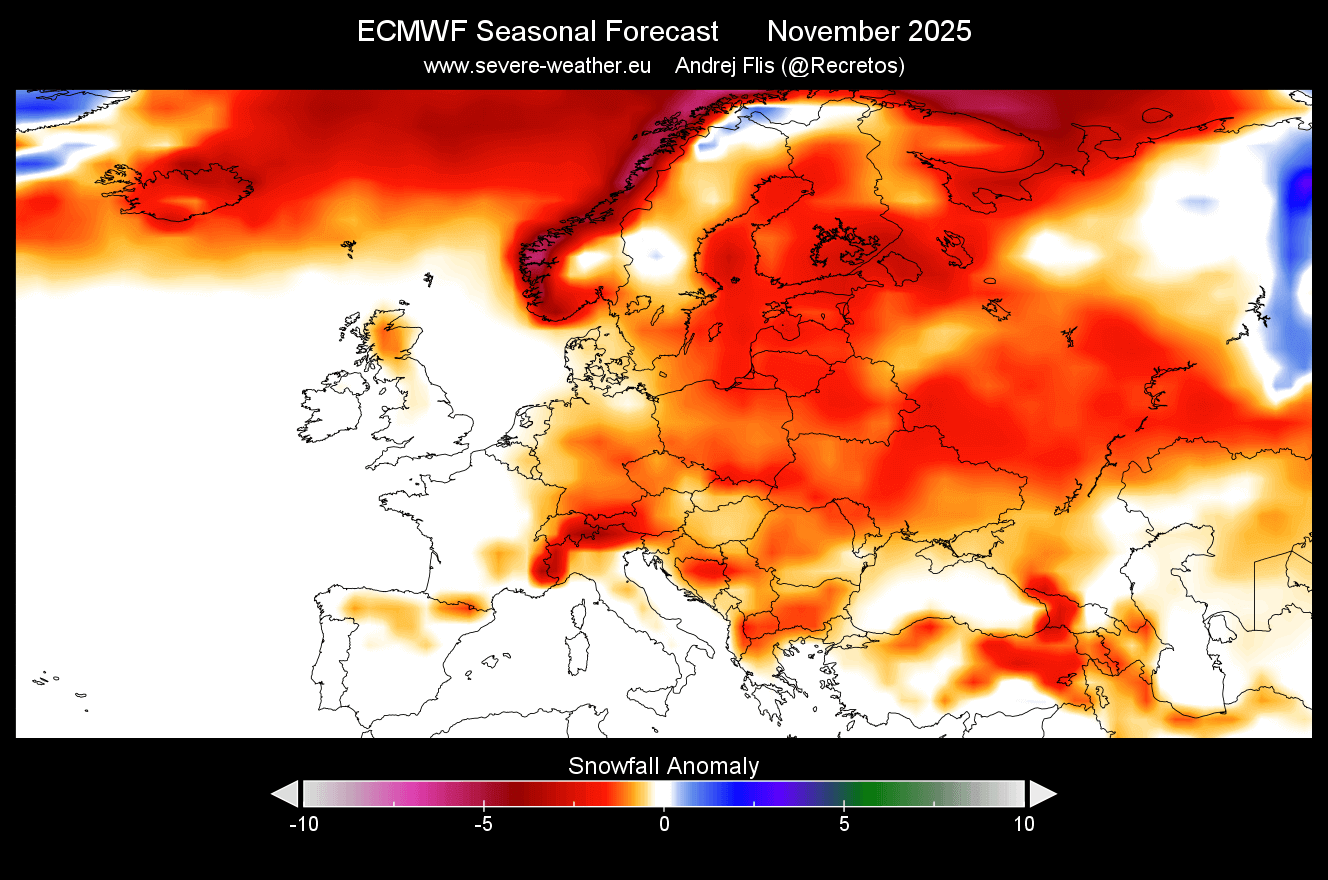
This indicates a pretty significant pattern reversal from the start to the end of Fall over North America. But as we are already looking at November, we can look at the snowfall predictions, as November is usually the month when the cold air is starting to be available more often again, allowing snowfall to return.
The snowfall forecast for November shows less snowfall over the northeastern and far western United States and the upper Midwest. But there is more snowfall forecast over the northern Rockies and also down into parts of the central Plains.
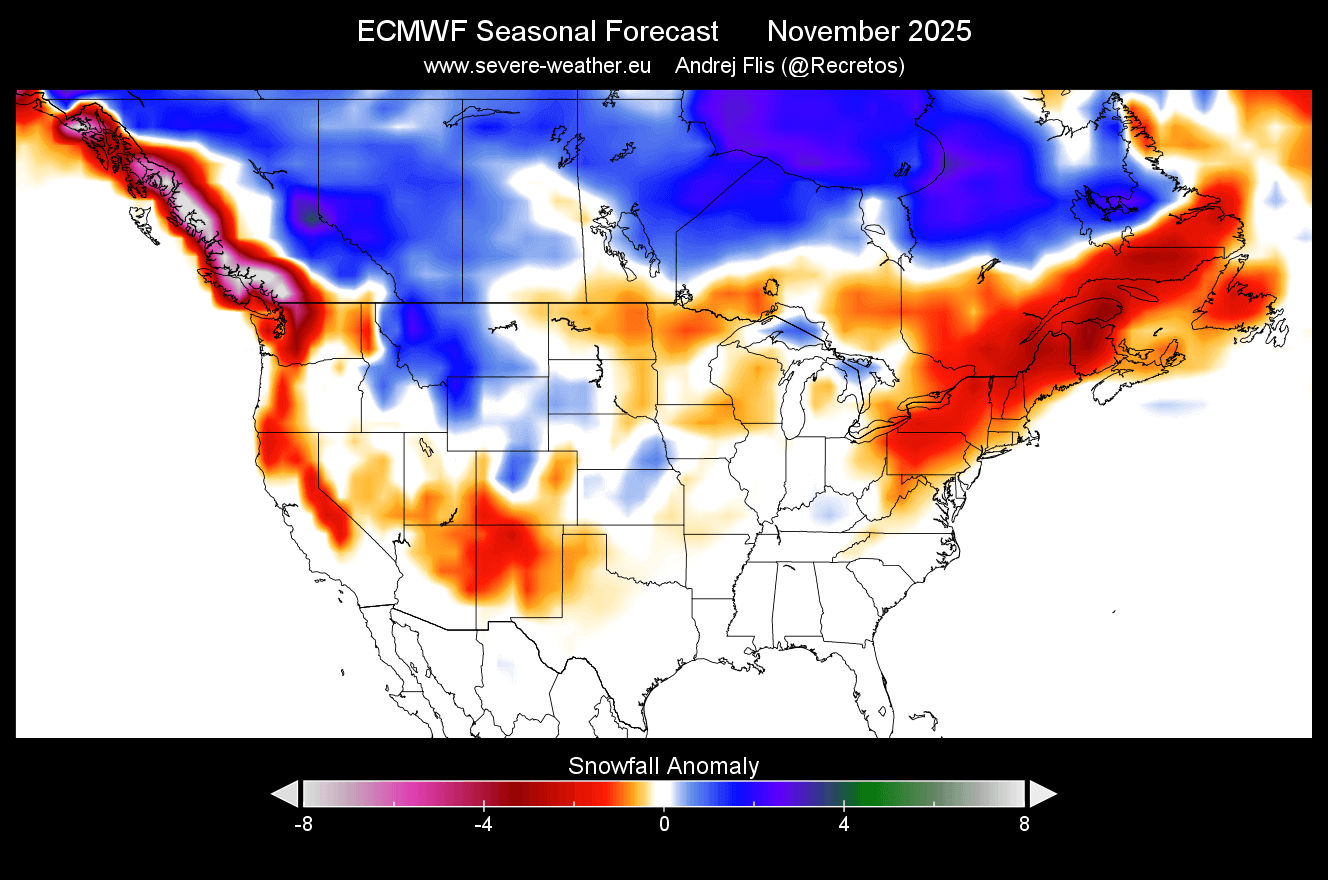
Another area of above-normal snowfall is across central and western Canada. This is important because a larger snow coverage over western Canada typically provides a potentially colder airmass to the United States. This is because the Polar airmass warms up more slowly when passing over a snow-covered area.
Over Europe, the pattern looks more stable over the 3-month Autumn period, so November also shows less snowfall than normal across the whole continent. This is unlikely to improve much by winter, unless the pressure patterns shift and the jet stream moves lower.
NMME FALL 2025 SEASONAL FORECAST
In contrast to the ECMWF model, we often use the NMME model system. It stands for North American Multi-Model Ensemble (NMME). It combines several individual models to show an average picture from different solutions.
This forecasting system covers more scenarios, but the drawback is that the forecast image can get heavily diluted at longer ranges. That is due to the strong differences in the forecast, which is produced from very different models in the mix.
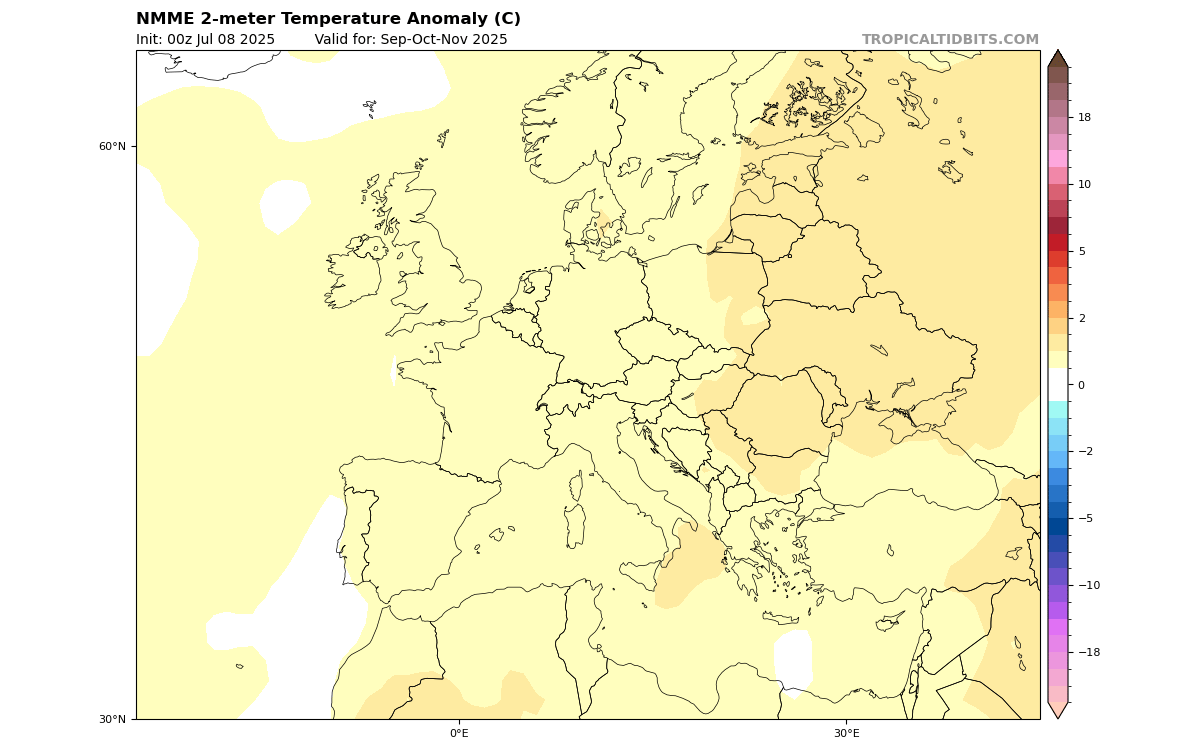
First, looking at Europe, the surface temperature forecast shows main warmer-than-normal areas over the southern and eastern parts of the continent. The central and western parts show normal to slightly above-normal Autumn temperatures throughout the season.
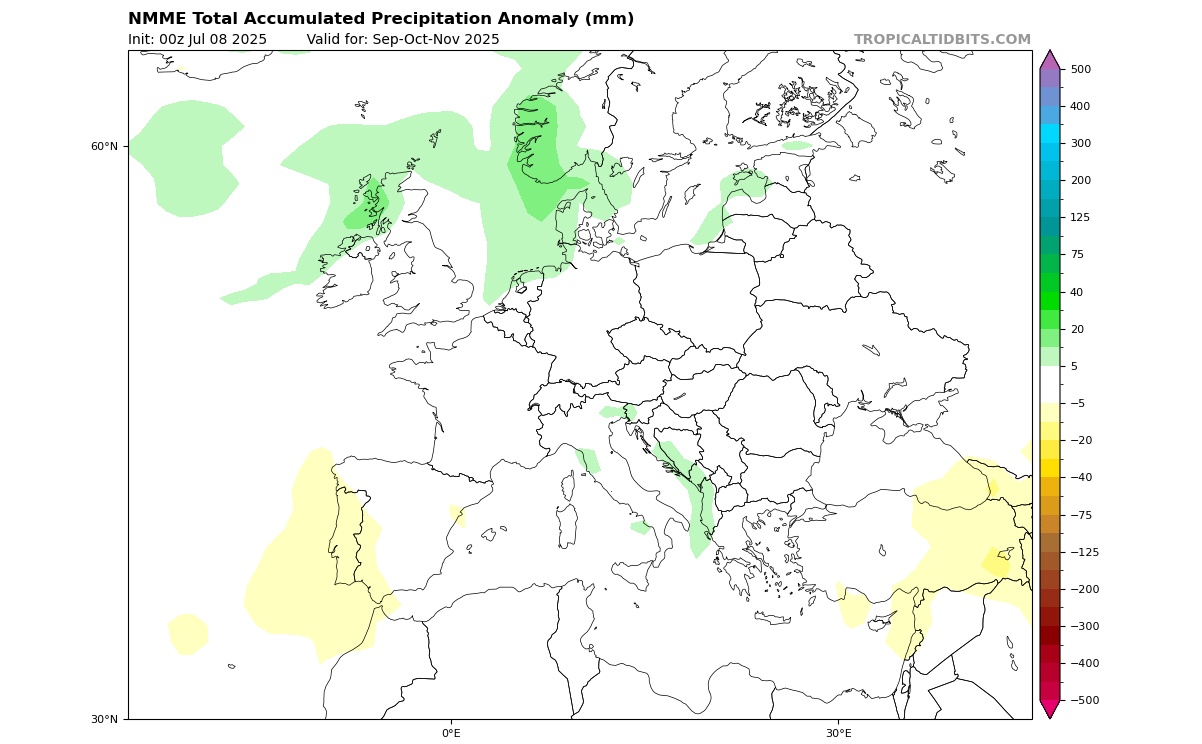
Looking at precipitation, we see wetter conditions across the northern and central parts of the continent. This suggests a likely low-pressure system in the North Atlantic with an extension into the northern and central areas of the continent, very similar to the ECMWF forecast.
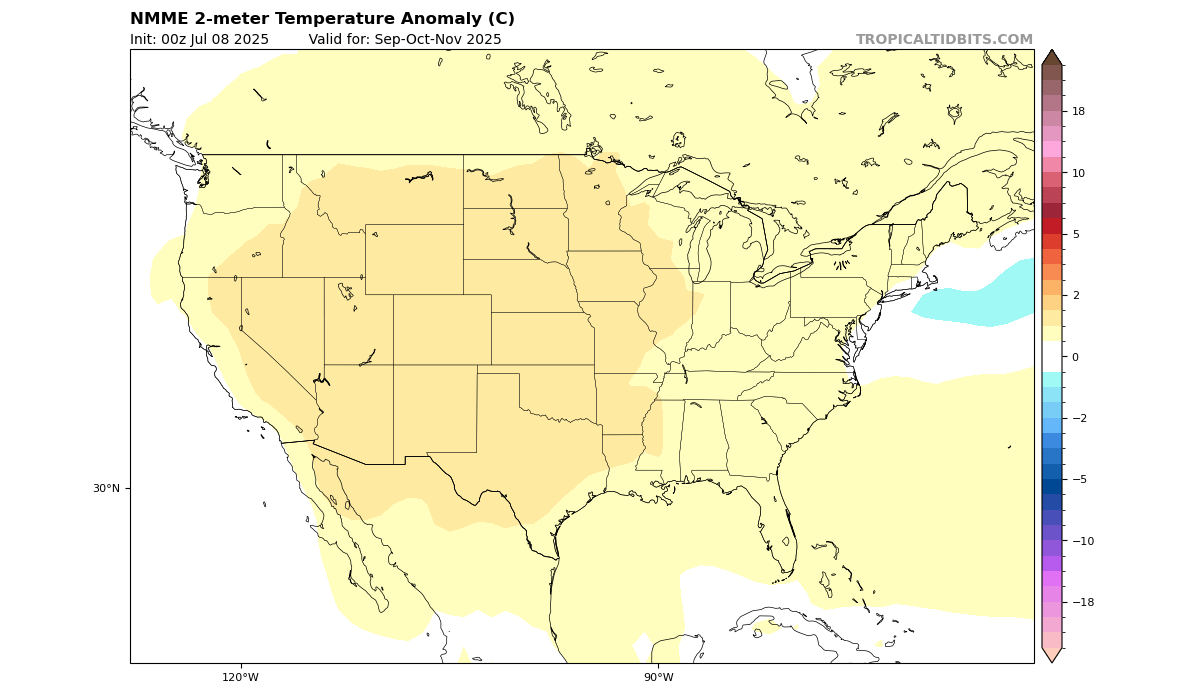
Going over to North America, the temperature forecast below shows a warmer Fall over the western and central parts of the United States. Southern Canada, parts of the upper Midwest, the eastern United States, and the Northeast all show closer to normal temperatures.
The precipitation forecast for North America shows less precipitation over the southern half of the United States. But normal Fall precipitation is likely over the northern United States, the northeast, and over eastern Canada, very similar to the expected weak La Niña influence.
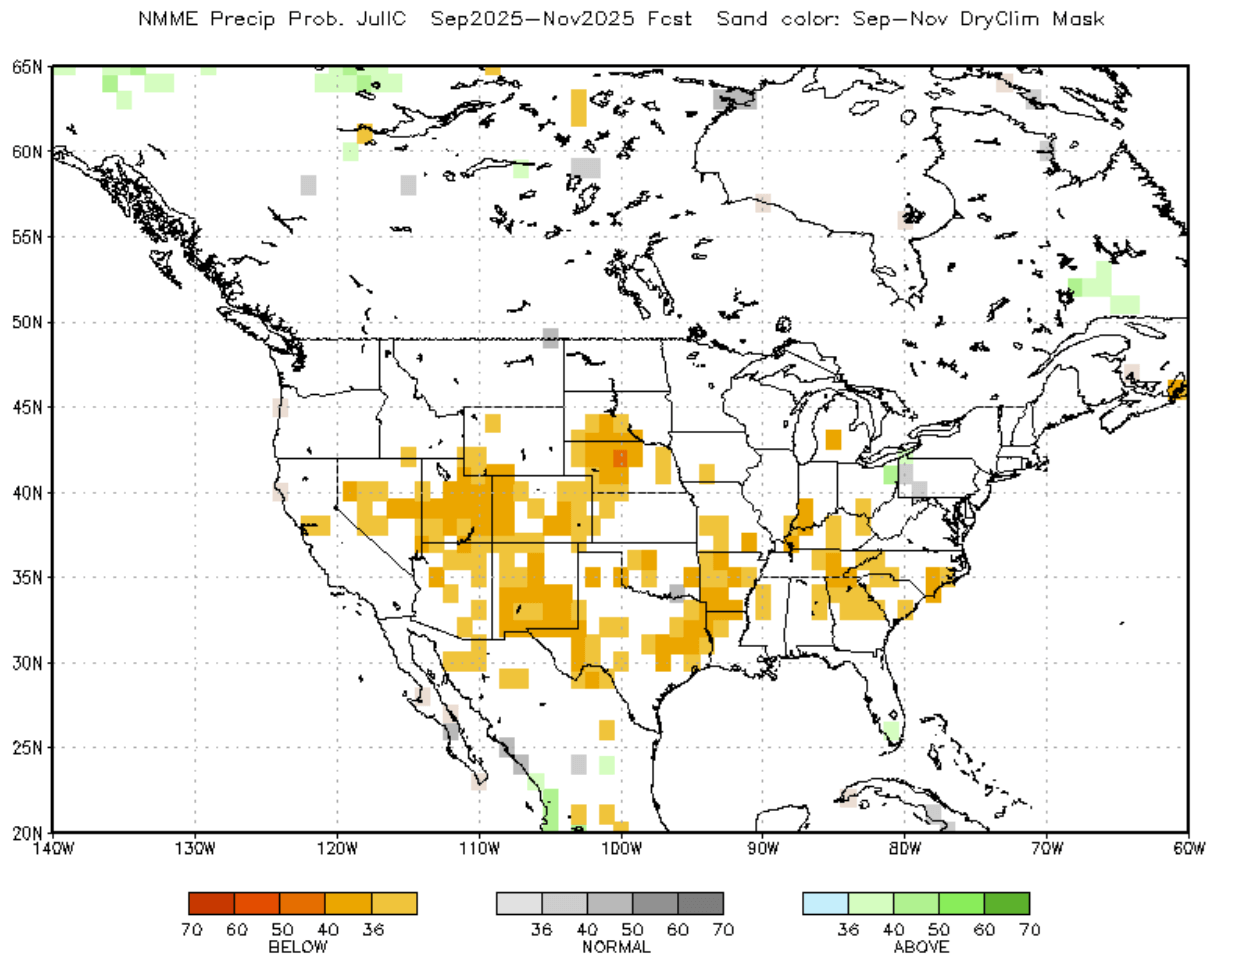
This is a bit further away from the ECMWF forecast, but precipitation trends are usually harder to predict than temperature or pressure.
FALL 2025 FIRST OFFICIAL OUTLOOK
Below is the official Fall 2025 temperature outlook from NOAA/CPC for the United States. The forecast shows a warmer-than-normal Autumn season over the western United States, with a belt of warm anomalies extending over the Midwest and up into the Northeastern United States.
We can also see a weaker warm temperature zone over the far north and the upper Midwest. That does indicate a chance of more cold fronts coming down from the northwestern United States and western Canada towards the eastern regions as the low-pressure area over Canada gets stronger towards Winter.
It could also mean earlier snowfall than normal in the northern United States as we approach winter.
Precipitation-wise, the official outlook shows drier conditions in the west-central United States. Wetter conditions are expected mostly over the eastern United States.
This is not a precipitation pattern that would reflect a proper La Niña pattern. But there is one more large-scale factor that has a very important weather role and emerges every Fall, also impacting the entire Winter season ahead.
THE SEASONAL RETURN OF THE POLAR VORTEX
The Polar Vortex re-emerges every Fall and plays a key role in seasonal weather development from November to March. So, for this reason, we have to take a quick look at its importance.
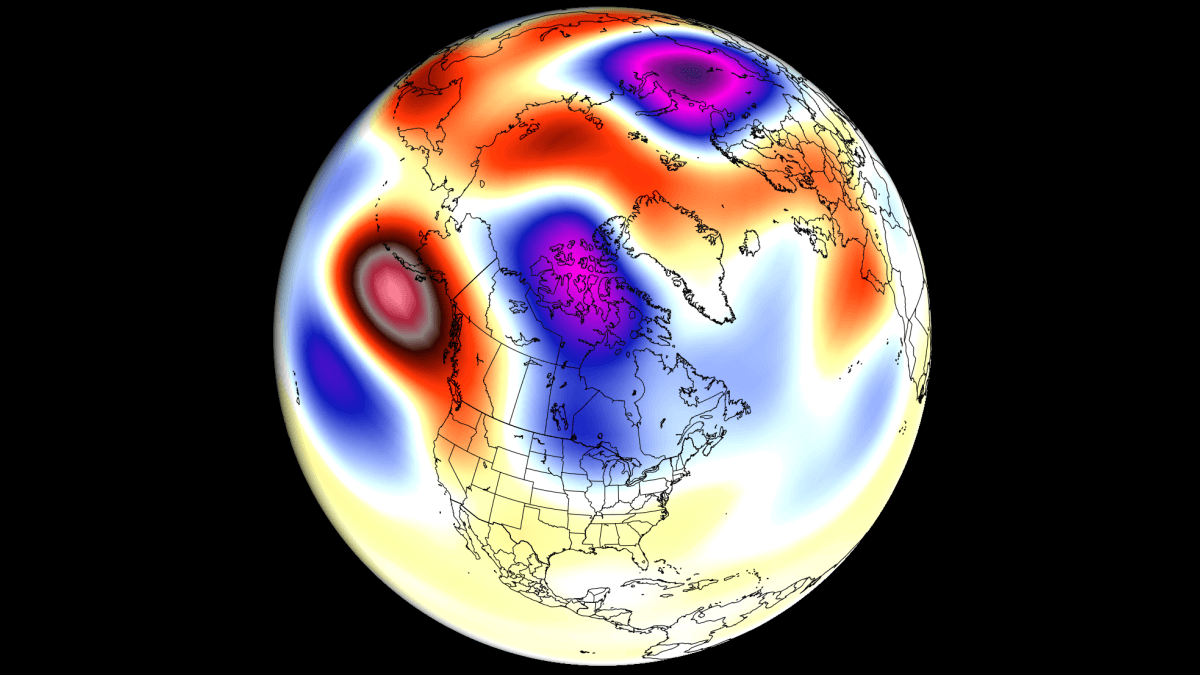
The Polar Vortex is a large cyclonic area that is spinning over the entire Northern Hemisphere, from the ground up to the top of the stratosphere, reaching over 50km/31miles in altitude.
Below is an image that shows a 3-dimensional model of the Polar Vortex, extending from the lower levels up into the stratosphere. The vertical axis is greatly enhanced for better visual purposes. This image shows the actual structure of the Polar Vortex and how it connects to the lower levels and our daily weather.
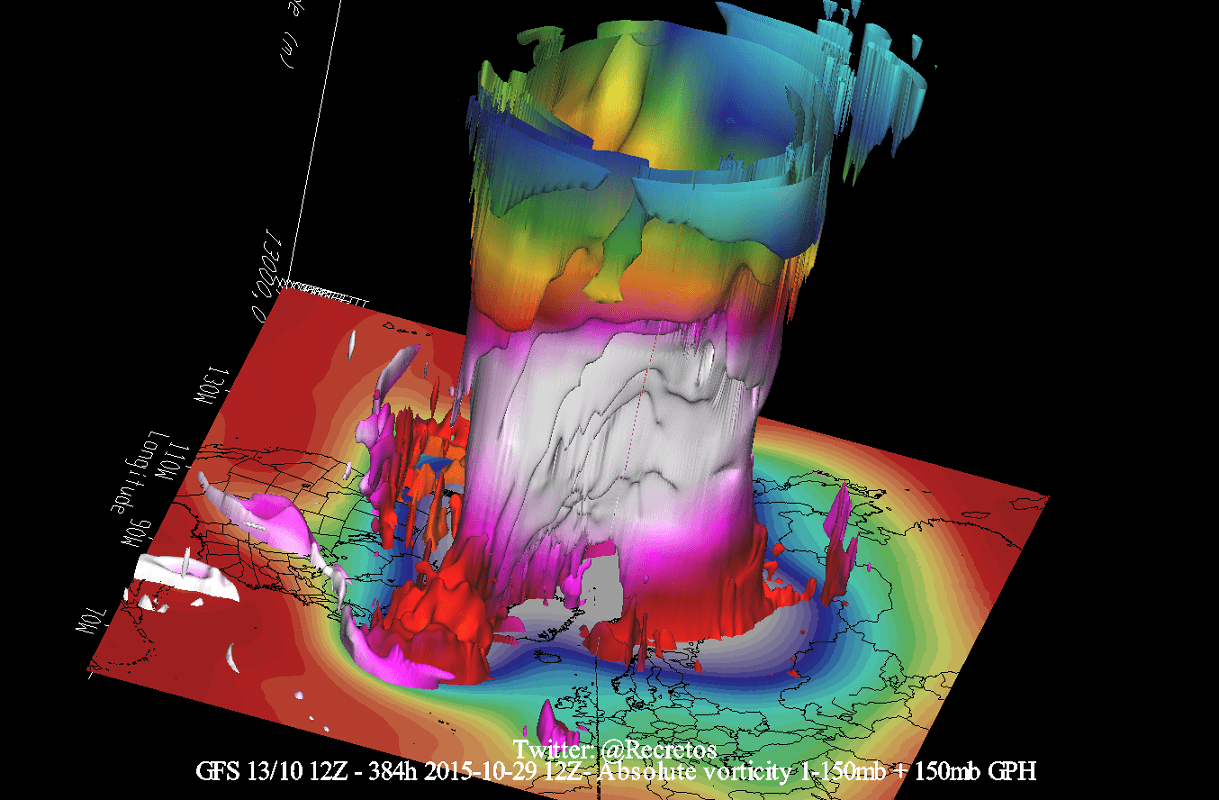
In the example above, the Polar Vortex was undergoing a temporary warming event. These events can disrupt the Polar Vortex, weakening its circulation and changing the weather patterns below.
Historically, a La Niña winter has around a 60-75% chance of producing a Stratospheric Warming Event (SSW), which is a Polar Vortex collapse. It has produced them in the past and also in more recent winters. The image below shows the typical SSW event frequency by month and by the ENSO event.
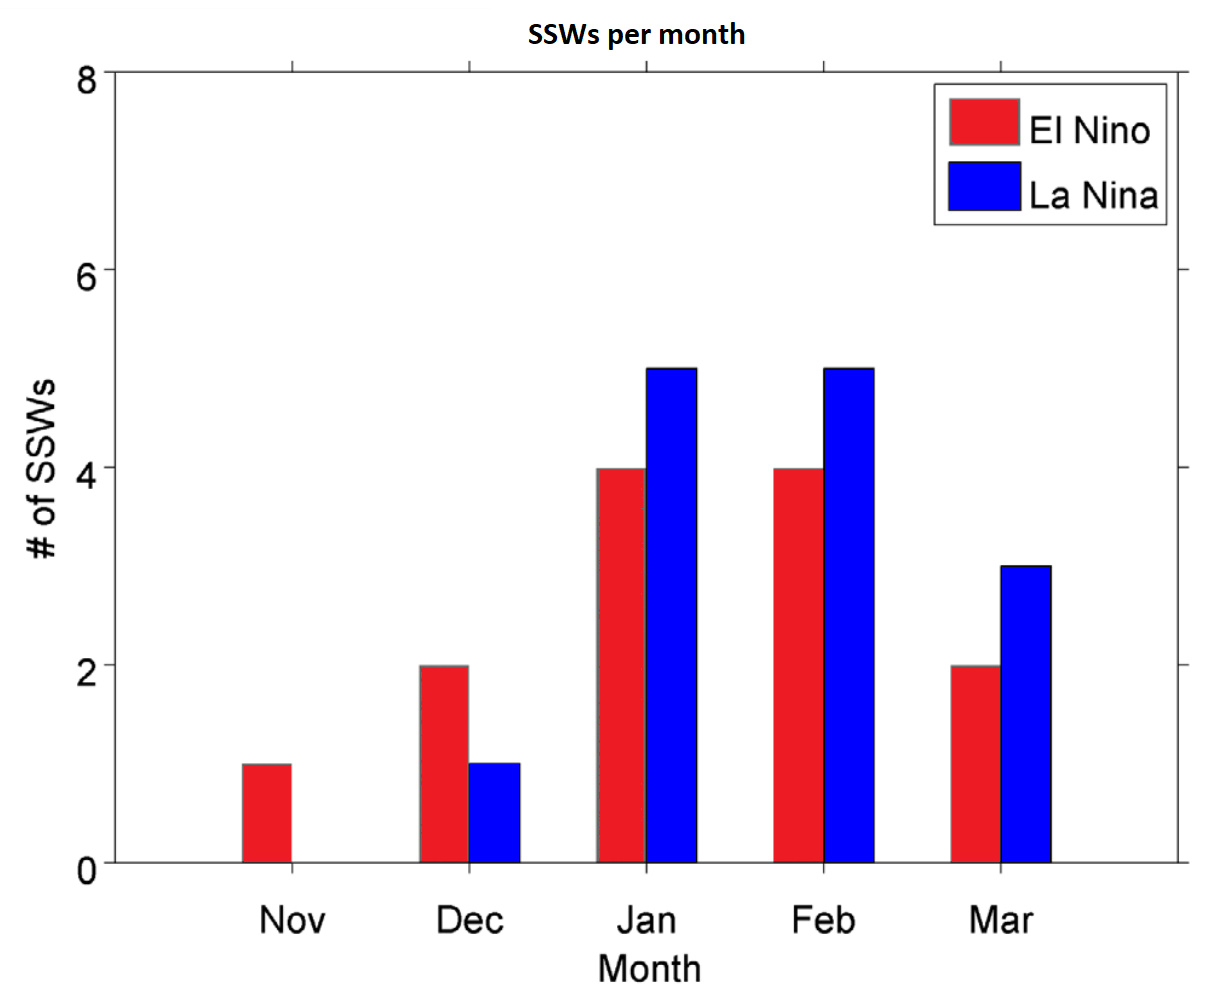
As you can see, a La Niña phase has a higher chance of producing a Polar Vortex collapse event. It also produces one a bit later in the season, which is what we saw last winter. Overall, this means that a La Niña event is favorable for a weaker Polar Vortex, but we have no extra information about a weak versus a strong La Niña event.
A weak Polar Vortex creates a disrupted jet stream pattern, leading to a strong weather response. As a result, it has a harder time containing the cold air, which can now more freely escape from the polar regions into the United States or other mid-latitude regions.
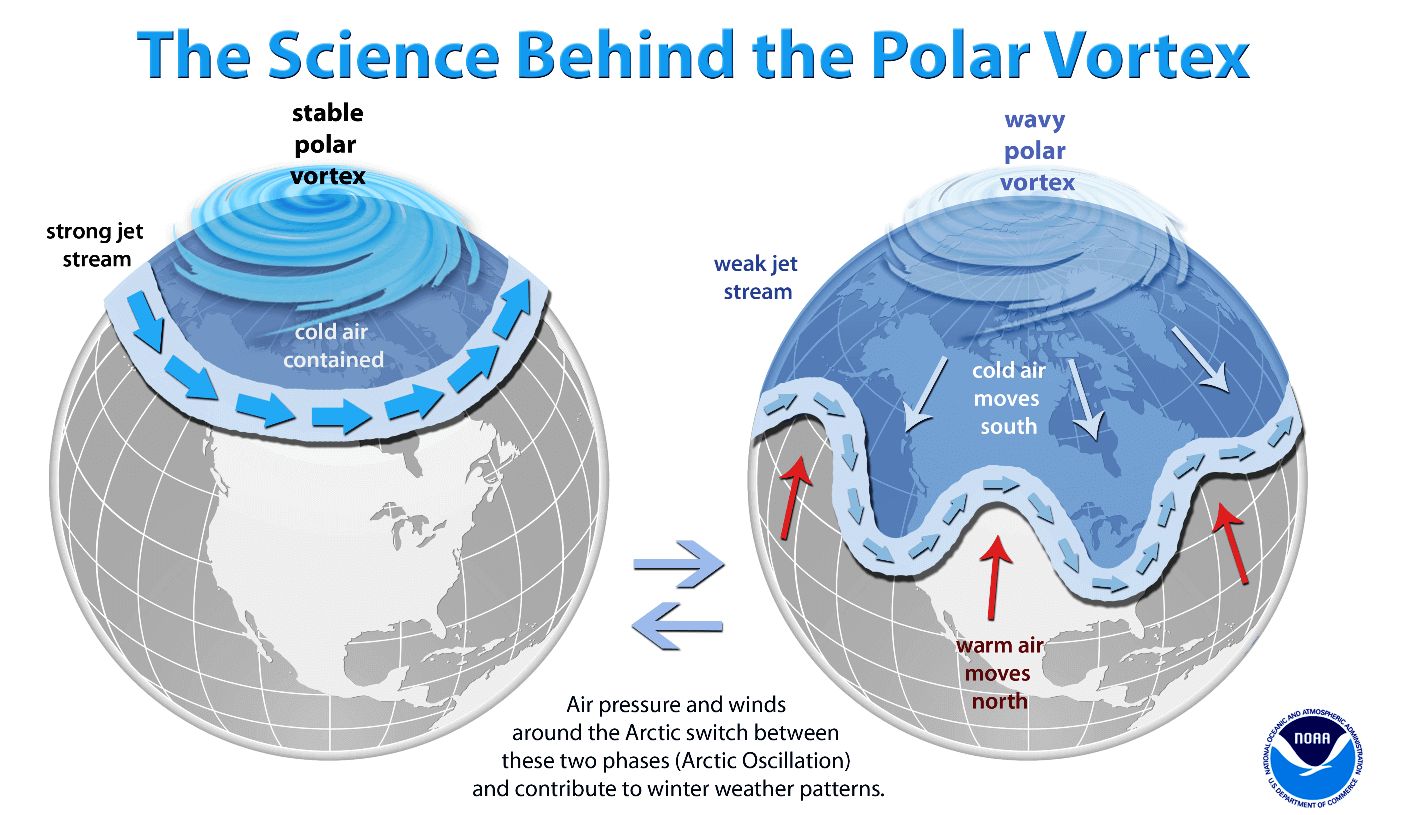
So, if you want a colder and snowier Winter, your best bet is a weak Polar Vortex. In nature, a weak Polar Vortex essentially means a breakdown of the stratospheric Polar Vortex, resulting in the spill-out of cold air from the polar regions.
While the Polar Vortex plays a significantly greater role during the Winter season, it gives us a signal to watch during Fall, as these dynamics can have a large-scale and long-lasting impact on weather patterns.
This is just one of the factors that currently suggests a high potential for weaker winter circulation due to the La Niña. For a more in-depth analysis, you can read our latest article: A Surprise La Niña Return ahead of Winter 2025/2026, bringing seasonal Weather impacts
We will keep tracking the latest global weather patterns and forecasts, so be sure to bookmark our page to stay updated. If you found this article in the Google App (Discover), tap the ♥ or star to see more of our weather and nature coverage in your feed.