A strong Stratospheric Warming event occurred over a month ago, which has collapsed the Polar Vortex. We are now tracking large-scale pressure changes in the atmosphere following this event, with the latest forecasts indicating a surprising impact on Weather patterns over the United States and Canada lasting over April and into May.
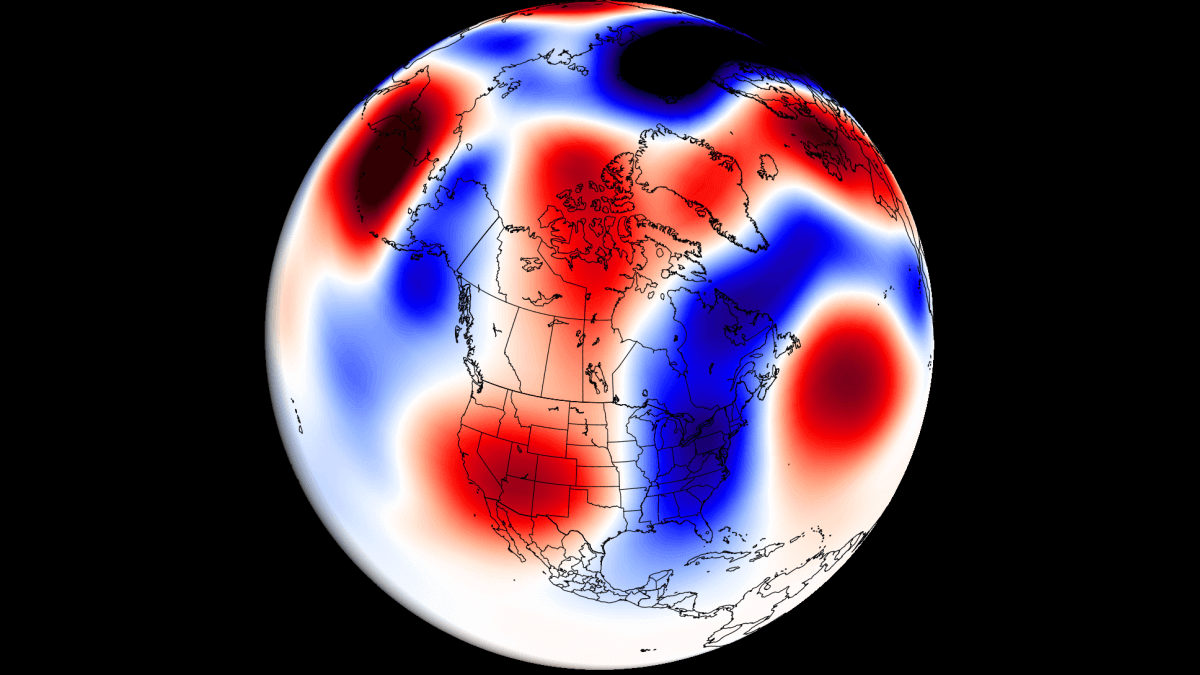
We can see large-scale pressure changes as the result of the collapse of the Polar Vortex, caused by the rapid rise in temperature and pressure in the stratosphere in early March.
The latest forecast shows a connection between the high-pressure anomaly descending from the stratosphere and connecting with the lower levels. That has an impact on the weather patterns over the polar circle and helps to shape the pressure systems over North America and the rest of the hemisphere.
THE NORTHERN POLAR VORTEX
The Polar Vortex is a name that explains the atmospheric circulation above the Northern (Southern) Hemisphere. It extends high into the middle and upper layers of the atmosphere. The lowest layer is called the troposphere, where all weather events occur. But above that, we have the stratosphere, a deeper and drier layer.
For this reason, we separate the Polar Vortex into an upper (stratospheric) and a lower (tropospheric) part. They both play their roles differently, so we monitor them separately. But, both parts together form the circulation across the Northern Hemisphere during the colder part of the year (October-March).
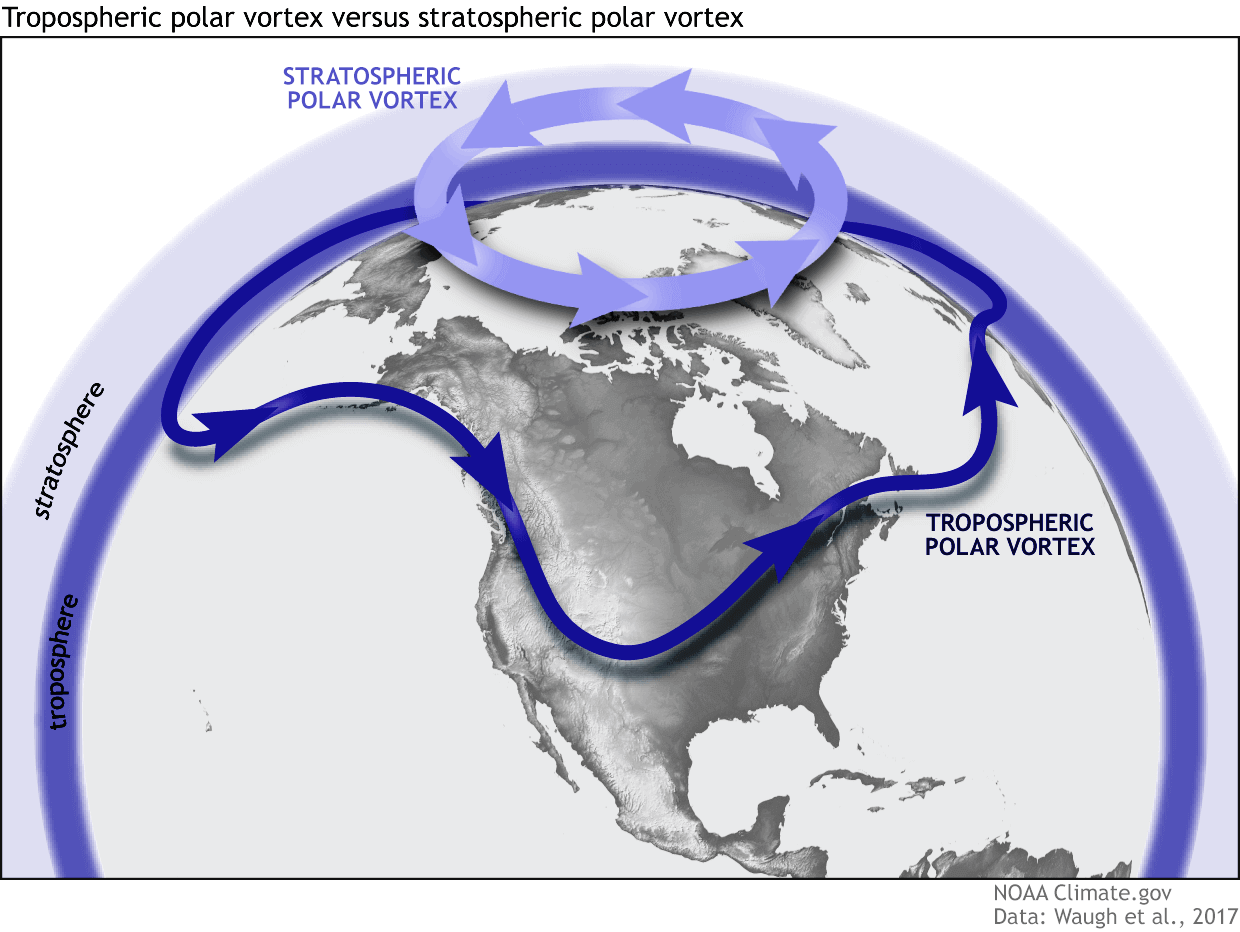
The best way to understand the Polar Vortex is to see its structure. But in simple terms, it is a name that describes the broad winter and cold weather season circulation over the northern (and southern) hemispheres.
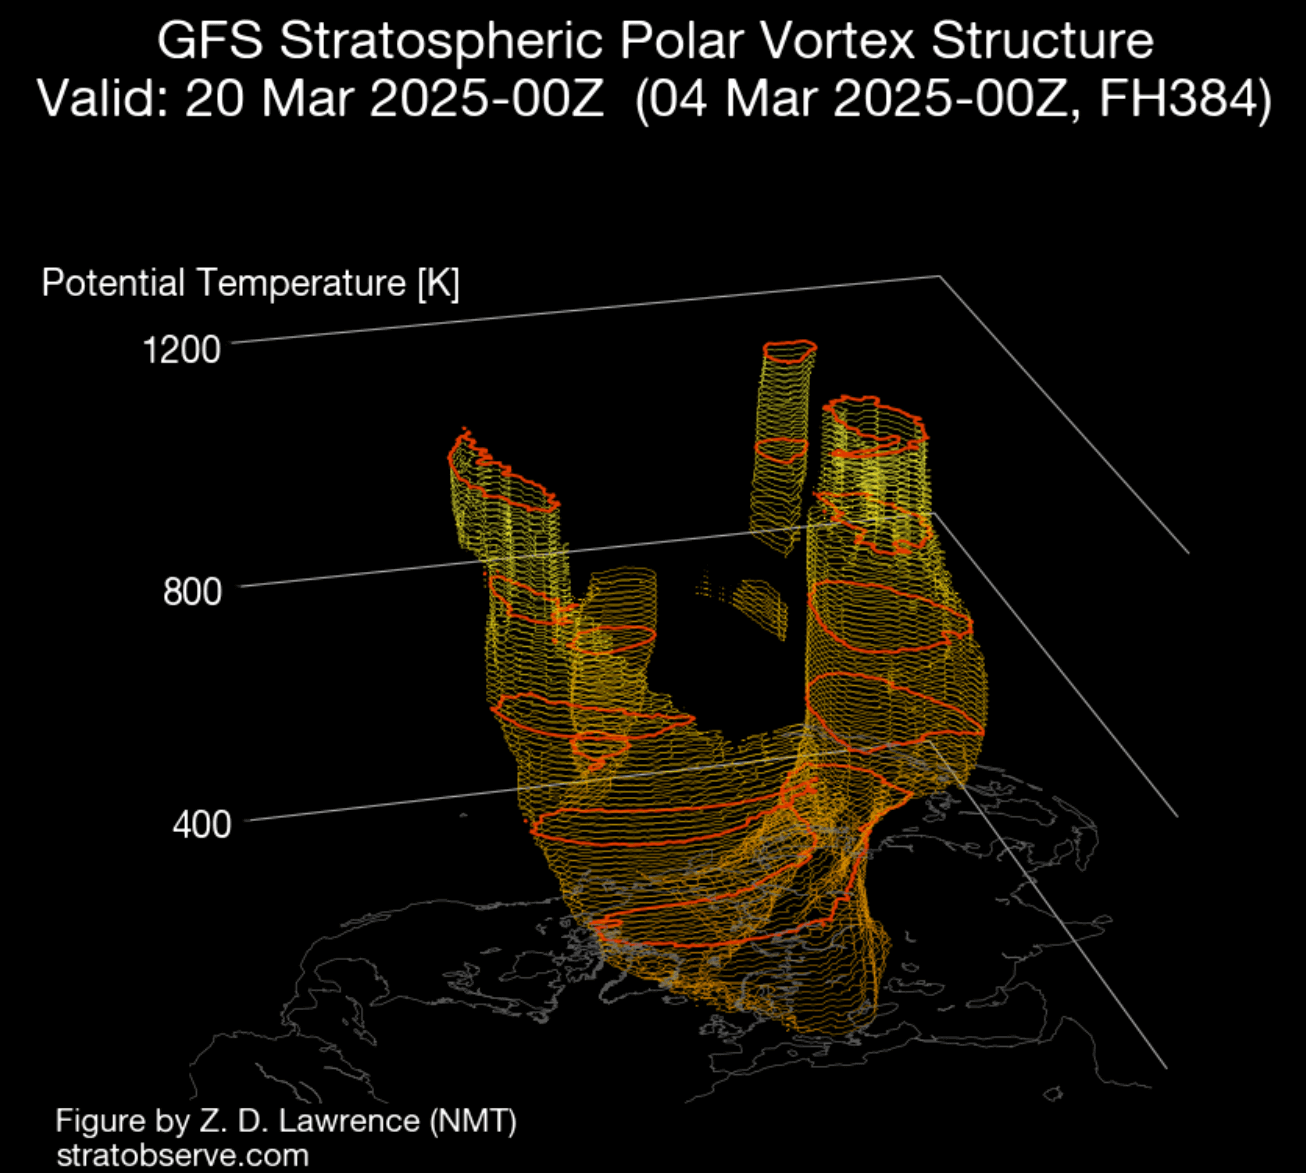
Below is a 3D image example of the Polar Vortex in late February. The vertical scale in the image is enhanced for better visual presentation. But it shows the actual structure of the Polar Vortex, and how it began to get deformed under rising pressure in the Stratosphere.
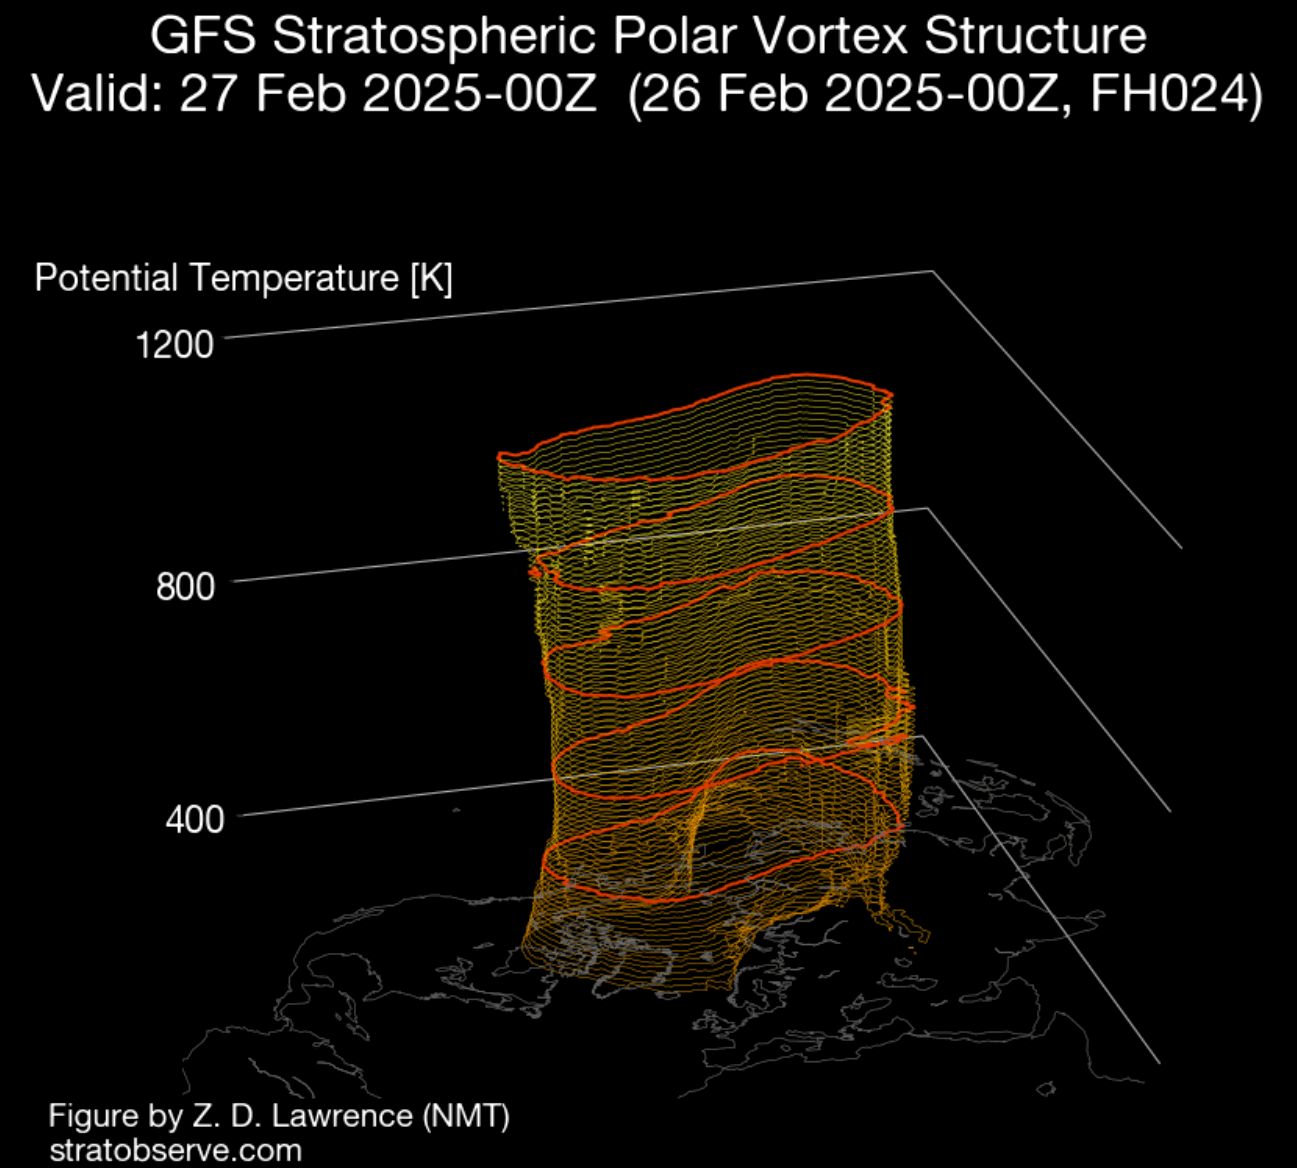
To simplify, all you need to know is that the upper and lower parts of the Polar Vortex are connected. Changes in the upper part can significantly impact the weather anomalies in the lower parts of the atmosphere and the weather at the surface.
So, in the end, the main takeaway should be that the Polar Vortex is the entire weather circulation over the Northern Hemisphere and not just one cold/storm event over the Midwest or the northeastern United States.
STRATOSPHERIC WARMING 2025
In mid-March, around a month ago, a Sudden Stratospheric Warming event (SSW) unfolded. As the name suggests, an SSW event is a rapid rise in pressure and temperature in the stratosphere. If strong enough, this event can collapse the Polar Vortex circulation, impacting the weather patterns below for the weeks ahead.
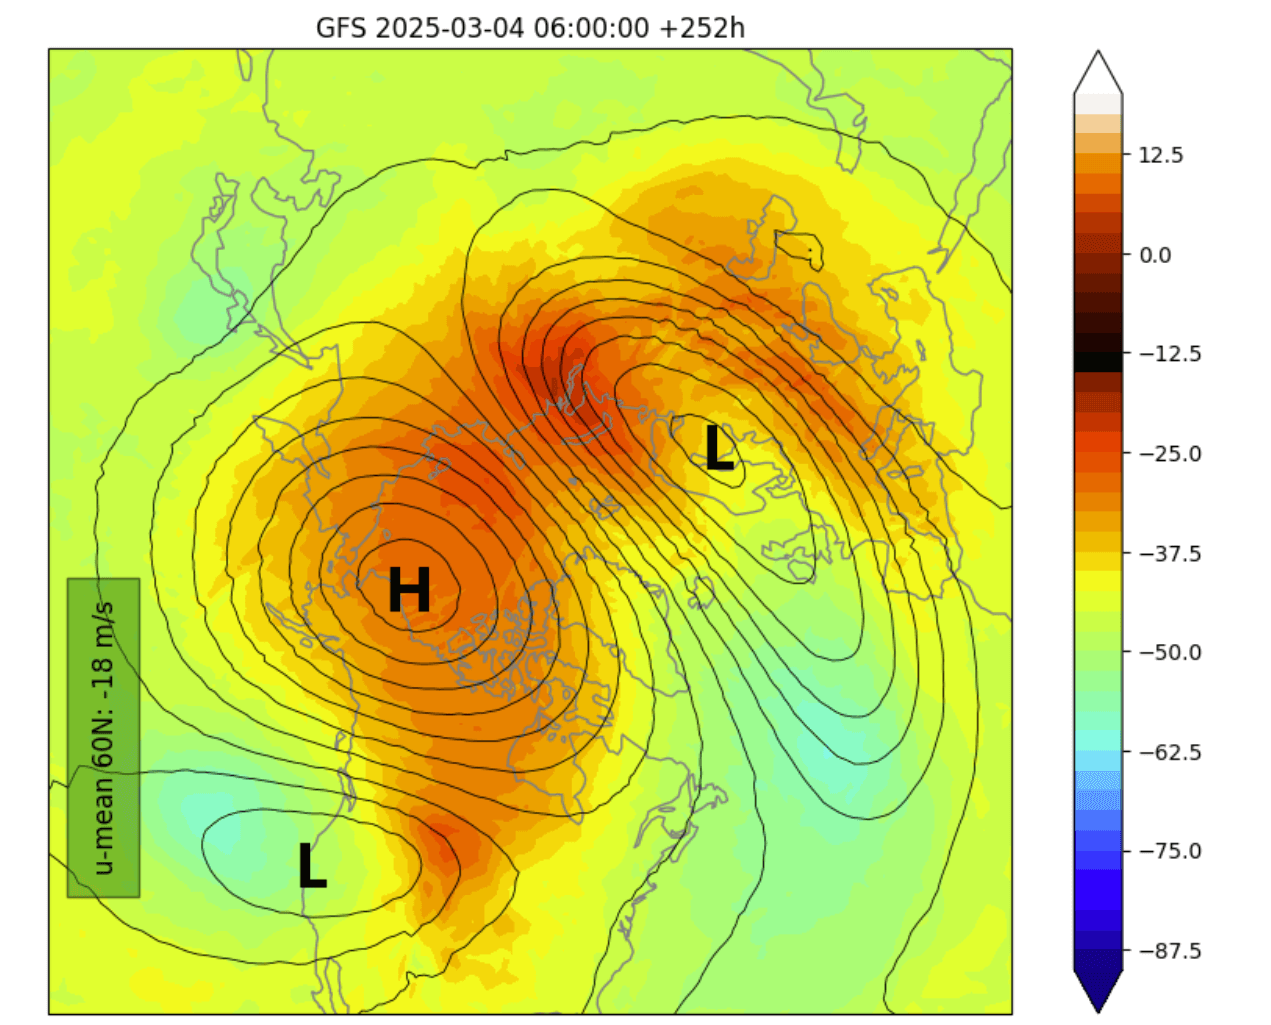
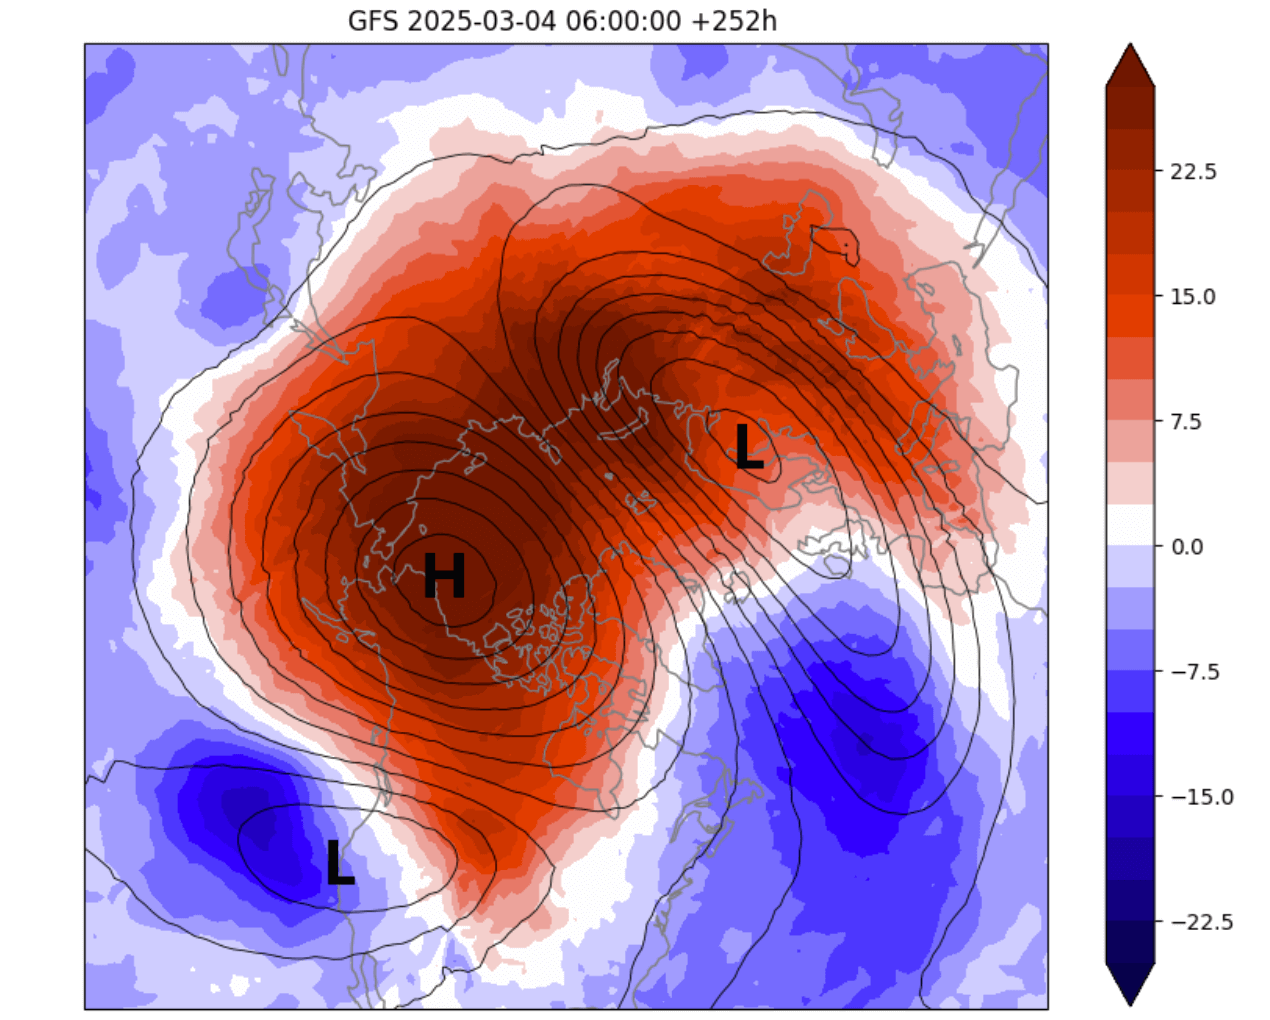
Below is the mid-stratosphere (31km/18.5miles) analysis for mid-March. It shows the stratospheric high-pressure system (H) taking over the polar regions and splitting the Polar Vortex into two cores (L). This is the stratospheric warming even at its peak, with the warming wave completely taking over the mid-stratosphere.
Below is the temperature anomaly for the mid-levels of the stratosphere at 10mb (30km/18.5miles) at the same time. You can see a strong temperature anomaly over the pole with temperatures in the stratosphere being much above the normal for this time of year, indicating a very strong SSW event was unfolding.
Such a strong, warm anomaly can only be caused by a stratospheric warming event, which was unusually strong for this time of year when compared to previous such events at this time.
You can better see the collapse and breakdown of the Polar Vortex using a 3D vertical structure analysis below. The image shows a deformed and broken shape of the Polar Vortex. You can also see a “void” in its central area, which is the presence of a high-pressure anomaly and the warming wave that was breaking apart the Polar Vortex.
For an even better visualization of what a Polar Vortex collapse looks like, we produced the video below. It shows the full 16-day sequence of the stratospheric Polar Vortex breaking down under the strength of the Stratospheric Warming event.
This brings us to the main question: How can such a strong event in the stratosphere impact the weather below? Before we look at the latest predictions for weather outcomes, we can look at what usually happens during a Polar Vortex collapse.
STRATOSPHERIC WARMING COMING DOWN
We now know that the effects from the Stratosphere have to progress downwards to have an impact. But how do these effects change the weather?
Below is a typical SSW process from a study by Dr. Amy Butler and co-authors. As an SSW occurs, it raises temperature and pressure in the Stratosphere. But, those effects progress downwards over time and reach the lower levels. The image shows the typical downward influence of a stratospheric warming event, bringing high pressure to the polar regions.
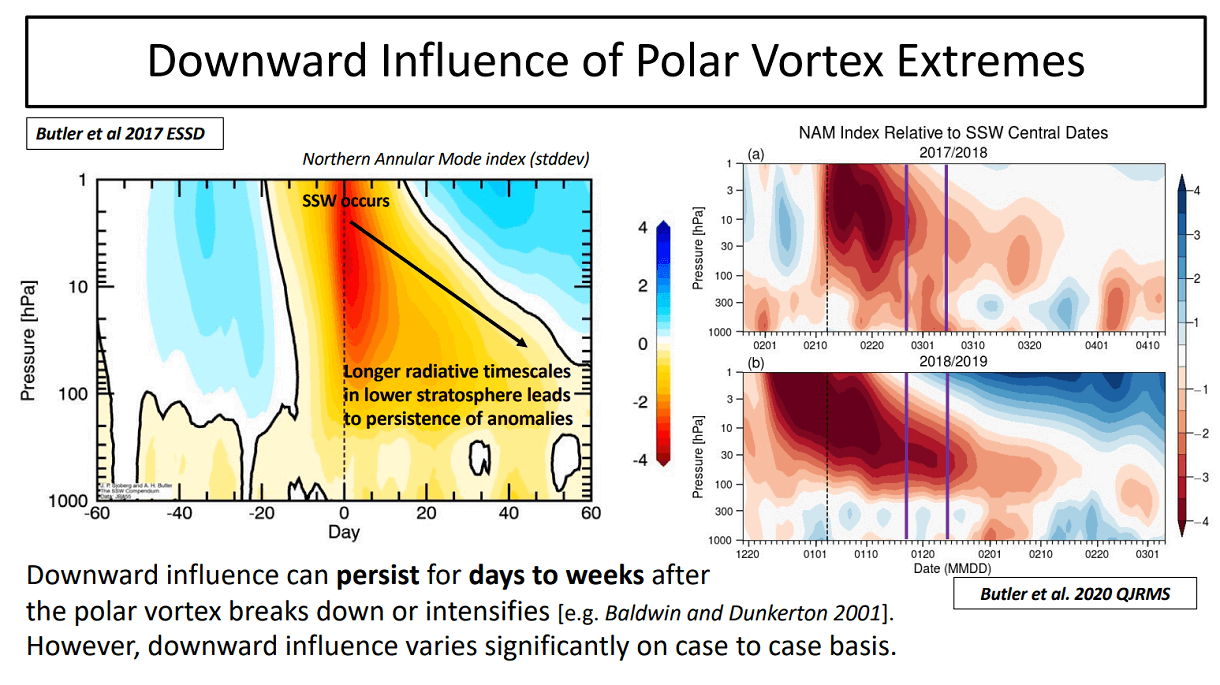
To keep it simple, the main impact after an SSW event is a high-pressure system at the surface over the north. A manifestation of a high-pressure system in the lower levels can mean a disruption of weather patterns and strong changes in the jet stream.
The best way to follow SSW effects development is to look at atmospheric changes over time. First, you can see the temperature anomaly in the atmosphere. The image below shows how the stratospheric warming event began and intensified in early March.
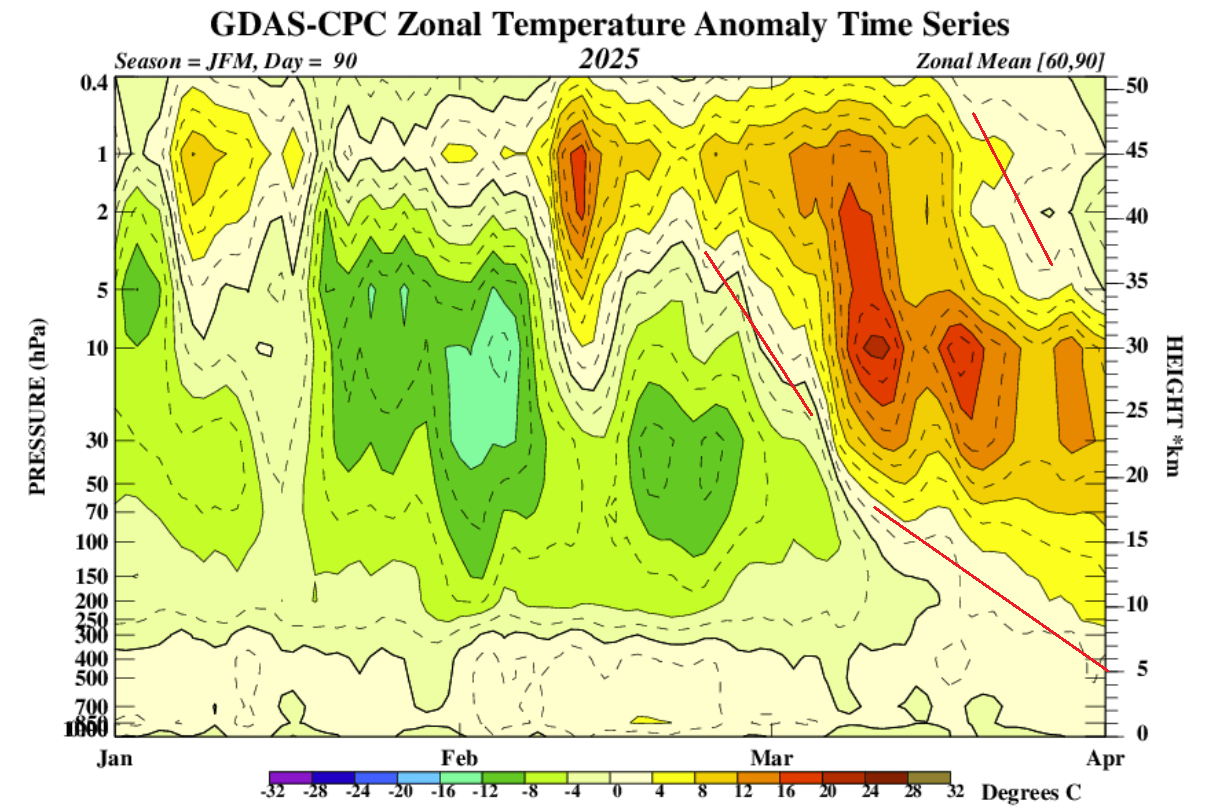
The stratospheric warming anomaly has since moved downwards, reaching into the lower layers and impacting the weather patterns.
We also have to look at pressure anomalies to see the potential connection to the weather patterns. Below is an image that shows the pressure anomalies across the atmosphere over time, similar to the example above.
Negative values indicate lower pressure (blue anomalies), and positive values indicate higher pressure (red colors). We have altitude from the ground up to the top of the Stratosphere (~46km/28mi). You can see a strong high-pressure anomaly in the stratosphere from early March all the way into mid-April.
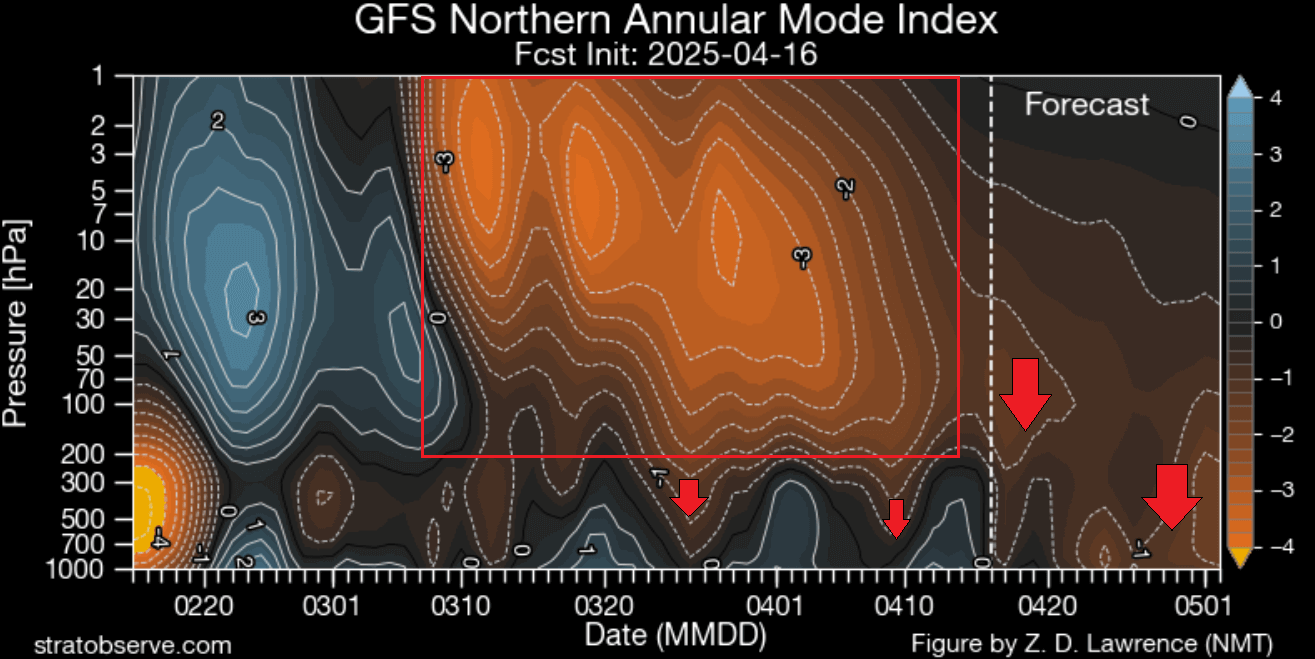
The forecast part of the graphic also shows a downward connection of the high-pressure anomaly in the rest of April and early May, connecting into the layer with the weather patterns.
This shows the textbook downward progress of a high-pressure anomaly after a stratospheric warming event.
It shows a potential direct connection between the two levels in the second half of April and potentially even in early May.
DOWN FROM THE STRATOSPHERE
First, we will look at the pressure anomalies across the atmosphere. Below is the day 2 forecast, which shows the pressure anomalies from the surface up to the top of the Stratosphere. You can see a high-pressure anomaly connected to the lower level around the North Atlantic and towards east..
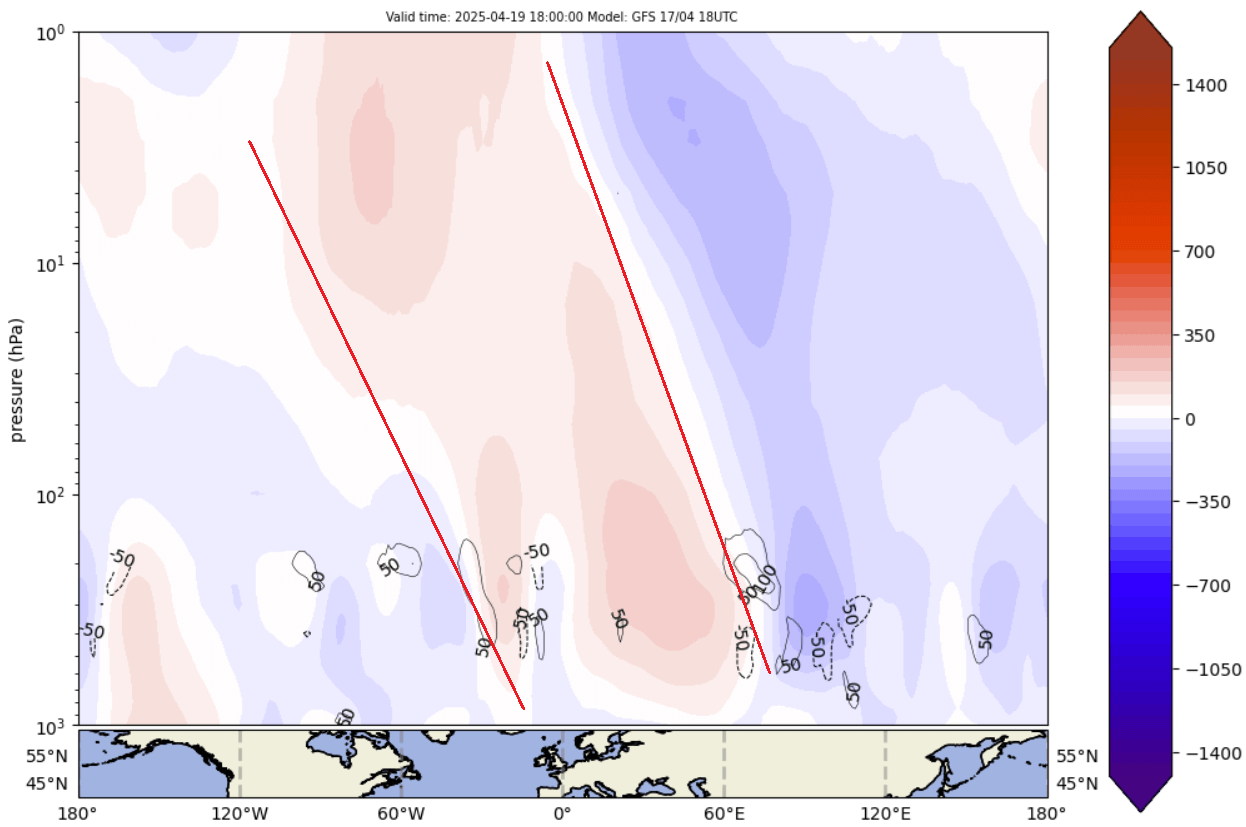
This high-pressure anomaly in the stratosphere is the remnant of the stratospheric warming event. But you can also see a low-pressure anomaly centered over the United States and Canada that will bring a different weather pattern to North America.
This usually happens because the high-pressure area blocks the polar regions. That can act like a disturbance in the pattern, creating a more disrupted pattern with many “waves” of high/low pressure anomalies.
Below is the latest pressure anomaly analysis. You can see a high-pressure tendency over the polar regions, with stronger ridges over the North Pacific and North Atlantic. Overall, you can see a quite dynamic pattern, with strong pairs of pressure waves.
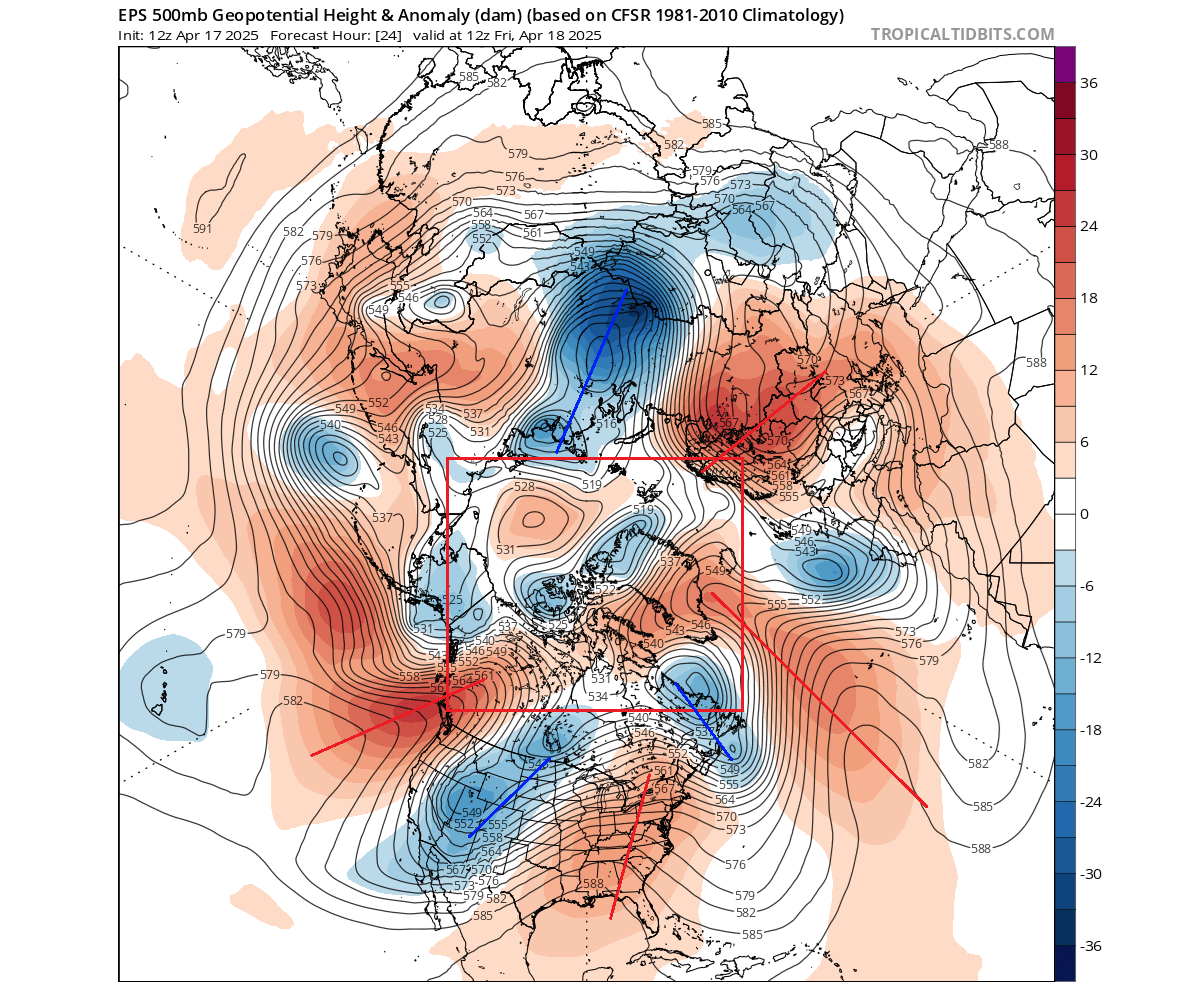
The low-pressure systems are more dispersed, with a major low-pressure pair over the western United States and eastern Canada. This will create a dynamic temperature pattern over the United States and Canada.
Looking at the temperature anomaly for the next 5 days, you can see a colder than normal airmass over the southern and western Canada and the whole western half of the United States. At the same time, a much warmer than normal airmass will spread into the eastern United States on the southerly flow.
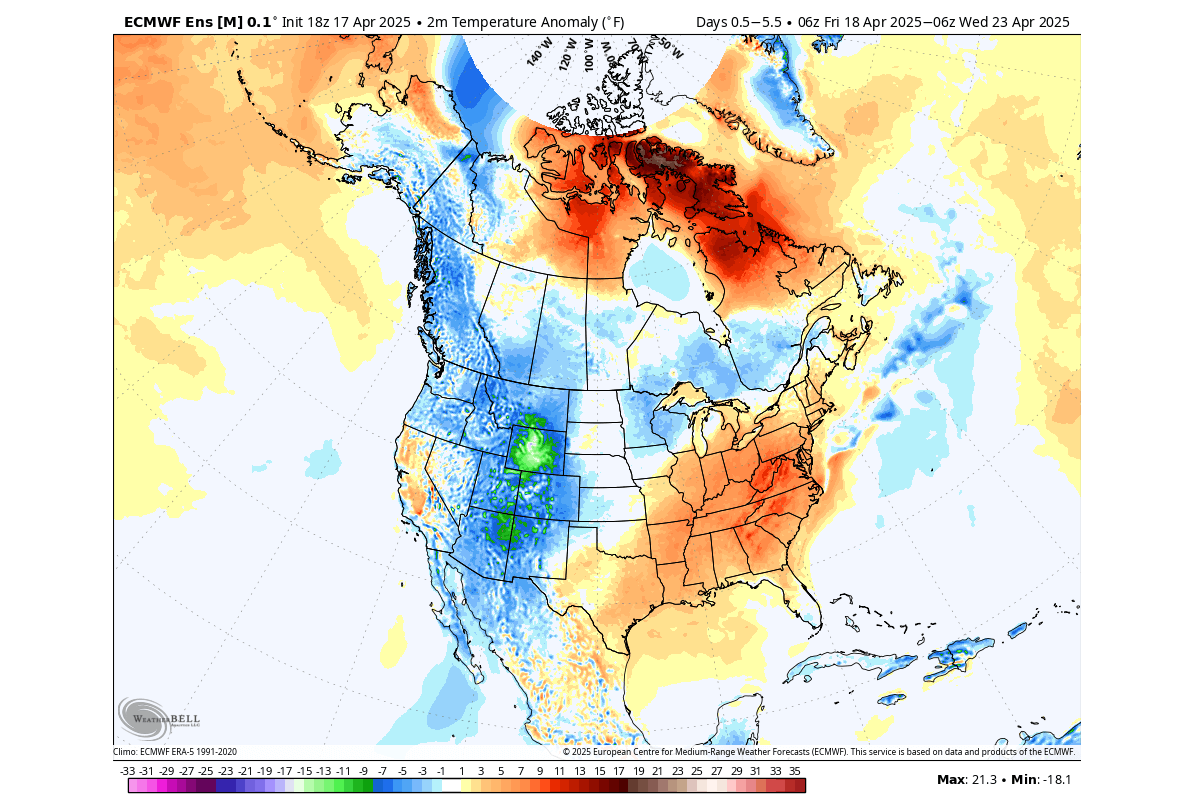
Below is the surface temperature anomaly for Friday-Saturday, and you can see most of the eastern United States and the Deep South are forecast to be warmer than normal. This is because a low-pressure system spins counter-clockwise over the west. That brings an active southerly air flow into the eastern United States and the Midwest.
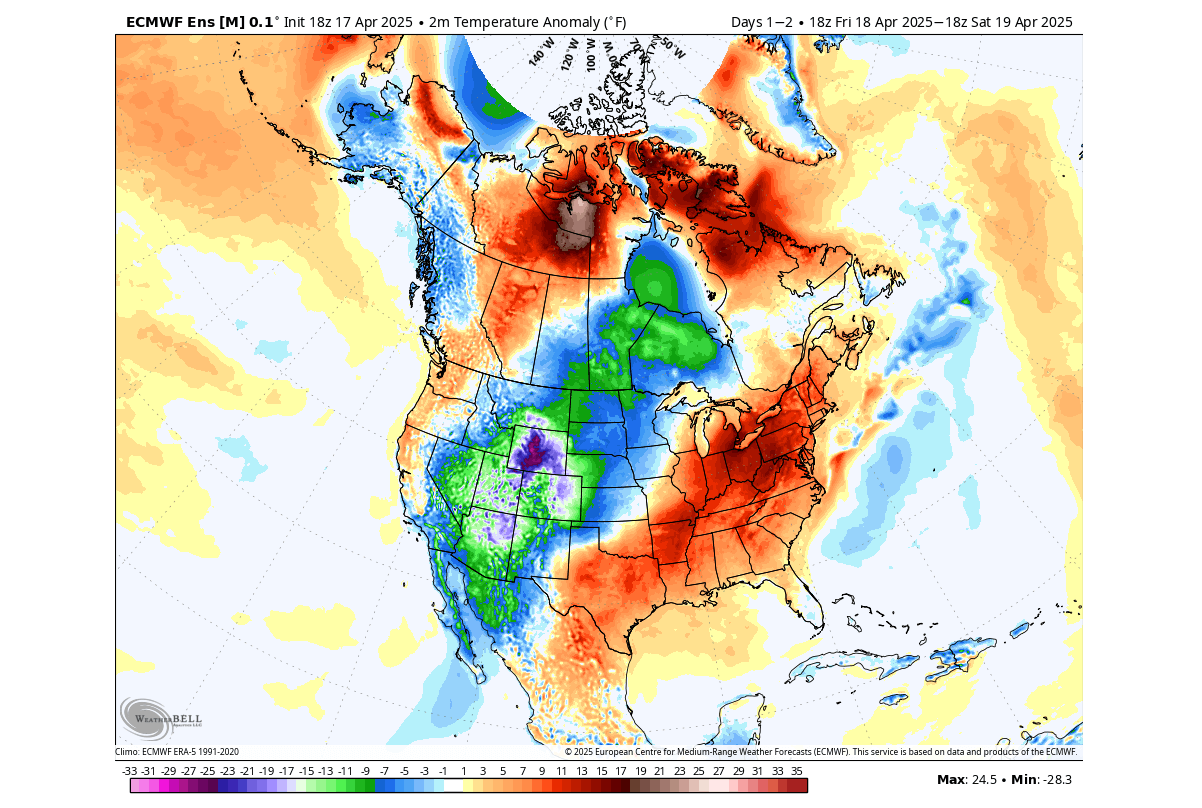
At the same time, a northerly flow is active on the rear side of a low-pressure system. That will bring unseasonably low temperatures into the western United States and south-central Canada.
You can better see the negative anomaly in the temperature forecast image below. It shows surface temperatures on Saturday morning, and you can see temperatures at or below freezing over a large part of the northern United States and parts of the west.
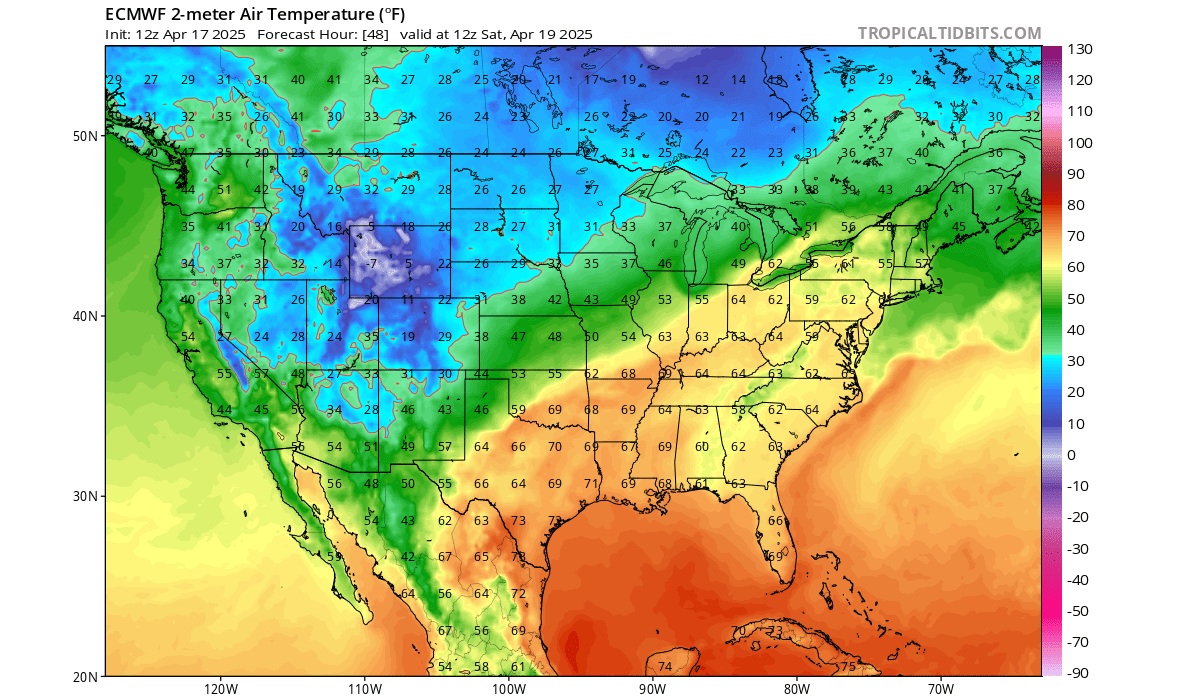
The central plains and the Great Lakes will be in the low 40s to high 30s. But the southern and eastern United States will see above-average temperatures in the high 60s across the region, to mid-low 50s over the northeast.
These strong temperature changes and contrasts also mean a battle is going on in the atmosphere between different air masses. The 7-day precipitation anomaly forecast below shows a strong rainfall anomaly over the southern Plains and parts of the Midwest.
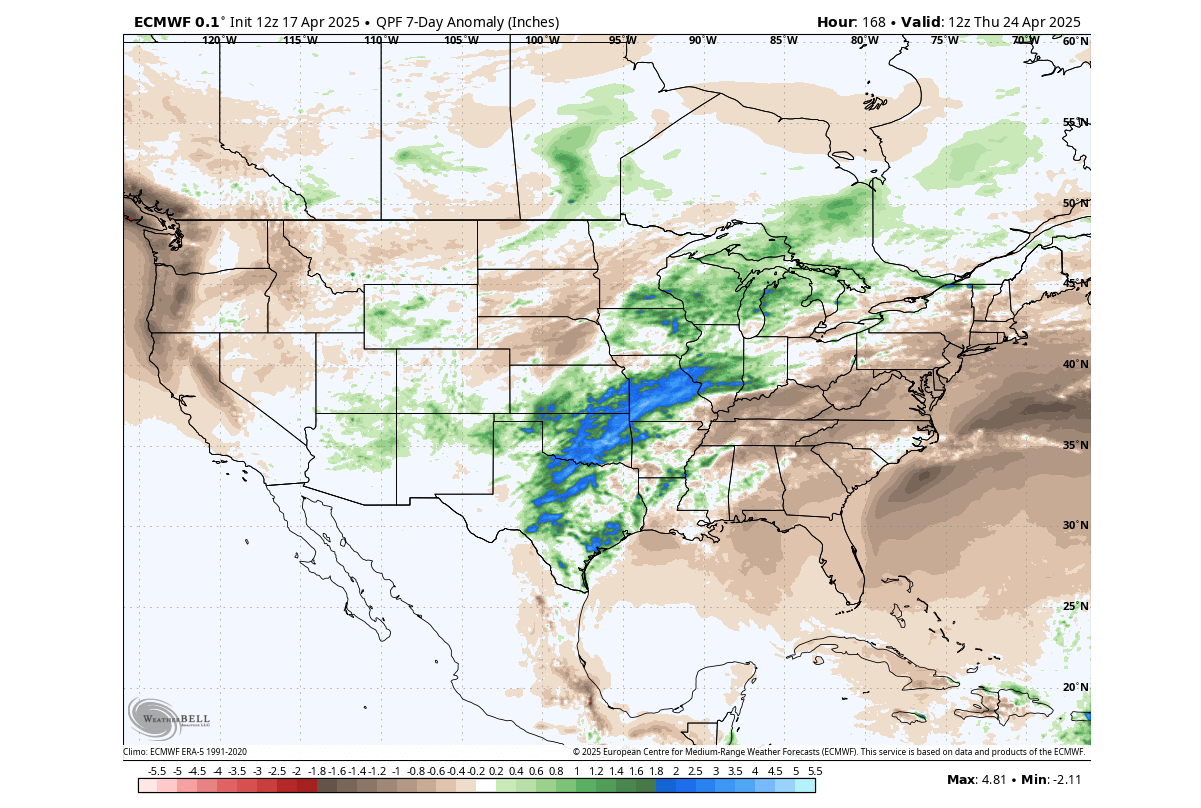
This shows a high potential for storms across the southern plains, at the edge between the colder and warmer air, supported by the strong atmospheric winds.
But as the pressure anomaly from the stratosphere connects deeper down, pattern changes are still visible going into late April.
MID-SPRING WEATHER PATTERNS
Below is the latest pressure anomaly forecast for late April in 10-15 days from now. You can see the strong high-pressure anomaly over Greenland and the polar regions. This looks very similar to many post-stratospheric warming events, where the high-pressure anomaly builds over the polar circle. Another major area of high pressure is forecast over the United States and southern Canada.
You can also see the low-pressure areas circling around the blocked polar regions. If this were mid-winter, we could see a stronger cold air outbreak over the United States. But one of the low-pressure systems over eastern Canada will have a local impact on the northeastern United States.
Below is the 5-day surface temperature anomaly forecast for April 27th to May 2nd. You can see the United States and southern Canada under the influence of a broad high-pressure zone, bringing much warmer-than-normal temperatures into the area.
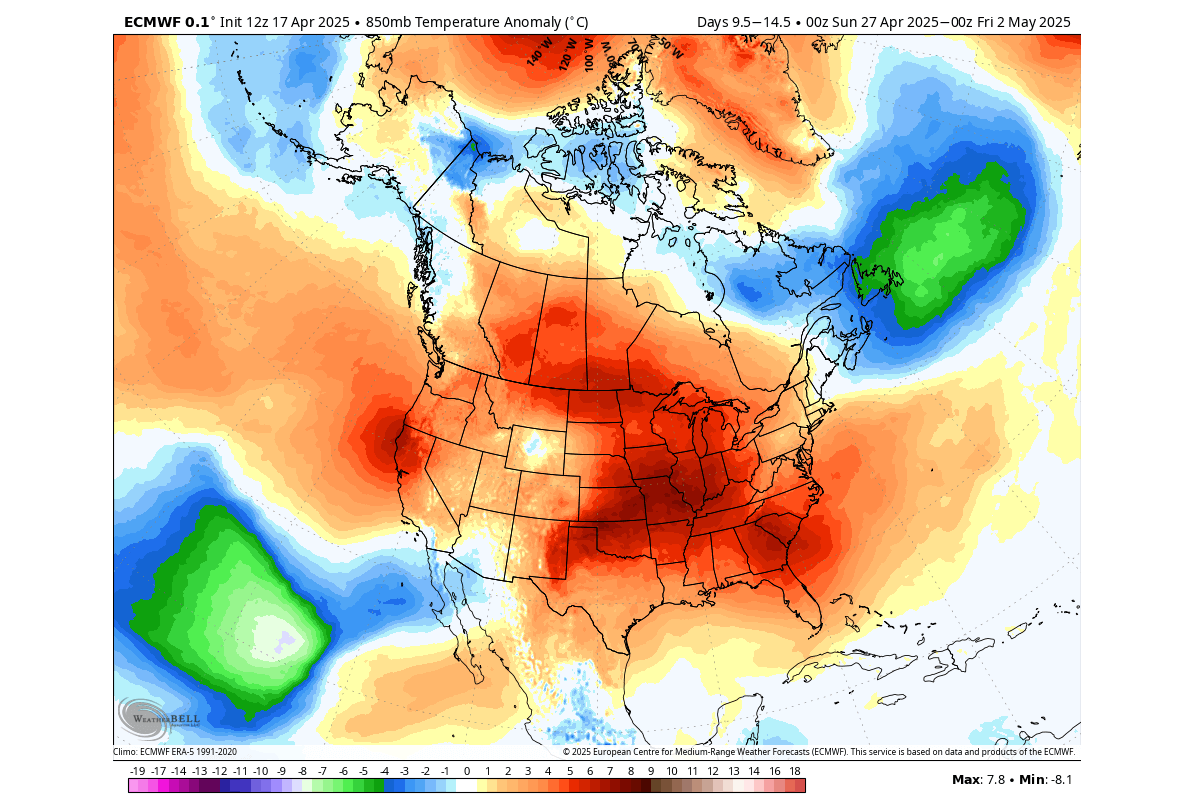
But you can see an area of below-normal temperatures over eastern Canada, associated with the low-pressure system in that region. That system is forecast to also impact the temperatures over the northeastern United States.
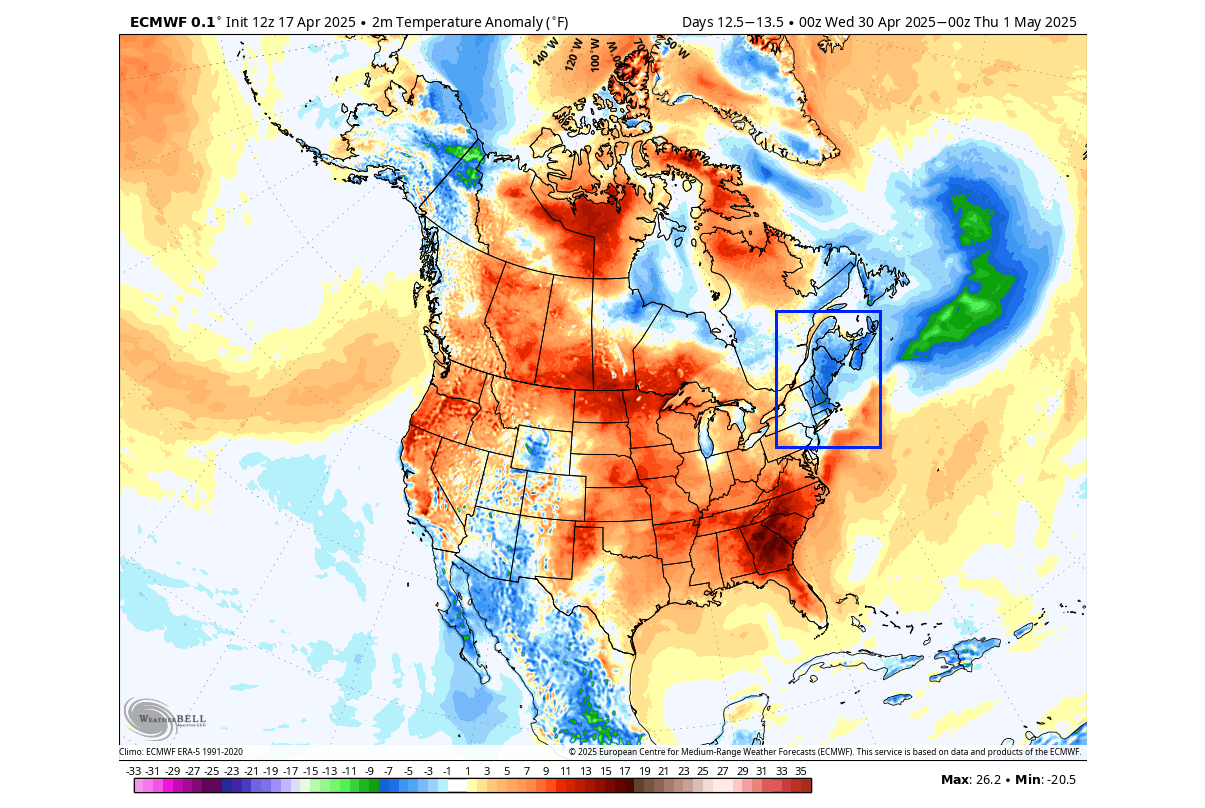
You can see this in the single-day temperature forecast for the end of April. The forecast shows much above normal temperatures over the United States and Canada. But the northeastern United States is forecast to be cooler than normal due to the northerly flow from the nearby low-pressure system.
This is an interesting pattern, as the extended range forecast does show a continuation of this pattern, and the below-normal anomalies spreading further.
But before we get into May, we still have to look at the rainfall prediction for the end of the month. Below is the ECMWF precipitation anomaly for a 5-day period at the end of April. You can see above-normal rainfall over the central and southern Plains, parts of the northern U.S., and the mid-upper Midwest.
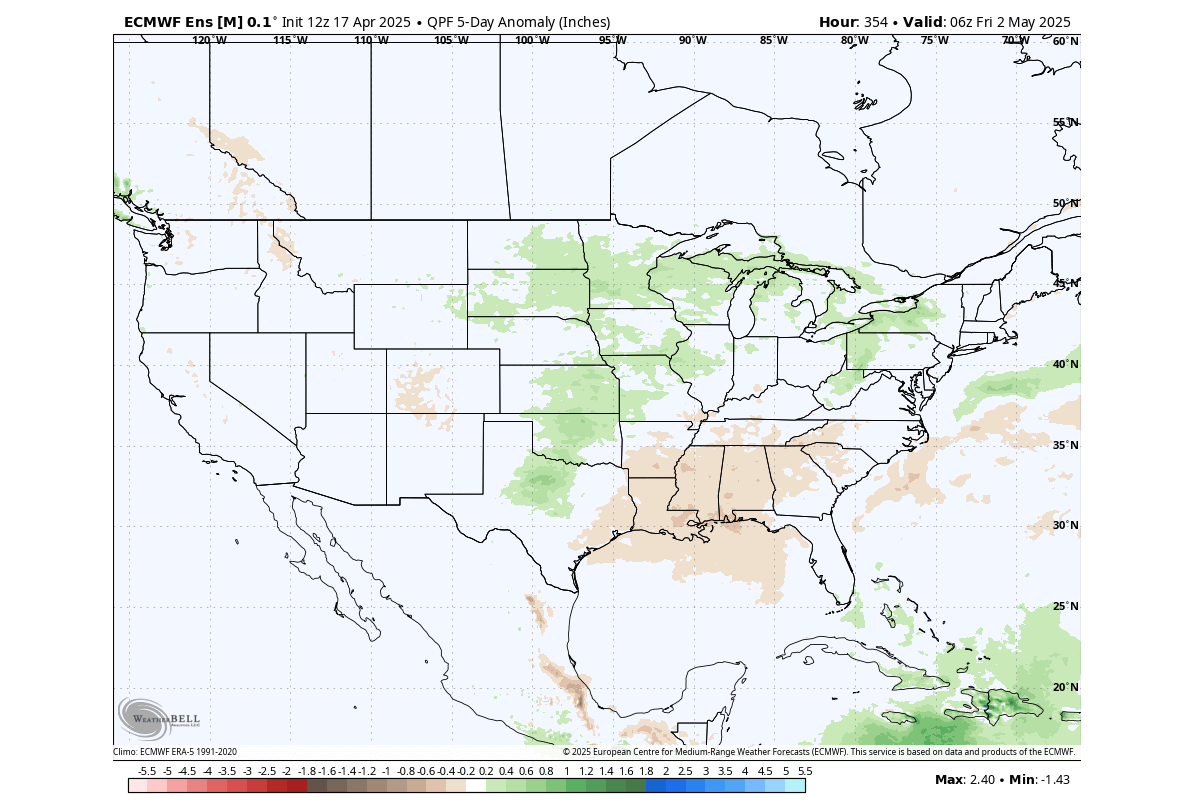
Less rainfall is forecast over the southeastern United States under a high-pressure system.
But what about the early days of May, and what do the trends show for the final Spring month?
EXTENDED RANGE FORECAST SPRING 2025
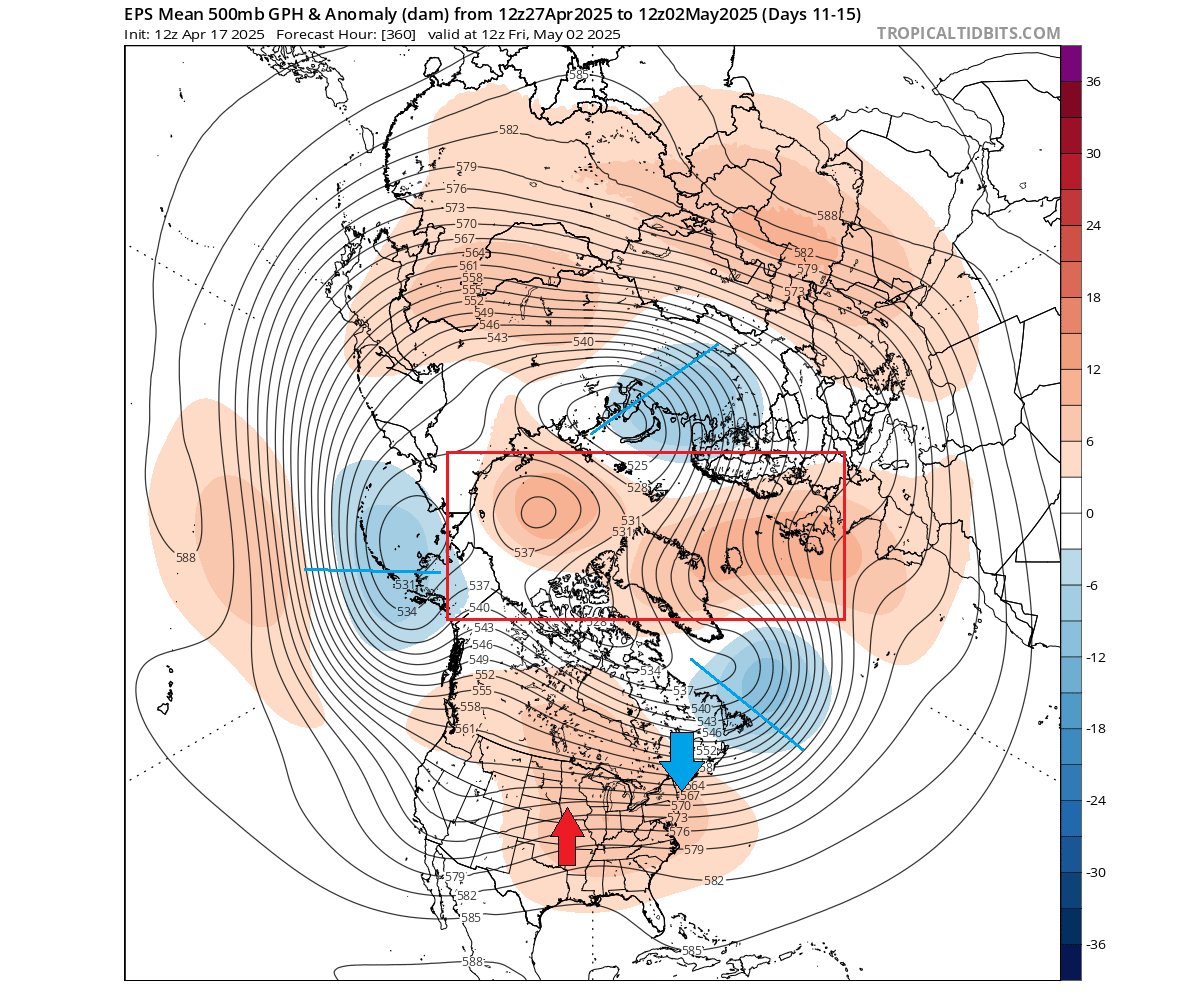
Below is the extended range pressure anomaly forecast for the first half of May, by the ECMWF model. It shows a continued high-pressure area over the polar regions. This is perhaps still a leftover from the stratospheric warming, as above we have seen a connection of the high-pressure anomalies being forecast into May.
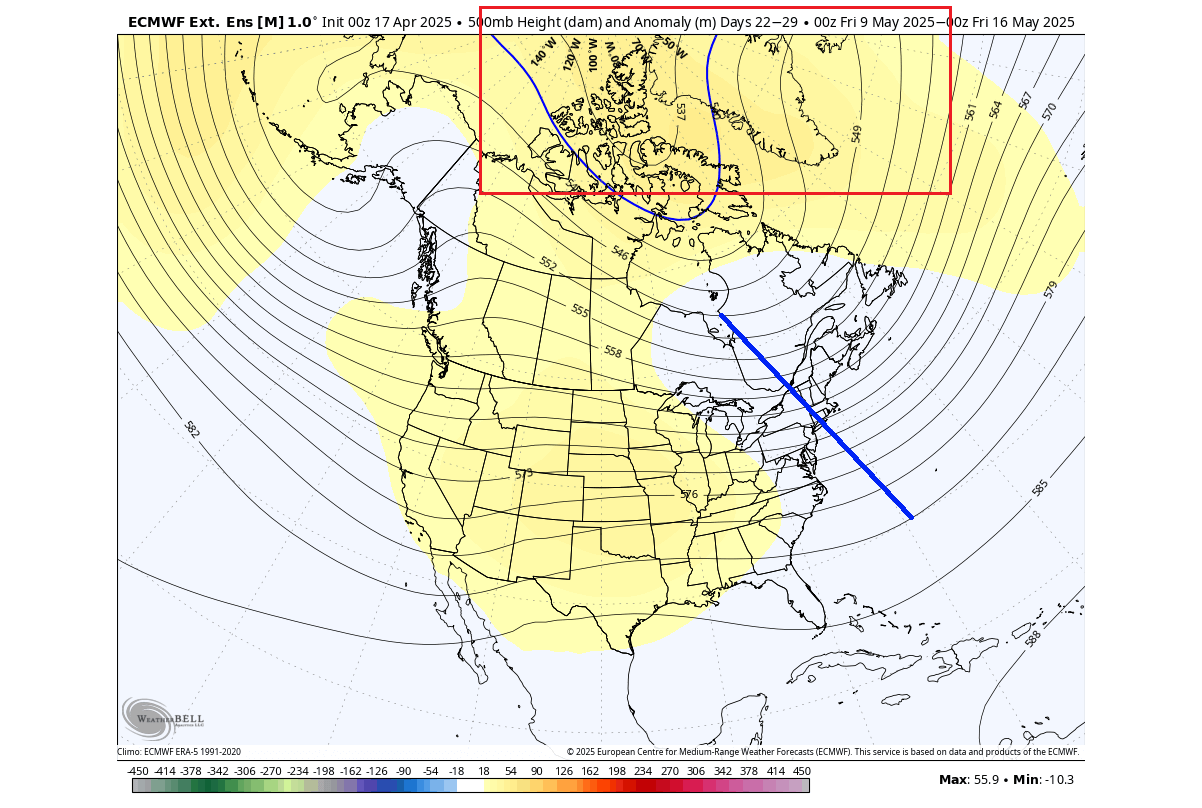
But more importantly, we can see an indication of a low-pressure zone directly over the northeastern United States and southeastern Canada.
In the extended temperature forecast below, you can see the northerly flow returning to the Midwest and the Northeast. An area of below-normal temperatures is forecast over southeastern Canada, the Midwest, the northeastern United States, and the Pacific Northwest.
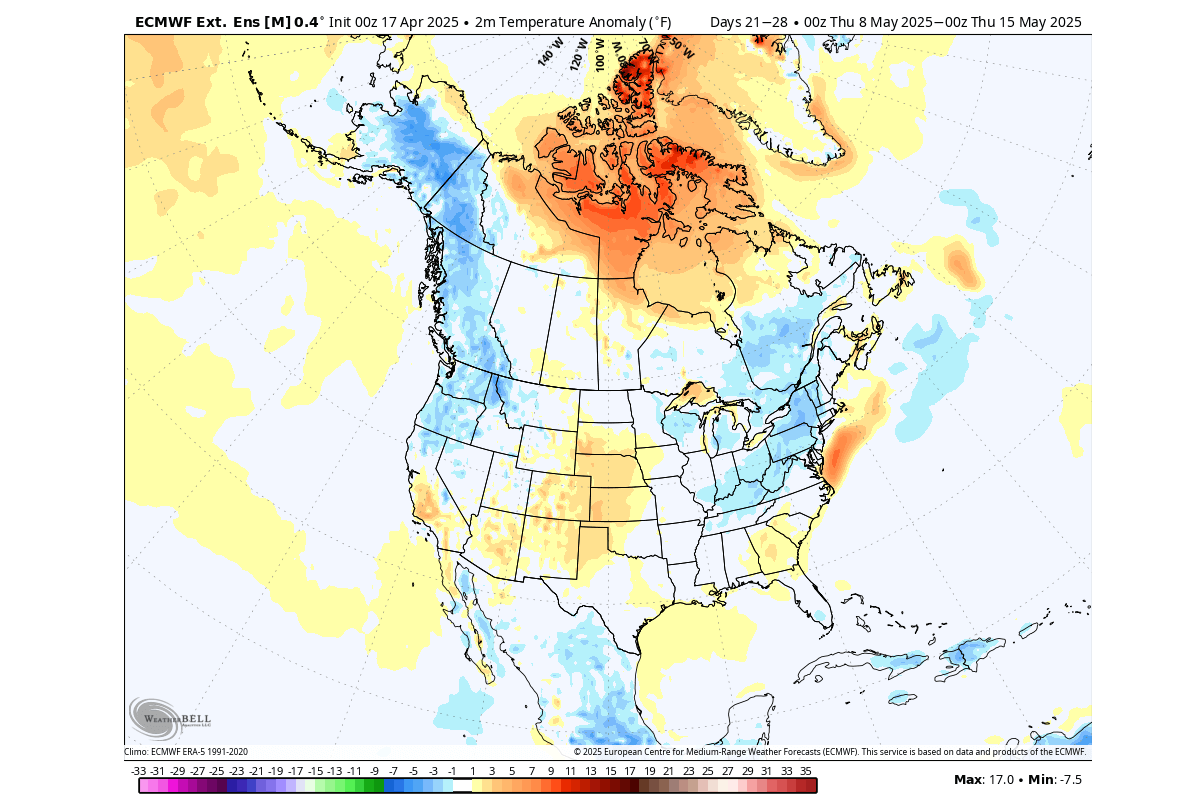
This is due to the counter-clockwise circulation of the low-pressure system over the northeast. But at the same time, a warmer air mass will advance over the western and central United States, while the northeast parts remain cooler.
Going deeper into the forecast, you can see the temperature forecast below for around the second half of May. You can still see the warm temperature anomalies inside the polar circle, indicating some form of high-pressure blocking is forecast to continue there.
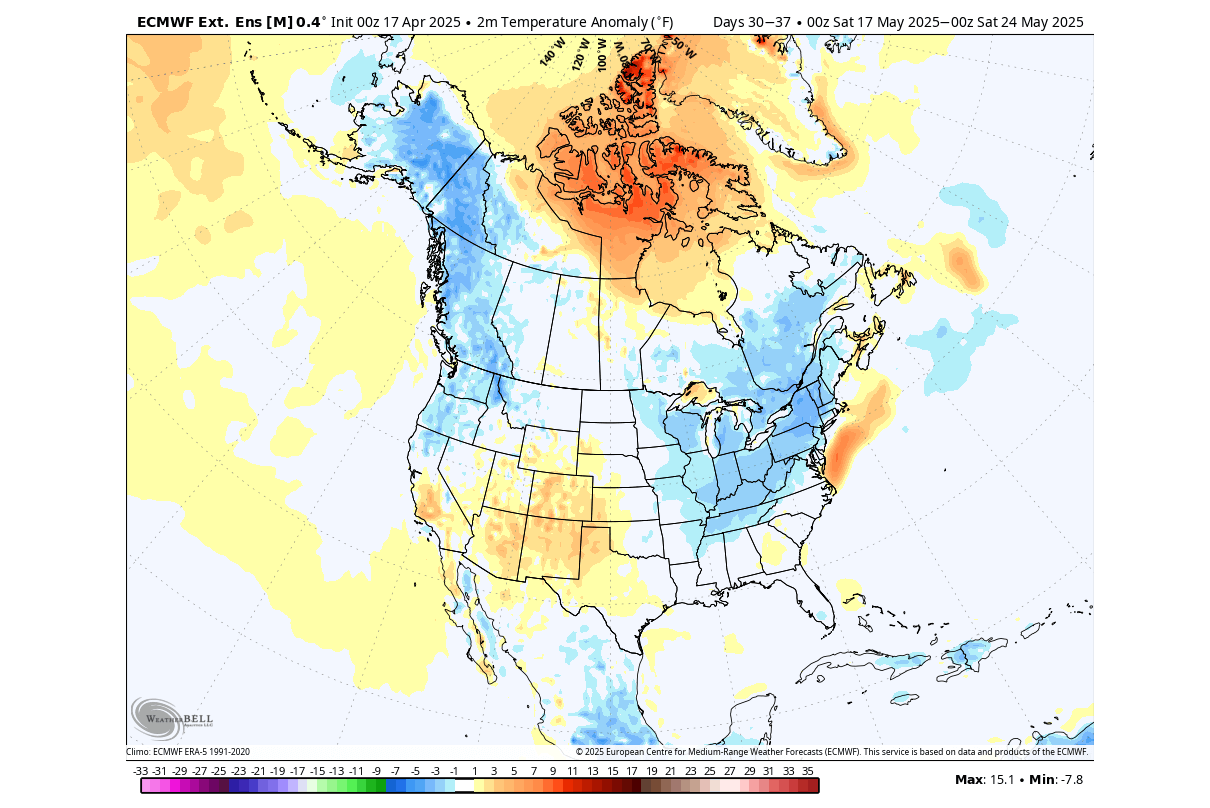
But you can also see the area of below-normal temperatures over the Midwest and the northeastern United States. This period shows an even bigger negative anomaly than we see in the forecast for the start of May.
Overall, the remnants of the Stratospheric Warming event will likely help to bring peculiar weather patterns across the United States and Canada, as we go deeper into Spring.
Forecast Graphics in the article are from WeatherBell Maps using a commercial license and Tropical Tidbits.
We will keep you updated on the global weather pattern development, so bookmark our page. Also, if you have seen this article in the Google App (Discover) feed, click the like button (♥) there to see more of our forecasts and our latest articles on weather and nature in general.
Don’t miss: Summer 2025: Early Forecast for the United States and Canada