The Winter 2025/2026 Analog-based forecast shows a high likelihood of a colder winter returning over parts of the United States, Canada, and partially also to Europe. Driven by several oceanic and atmospheric drivers, the global weather system appears to be aligning for a return of a colder old-school Winter season.
An analog forecast is when we analyze the current state of the global weather system and find several years in past decades with similar conditions. Then we can look at how the winters in those years turned out, and use them as guidance.
We are currently observing different factors that, combined, show similarities to several strong and cold Winters. You will see which are these factors, and where they helped to spread cold in the past, and as it seems, could also do again in 2025/2026.
OCEANIC COLD EVENT
On the ocean side, we have the ENSO area, which stands for “El Niño Southern Oscillation.” This is a region of the Pacific Ocean that periodically shifts between warm and cold phases. Typically, there is a phase change around every 1-3 years.
Below is the latest ocean temperature anomaly from NOAA CRW, and you can see a wave of cool anomalies in the marked tropical ENSO area. You can see that a cold phase (La Niña) is starting to develop across the tropical regions, expected to last into Winter.
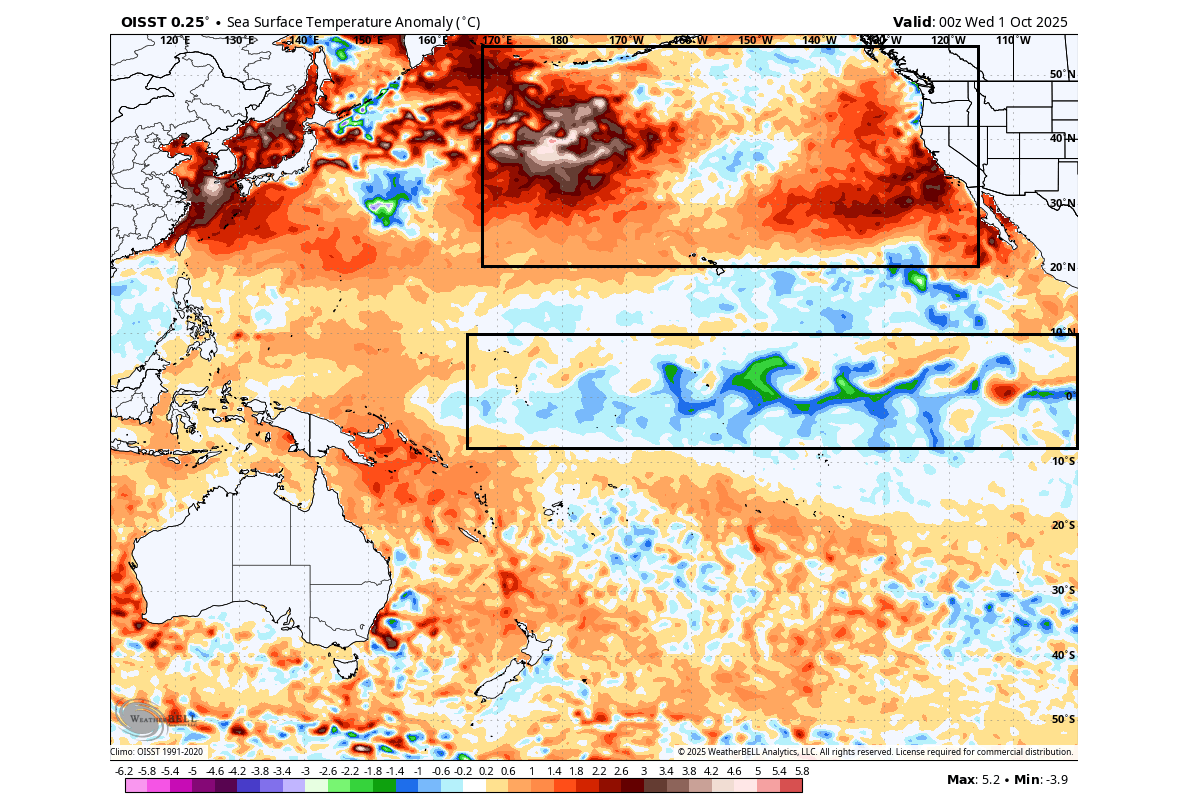
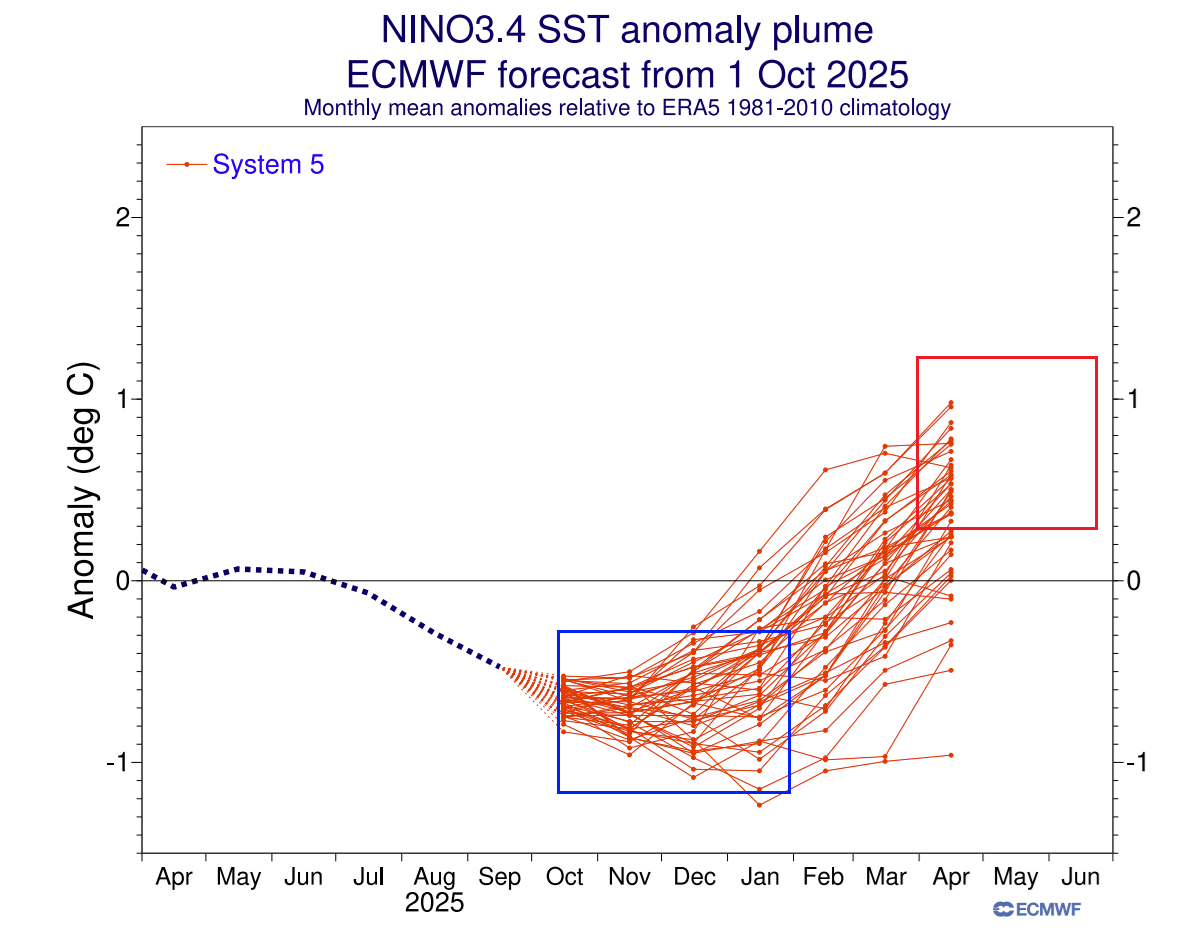
The long-range ensemble forecasts below show the forecast for the main ENSO region. The average forecast from all the calculations is within the cold phase area, with a high number of calculations well within the La Niña margin. This indicates that an active (weak) La Niña event is forecast to impact the 2025/2026 winter, with a rapid reversal to come for 2026.
As for the actual weather pattern impact of the La Niña, we usually see a strong blocking high-pressure system in the North Pacific. That usually comes in tandem with a low-pressure area over Canada, which redirects the polar jet stream down into the northern United States.
Below is a special image, which we produced from the new high-resolution reanalysis ERA5 data. It shows the temperature anomaly in all weak La Niña winters since the 1950s. You can see a strong signal for colder temperatures over western and central Canada, and also extending into the northern and eastern United States.
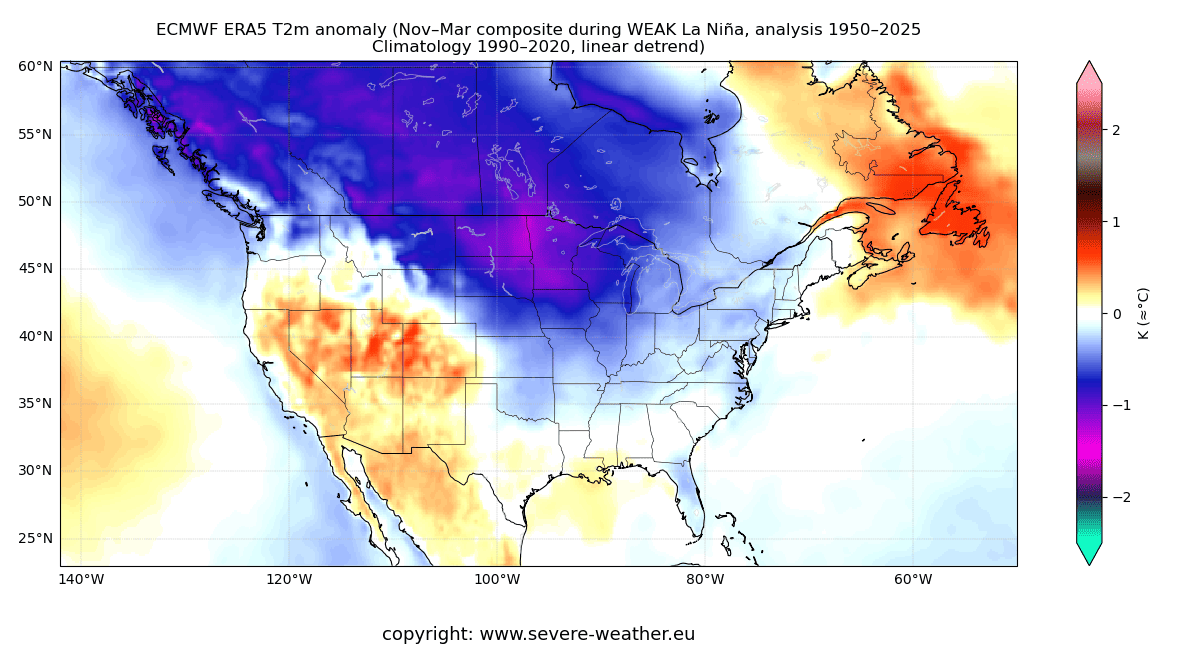
Warmer-than-normal weather and mild winter conditions typically develop over the southwestern United States and eastern Canada. There are some older winters (50s-70s) in this analysis, some of which were very cold, so that can make the overall image appear a bit colder.
Since the colder air is more readily available to the northern United States, it increases the potential for snowfall when moisture is present. In the snowfall analysis image below, you can see the average snowfall pattern for La Niña years, as expected for this Winter season.
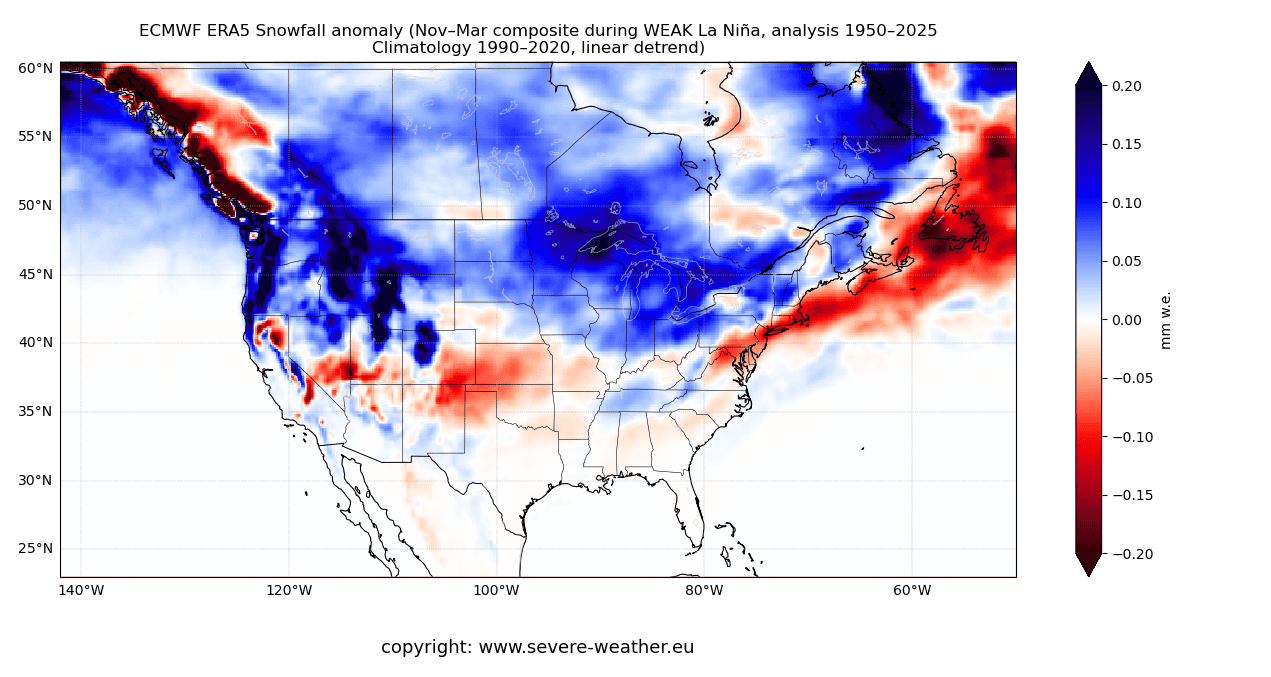
In addition to the northwestern United States and the Midwest, the northeastern United States and eastern Canada also show increased snowfall potential in such ENSO conditions, and parts of the eastern United States. This is based on the same weak La Niña years that have occurred since the 1950s.
The second factor for the upcoming Fall/Winter season is found much higher, literally in the stratosphere.
ATMOSPHERIC HEARTBEAT
Just like in the oceans, there is also a part of the atmosphere that alternates between positive and negative phases. But instead of temperatures, we are observing winds, or rather their direction. This phenomenon is known as the Quasi-Biennial Oscillation, or simply QBO.
The QBO is a regular variation of the winds high above the tropical Stratosphere, shifting between easterly and westerly (zonal) winds. Strong winds in the stratosphere travel in a belt around the planet at the equator. And around every 17 months, these winds completely change direction.
Below is the latest NASA analysis, which shows the strong easterly winds in the middle stratosphere above the equator. This is known as the easterly (or negative) QBO phase. These changes from one phase to another are so regular that the QBO has earned a nickname, “atmospheric heartbeat.”
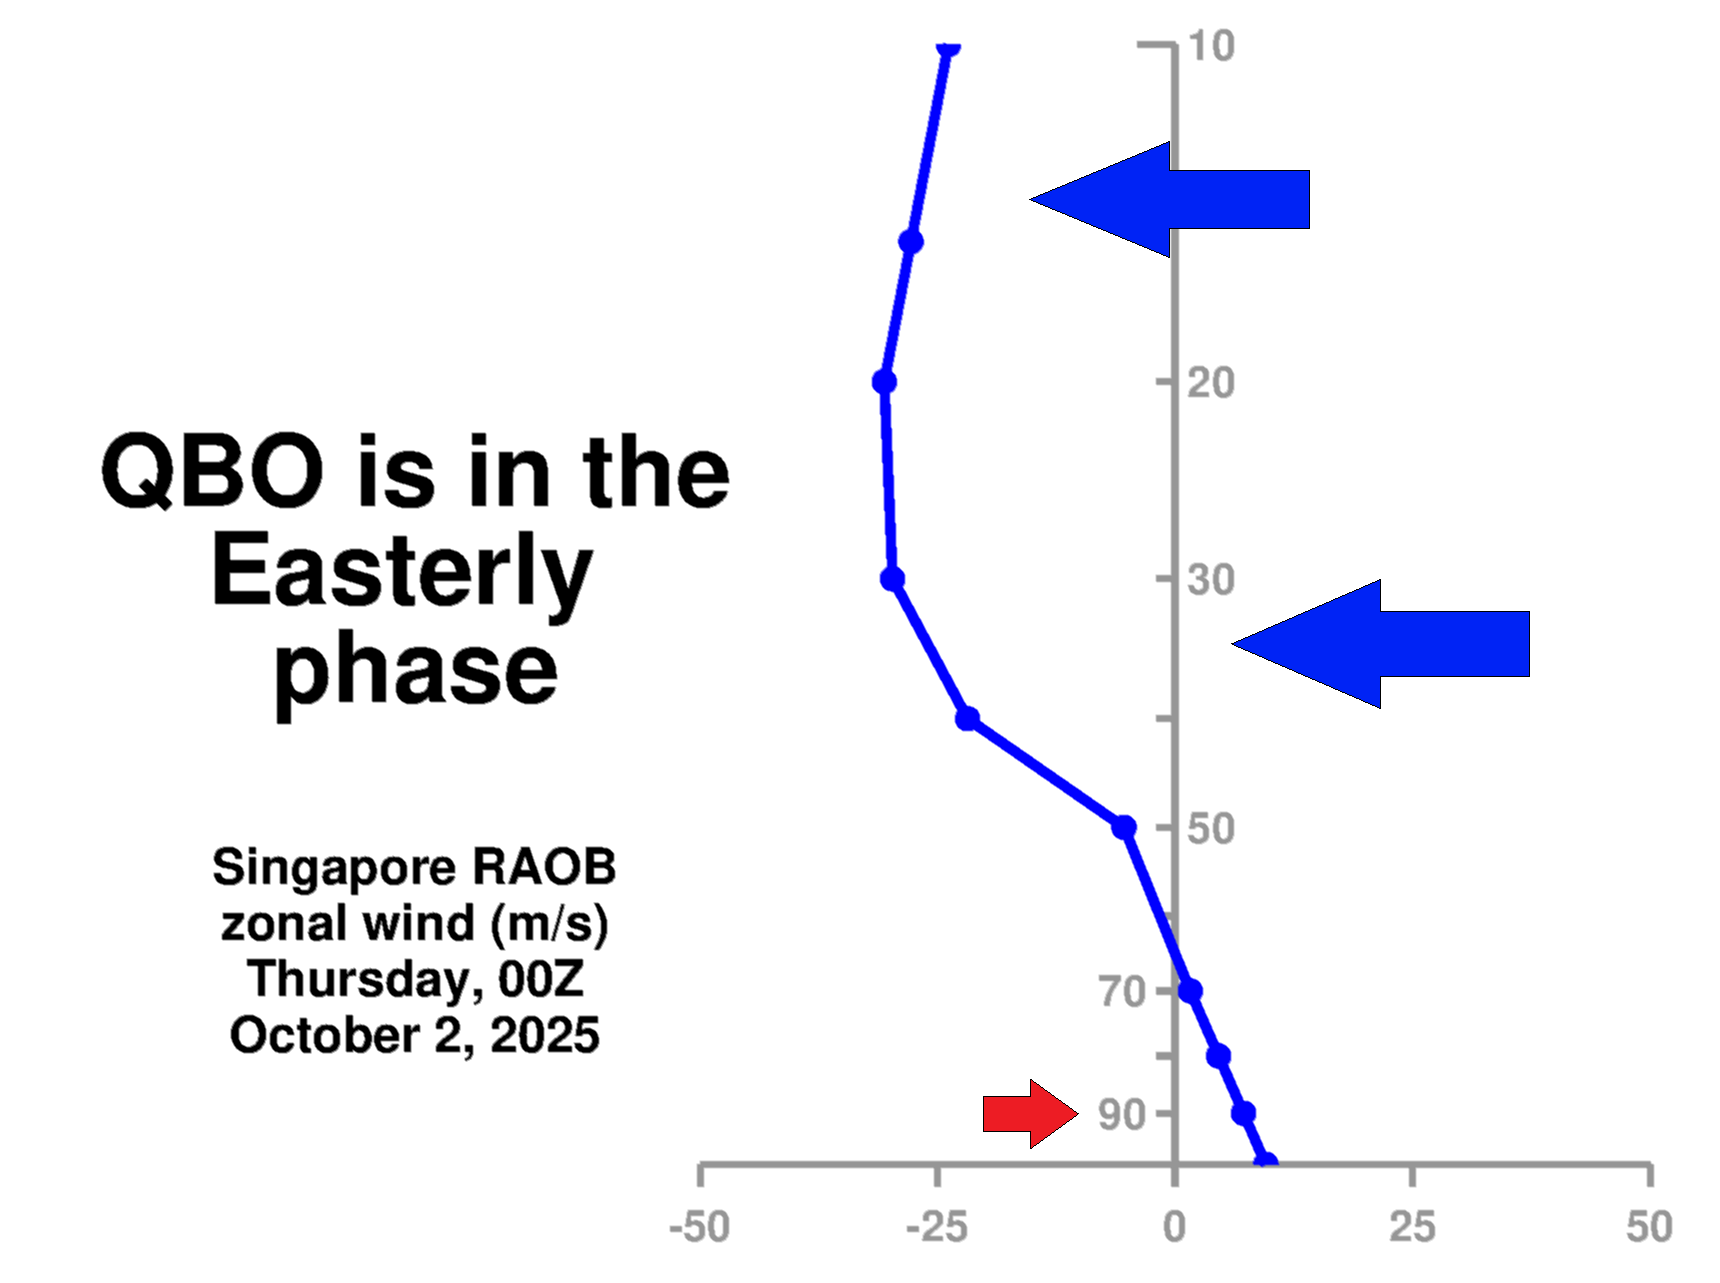
If we look more closely at the past 3 years below, you can better see how each phase descends over time through the stratosphere. A negative/easterly phase was also active in 2023/2024. It was followed by another positive QBO phase last winter. Currently, a substantial new negative phase has taken over for winter 2025/2026. The image below is from a NASA analysis.
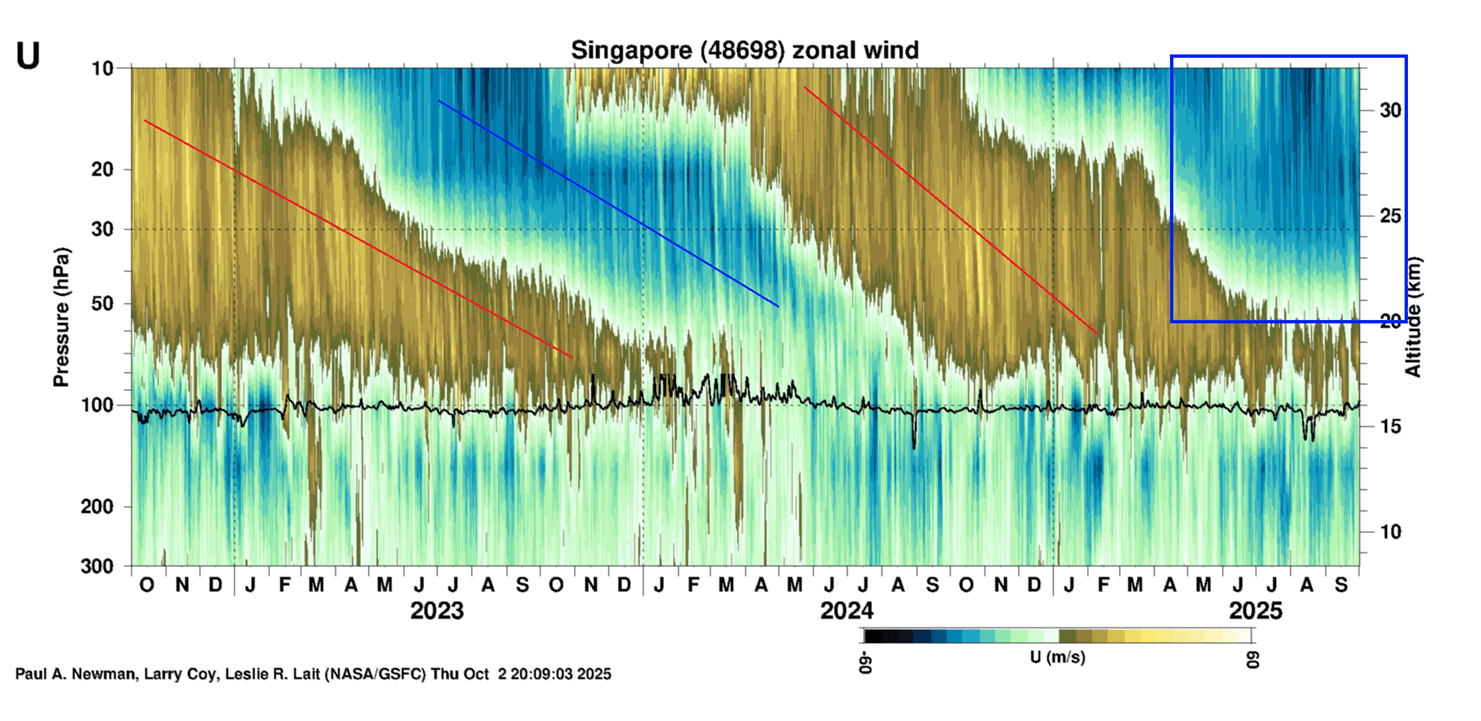
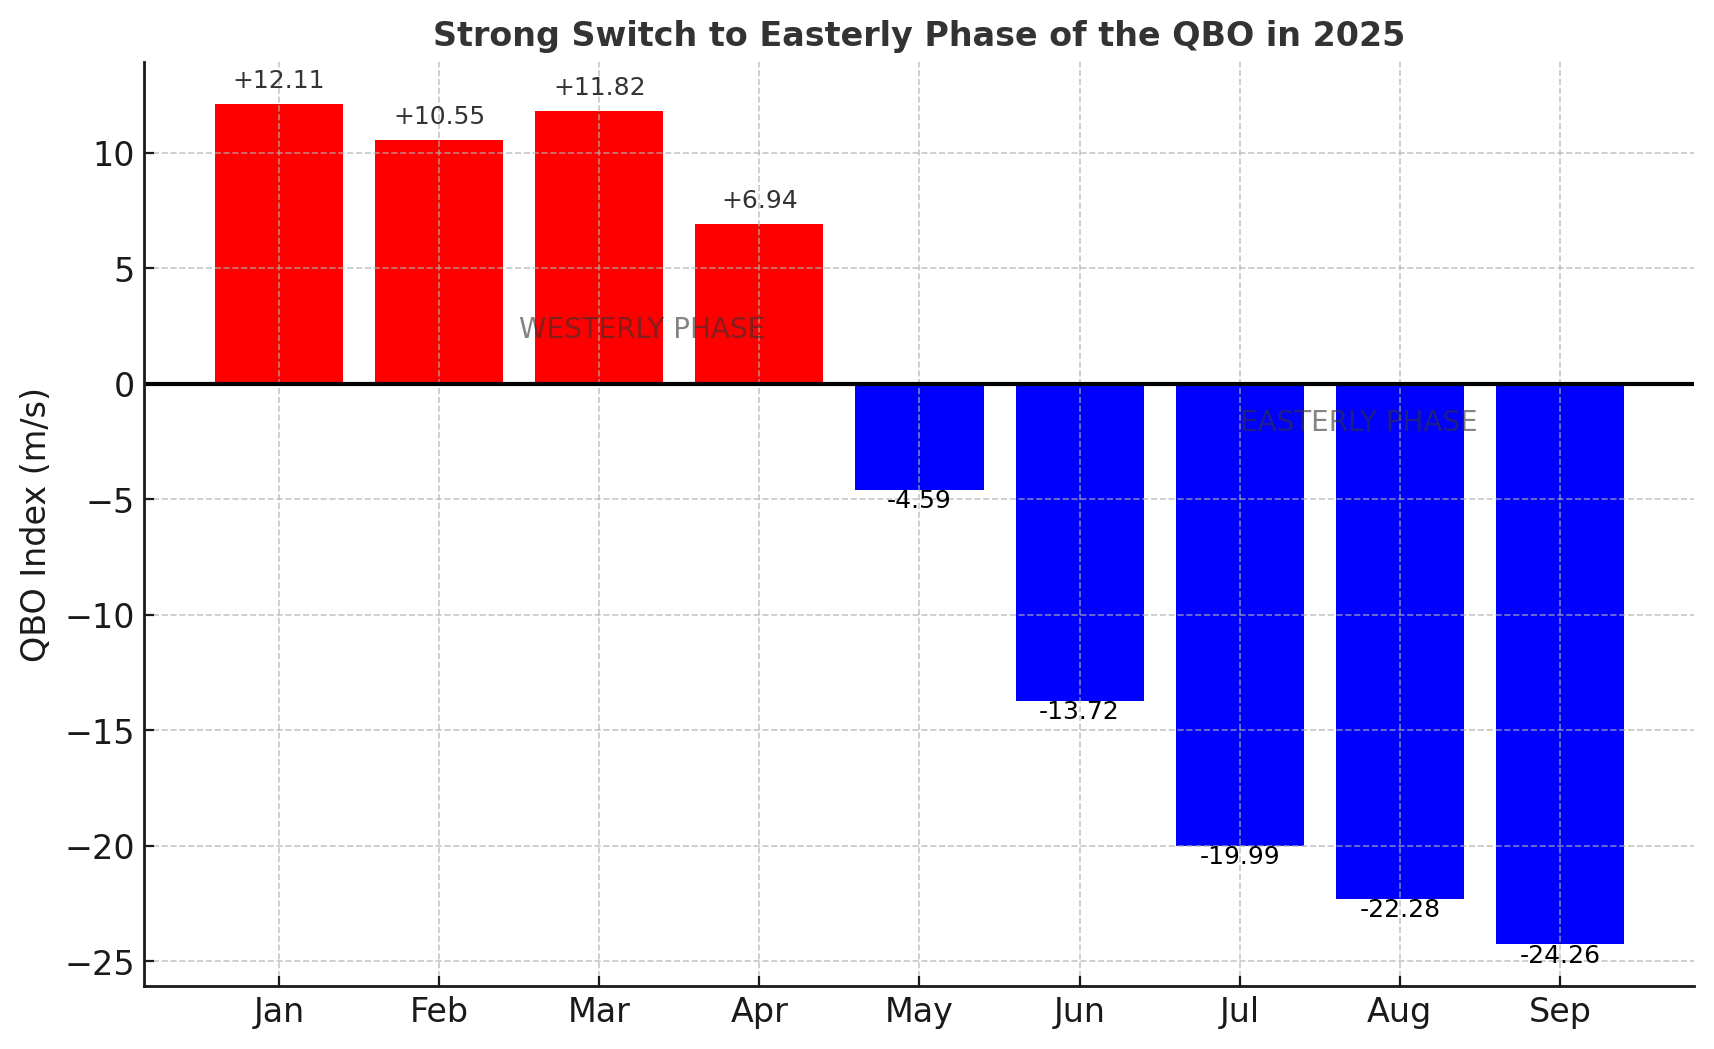
You can also see the monthly progression and reversal in the image below, courtesy of Richard Trout. The data shows a remarkably strong negative development of the QBO, starting to descend in Spring, and getting stronger each month since.
There are several reasons why and how QBO can influence our winter weather. One very important aspect is, of course, the Polar Vortex, which is why we mainly monitor the QBO on the road to winter. The image below shows the connection between the QBO and the Polar Vortex in the December-January winter period.
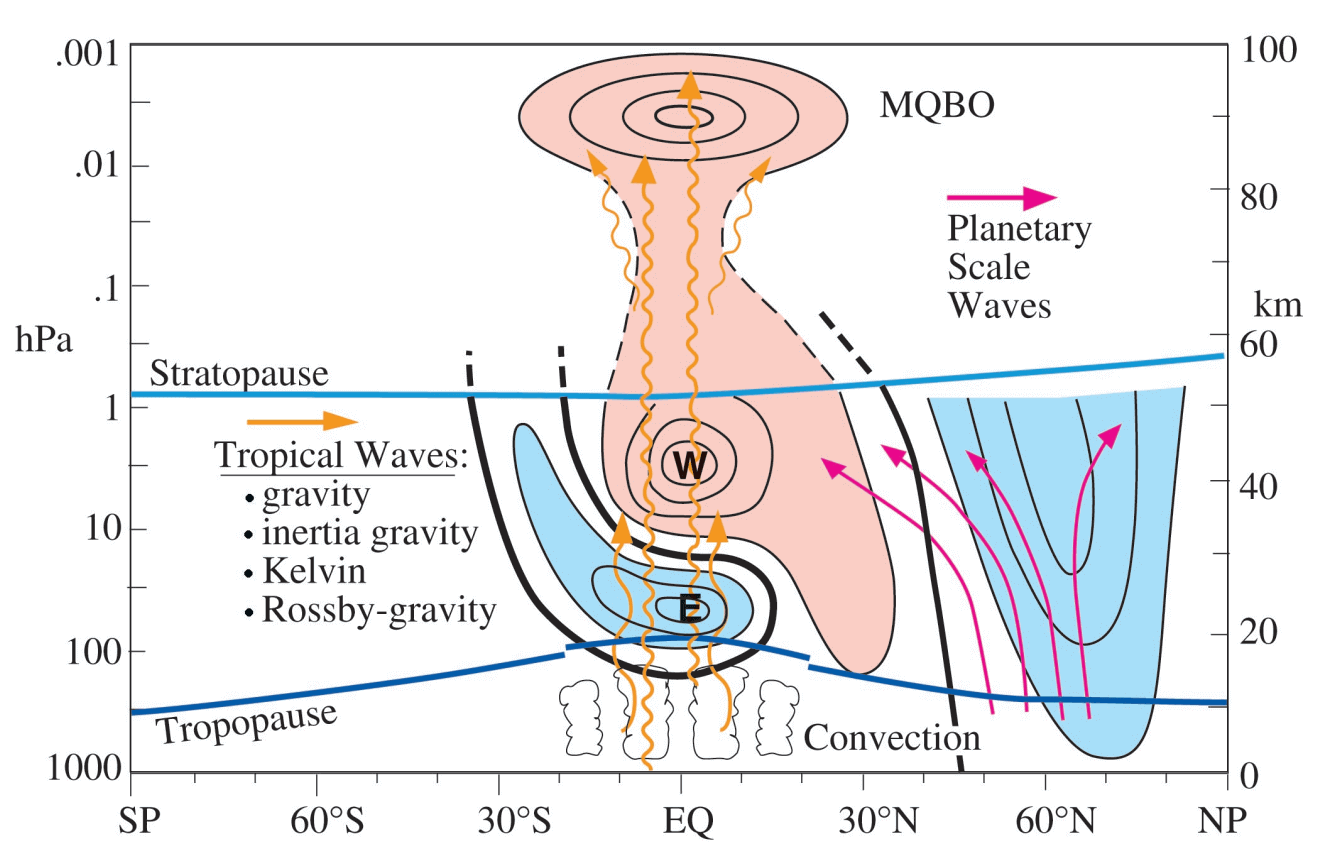
It might seem complicated, but the main takeaway is that the QBO is deeply connected to the atmospheric circulation and is linked to the overall tropical forcing, including the ENSO in the ocean below. You could say that it can also help with the “communication” between the ocean and the Polar Vortex.
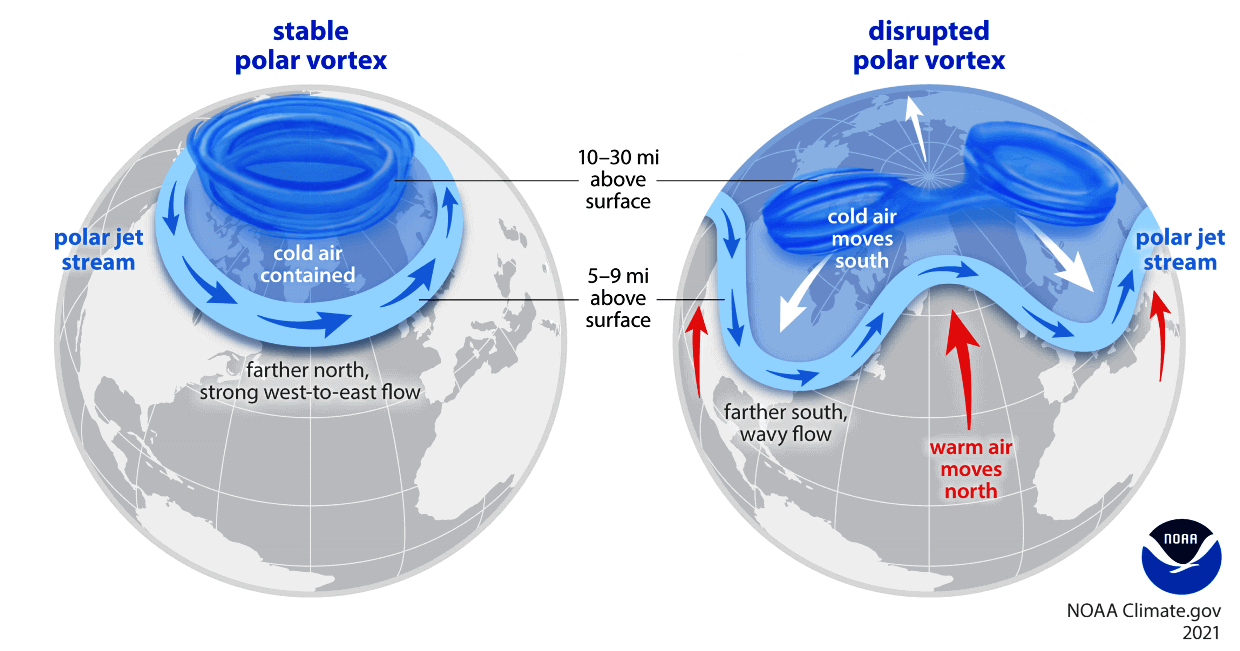
If you wonder what the Polar Vortex is, it’s basically the overall atmospheric circulation from Fall to early Spring, strongest during Winter. It’s separated into the lower and upper circulation, where the upper Polar Vortex is in the Stratosphere. Below is a 3D video example of the Polar vortex circulation in mid-winter.
A weak/disrupted Polar Vortex can create a disrupted jet stream pattern and a strong weather response. As a result, it has a harder time containing the cold air, which can escape more freely from the polar regions into the United States or other mid-latitude regions.
So, if you want a colder and snowier Winter, your best bet is a weaker Polar Vortex. In nature, a weak Polar Vortex essentially means a breakdown of the atmospheric circulation. And as you will see, a negative QBO does favor a weaker Polar Vortex in the stratosphere.
Knowing all this, we can now look at some past winters that were impacted by both the La Niña event and a negative/easterly QBO in the atmosphere.
THE POLAR VORTEX WINTER FACTOR
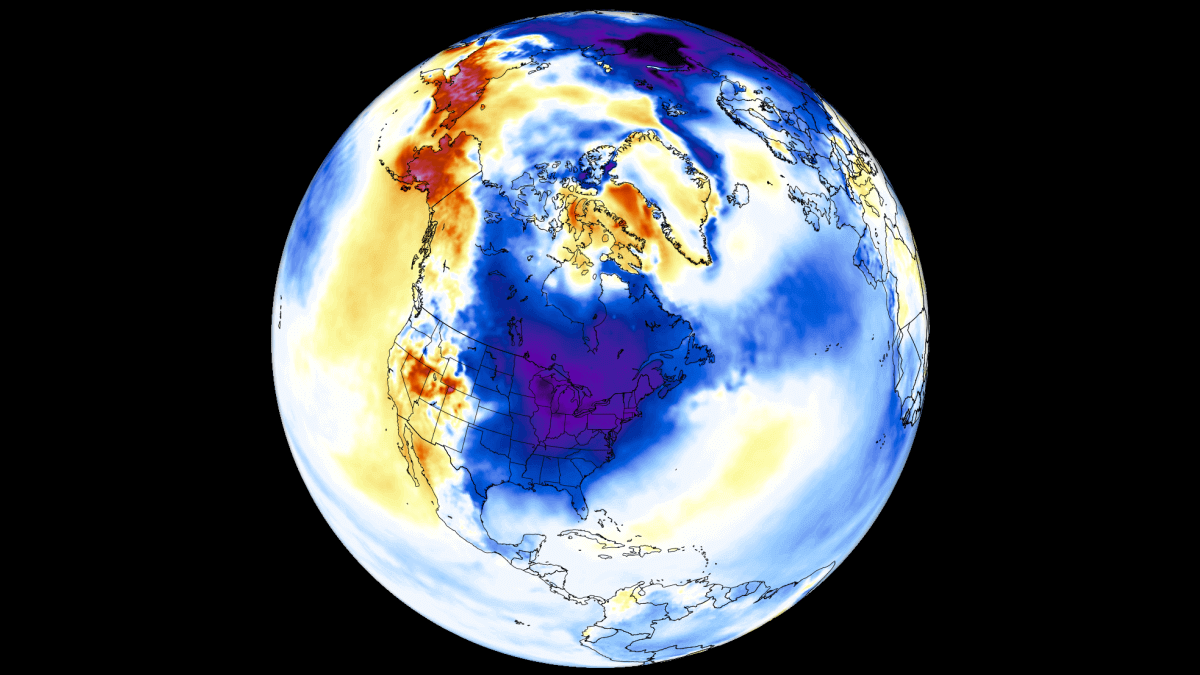
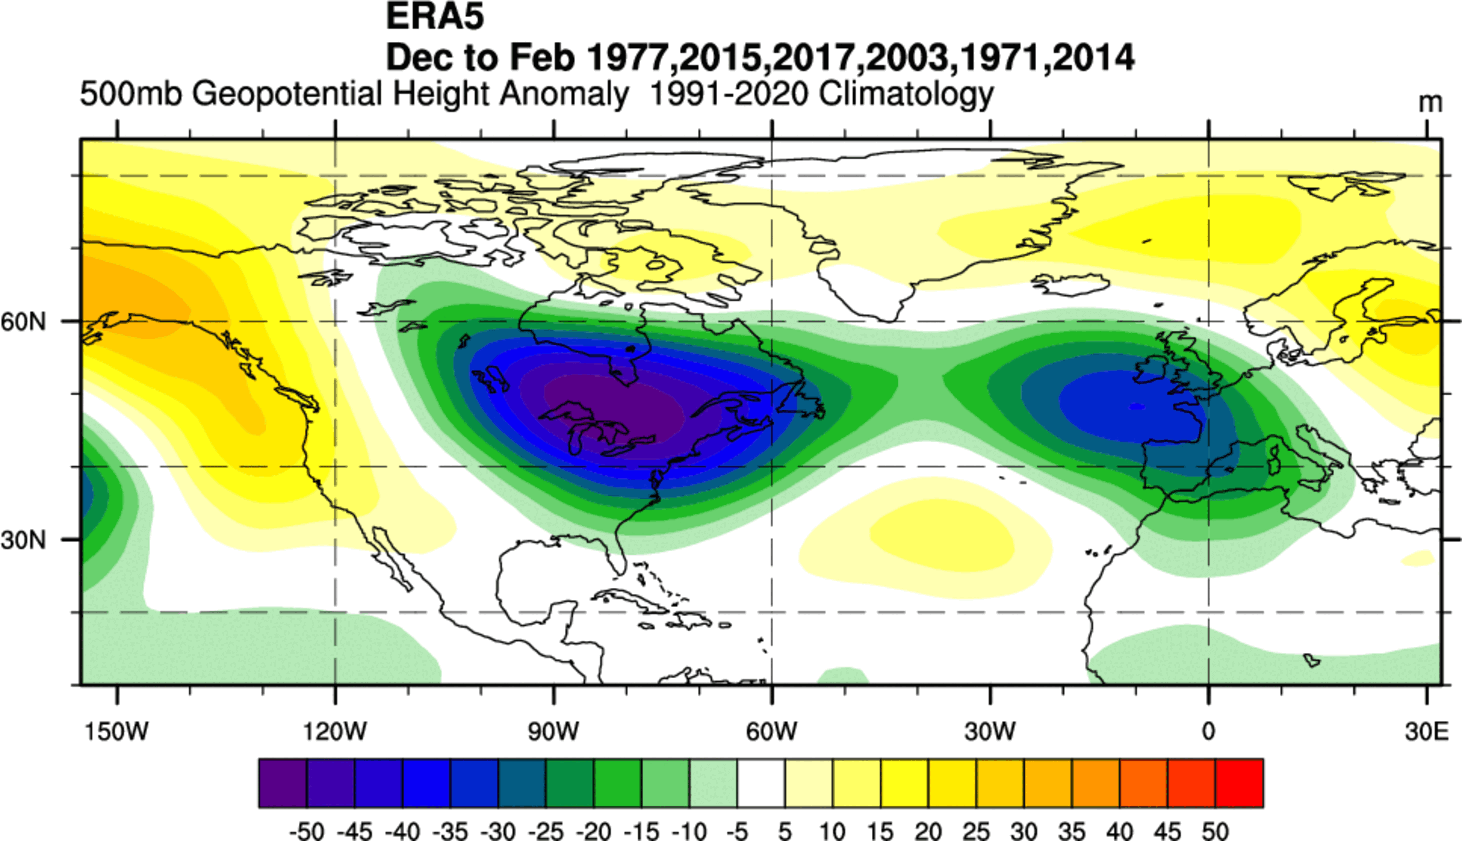
Below is a pressure pattern anomaly, made from several past winters, all of which had a La Niña event at the same time as a negative QBO in the stratosphere. We can see a large low-pressure area over the Greenland-Canada area. You can see the low-pressure area extending down into the United States, aided by a high-pressure anomaly in the northeast Pacific.
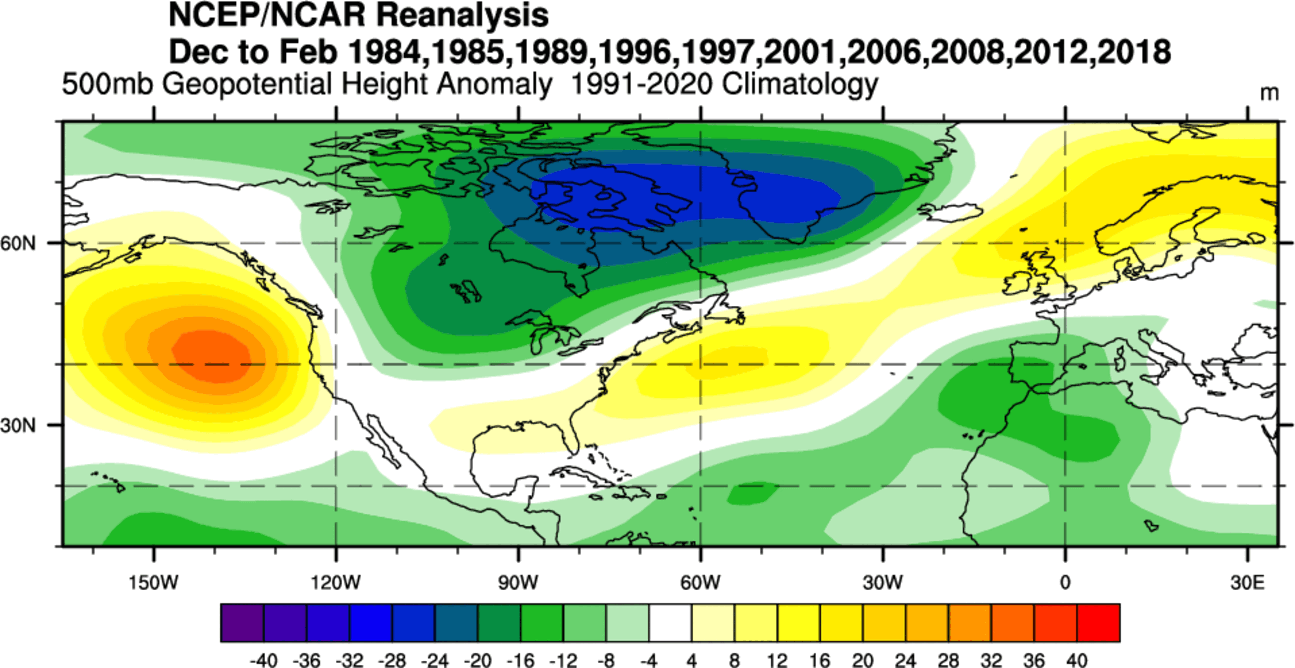
Over Europe, a high-pressure area is indicated over the northern parts, which usually brings cooler easterly air into the continent. You can also see by the years in this image that there are some strong winters in the mix. The year marks the last month of the winter, so Dec/Feb 1984 covers the Winter of 1983/1984, for example.
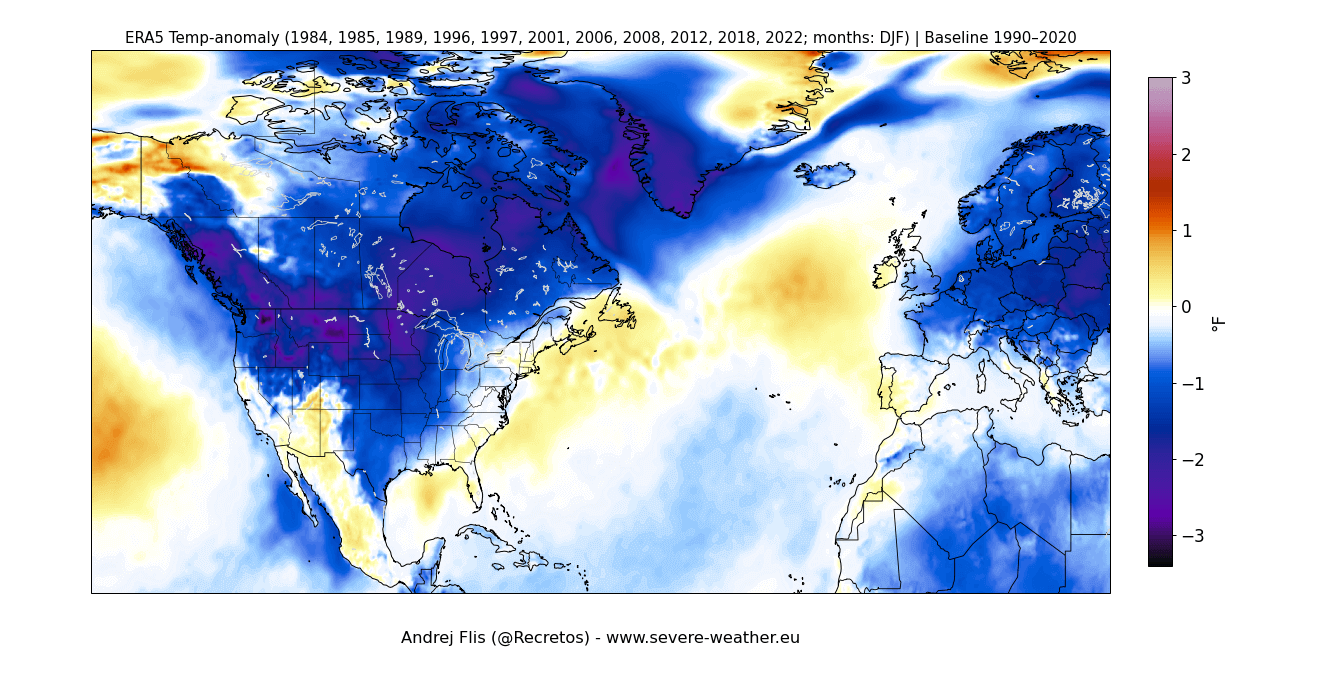
The map below shows the temperature anomaly for the La Niña/east QBO years, and it really nicely reflects the pressure pattern above. Thanks to the several cold winters in the mix, we can see a cold signal over much of the northern and central United States, and also over Europe. This is exactly what you would typically expect to see with a disrupted Polar Vortex pattern.
What usually disrupts the Polar Vortex is a stratospheric warming event (SSW). Historically, a La Niña winter has a 60-75% chance of producing a strato-warming event. It has produced them in the past and also in recent winters. The image below shows the typical SSW event frequency by month and by the ENSO event, revealing that a La Niña tends to favor a weaker Polar Vortex overall.
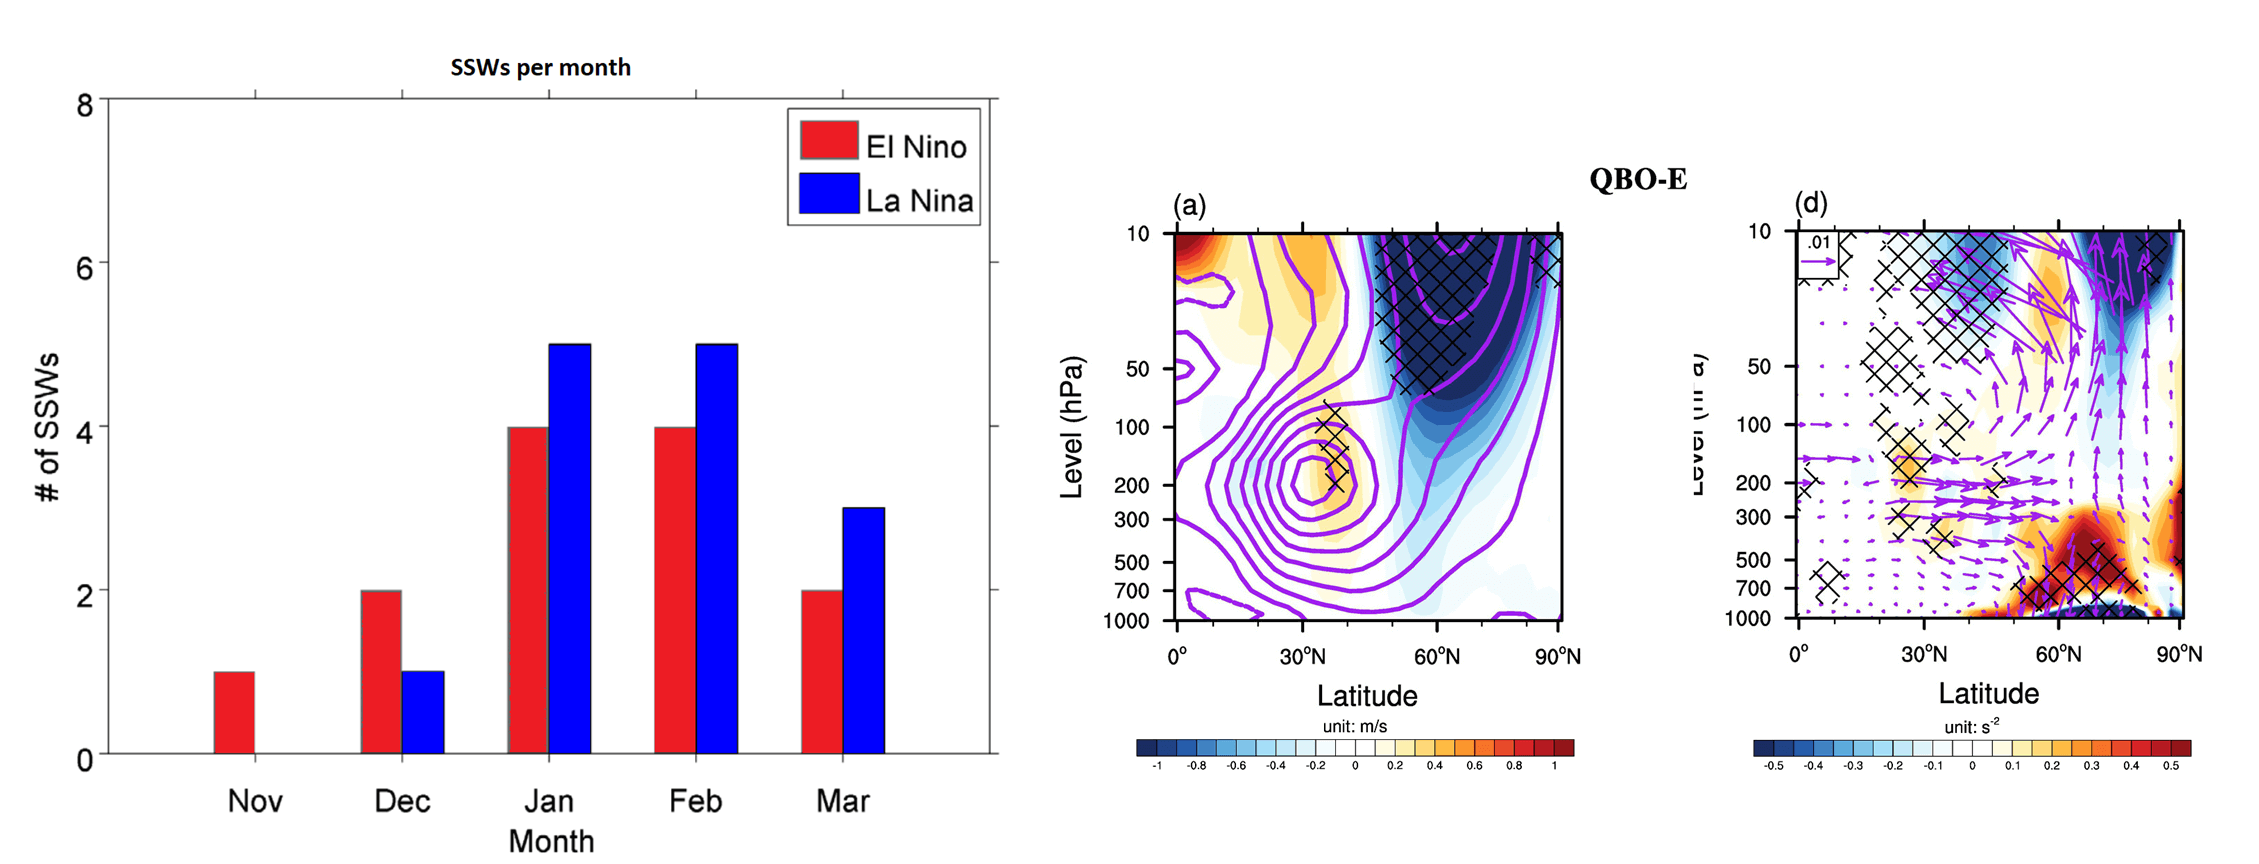
You can also see an effect from the east QBO, in combination with a low sea-ice extent, which weakens the Polar Vortex. Combined, it’s a good starting combination for a better chance of a colder winter season ahead.
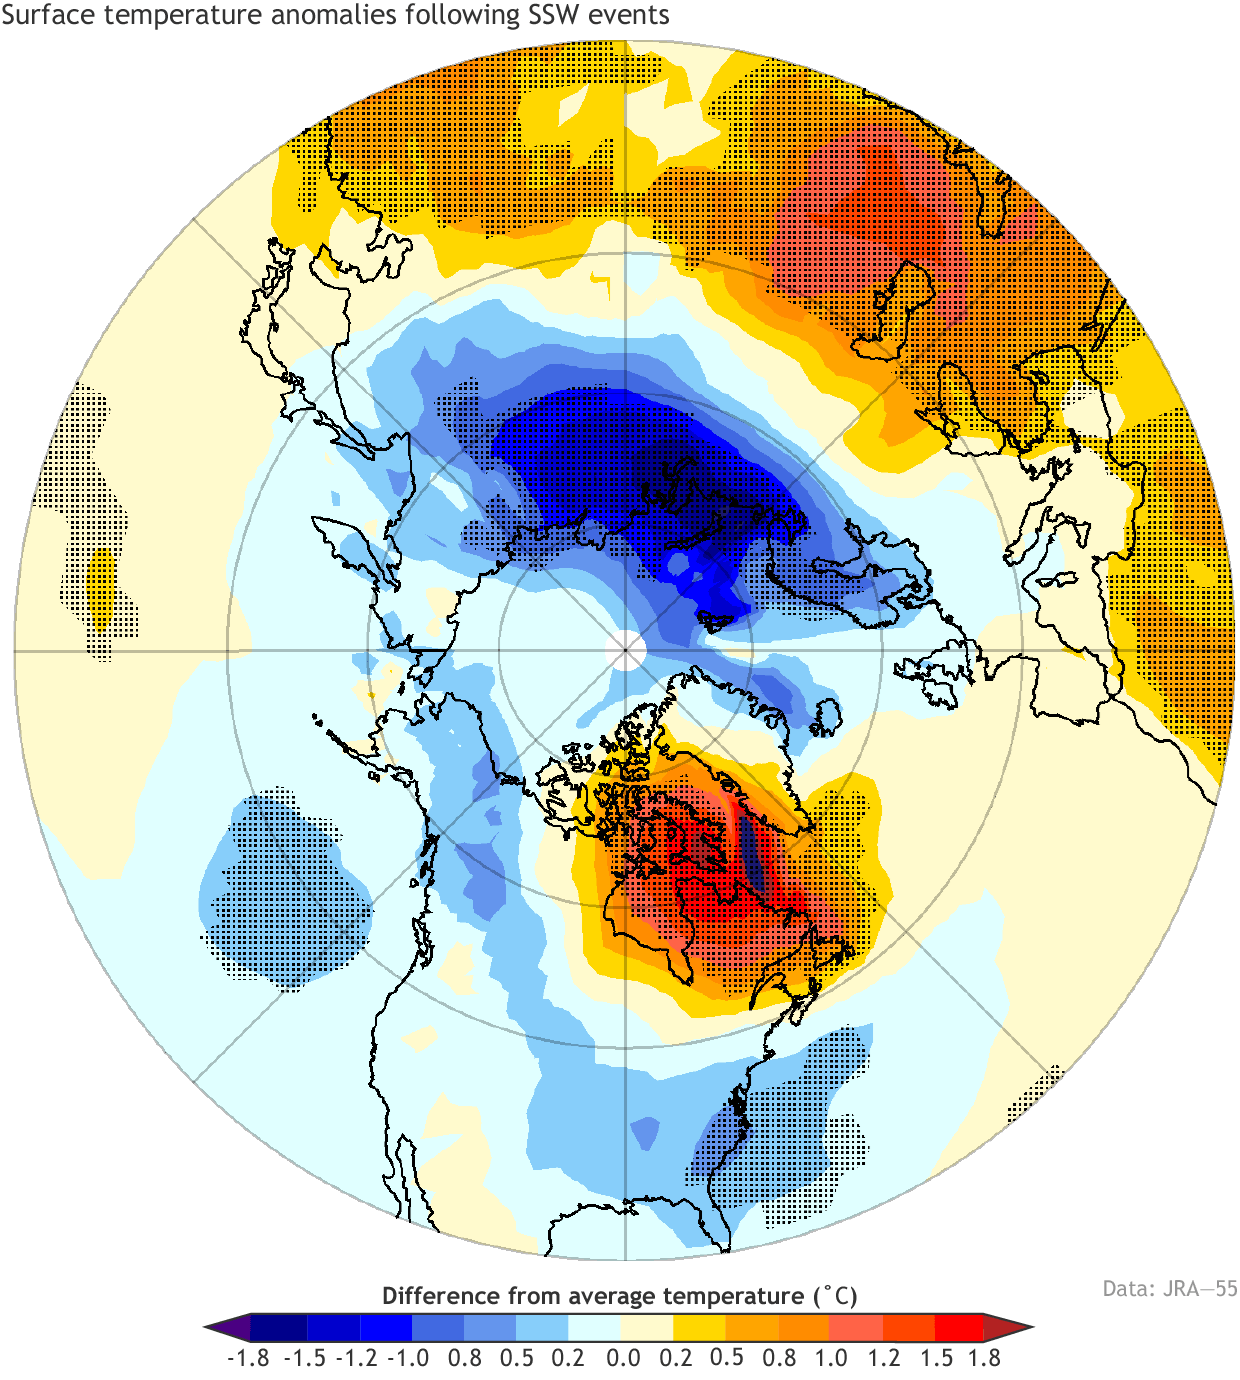
Below is the average temperature anomaly 0-30 days after a Polar Vortex disruption event (SSW). This indicates that most of the United States and the northern and central parts of Europe are typically colder than normal following an SSW event. It also fits with the temperature observations above, confirming the cold potential of this combination.
Do note that it doesn’t mean each winter with this combination will bring deep cold over the U.S. or Europe. But it does tell us a clear story: the chances are higher for a colder winter with this specific combination. And as we often hear, it is said that the past is the best teacher for the future.
The Polar Vortex is already forming, and we have a special article on its emergence that we will link to at the bottom. Below you can see the extended range forecast for the winds in the stratosphere, which are usually related to the strength of the Polar Vortex.
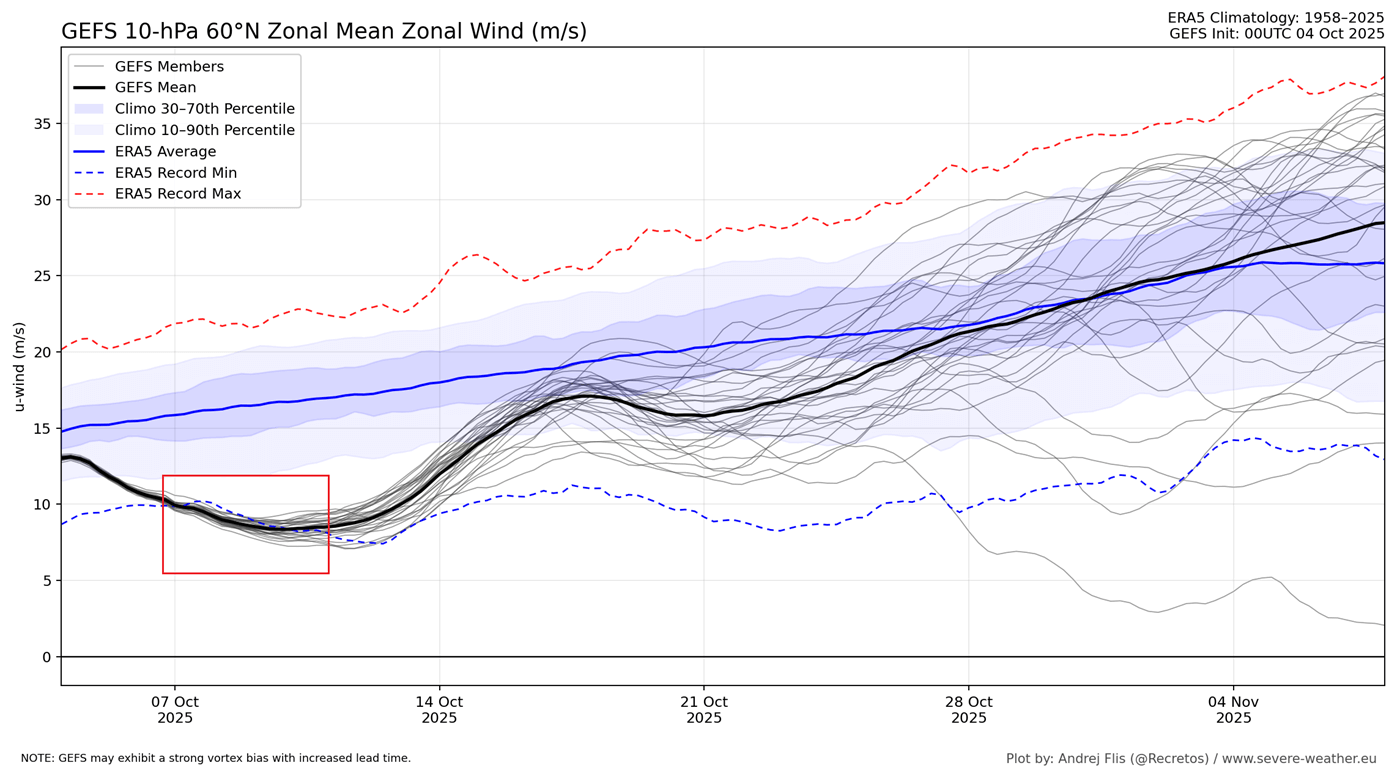
As you can see, the Polar Vortex is forecast to run at an unusually weak level, also soon reaching a record low strength for this time of year. This is a good starting point that also suggests potential issues down the line for the Polar Vortex, increasing the likelihood of a later disruption and a colder surface outcome.
To summarize so far, we can see a good signal from past events and from the forecast, which indicates a rising potential for a colder Winter to return in 2025/2026. But as always, there are many more factors at play, and the global weather system is far from simple.
ANOTHER COLD INDICATOR
In “analog” forecasting, we usually look at the global ocean anomalies as the “holy grail” of seasonal forecasting. That’s because the global oceans cover the majority of the Earth’s surface and play a crucial role in the global weather system. So similar ocean patterns can yield similar weather outcomes, at least in theory.
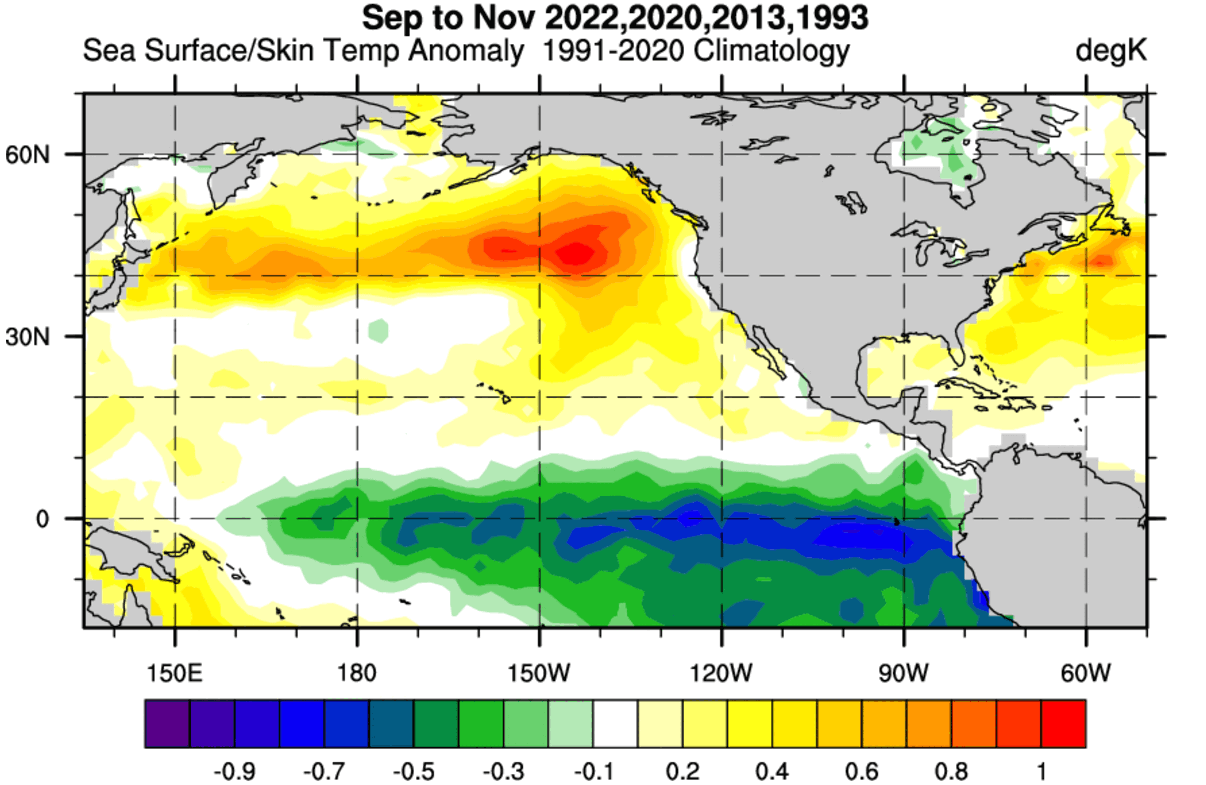
Below is the NCEP NMME forecast, and it shows the Fall-Winter ocean temperature anomaly. What you can see is a strong contrast between the cold La Niña in the tropics and the much warmer North Pacific. This is a unique combination, not often seen in the past.

This allows us to look into the recent past and find years with similar conditions. We have found four Fall seasons that, when combined, show a very similar ocean anomaly pattern to the forecast. Below, you can see the composite years, with a warm anomaly in the North Pacific and a weak La Niña event or cold-neutral tropics, which really resemble the forecast for 2025/2026 above.
With this data, we can look at how the winters in these seasons developed, and where the majority of the cold and snowfall was, using it as another “analog” guidance for the upcoming winter.
We made special custom images from ERA5 data for these years. Below is the temperature analysis for the same winters, and you can see a large cold air anomaly over North America. Cold air is spreading from Canada into the United States, as a cross-polar flow has been established, bringing air down from the polar circle.
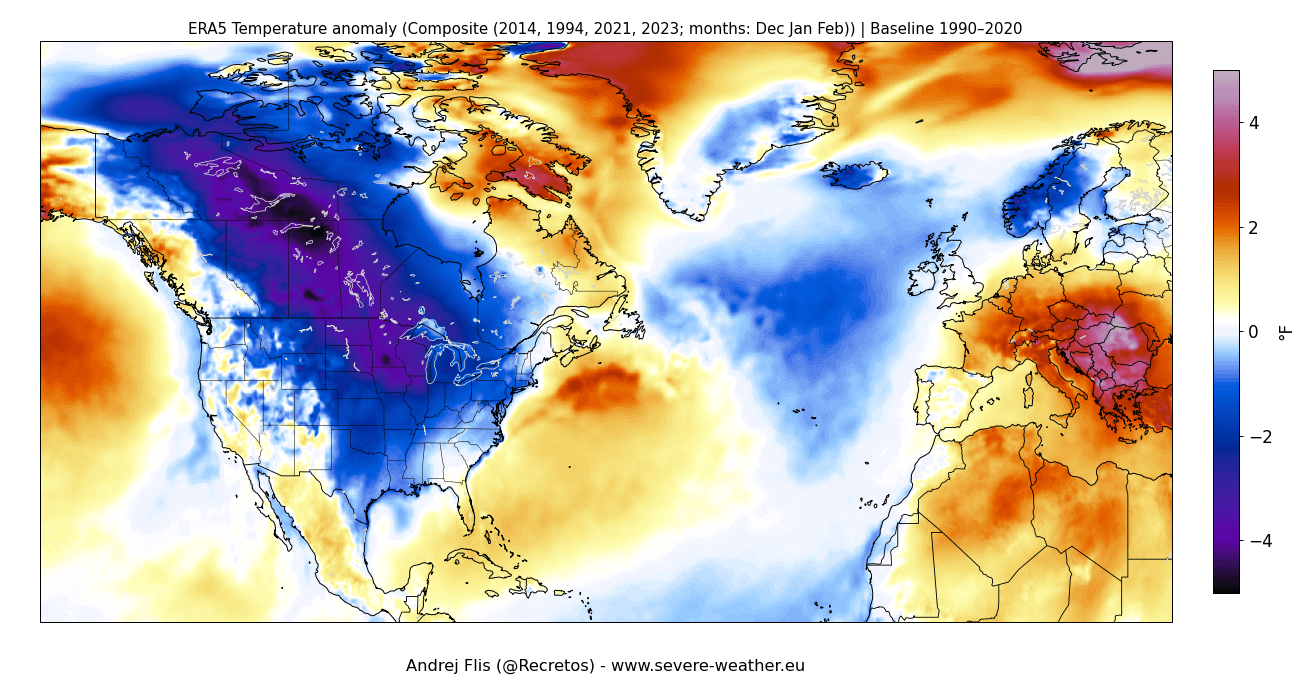
But over Europe, you can see the warm air anomaly, brought in by the westerly and southerly winds from the strong low-pressure area over the northwest.
Looking at the snowfall analysis for the same seasons, you can see a large spread of above-normal snowfall over the northern, eastern, and also south-central United States, and parts of western and central Canada. This is enabled by the cold air from the north, which brings the snow level to low altitudes and the lowlands.
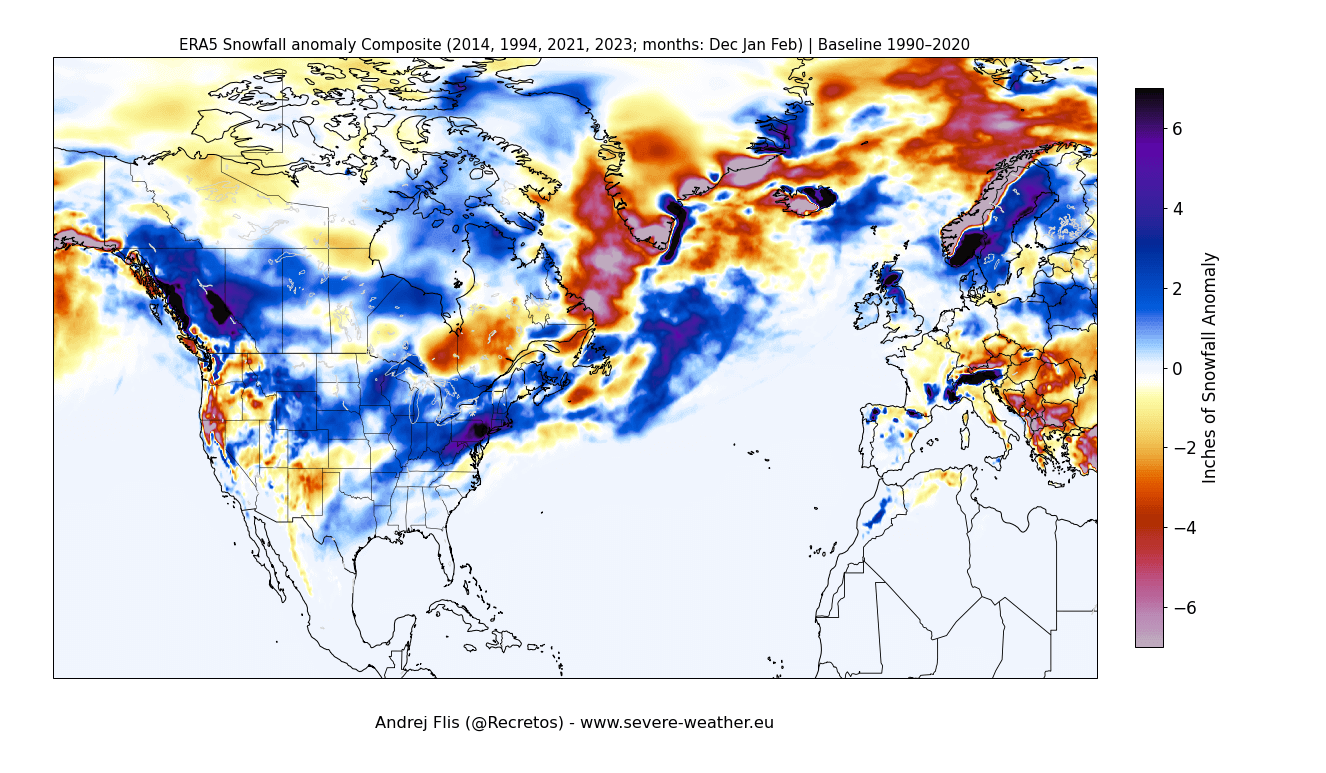
Across Europe, the main snowfall potential is found in higher elevations and towards the north, where temperatures are generally low enough. There is also good coverage of above-normal snow anomalies over the UK and Ireland, giving a favourable sign for a normal to good winter there.
Of course, this is not exactly how every such Winter season will look with similar ocean conditions. But this allows us to have some extra guidance or an idea, what usually happens in winter with similar conditions.
We have also just entered the month of October, and here we have one more indicator, which we will monitor very closely in the coming weeks, and you can do the same too.
WHAT TO LOOK OUT FOR IN OCTOBER
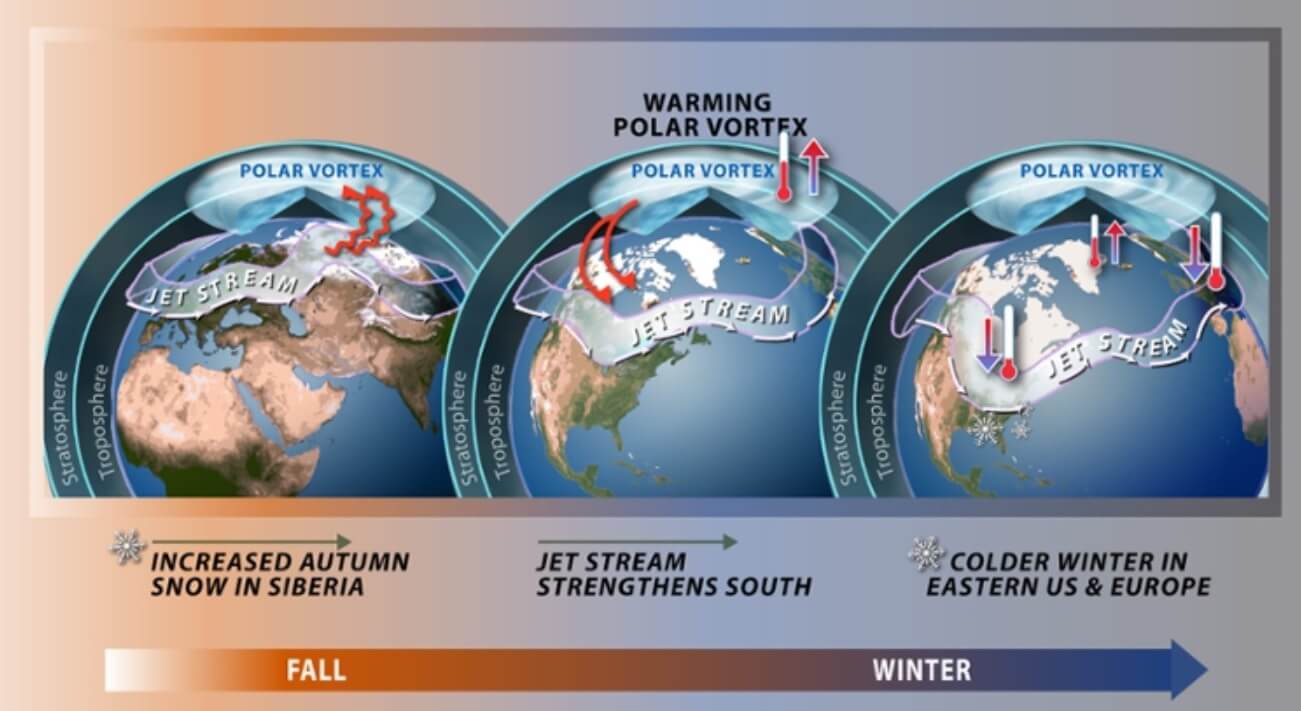
Weather patterns can influence the Polar Vortex early on by building an extensive snow cover over Siberia. Multiple studies have proved that the snow cover extent in October over Siberia weakens the stratospheric Polar Vortex at a later period.
The theory suggests that a stronger winter high-pressure system can develop over the region due to the presence of snow cover. Then, this stronger high-pressure area affects the Polar Vortex, as it helps to send more vertical energy up into the Stratosphere, disrupting the flow.
A weaker Polar Vortex naturally means weaker polar circulation and a greater chance of cold air outbreaks over the United States and Europe during Winter, as we have seen above. Below, you can see the basic schematic of the changing Polar Vortex circulation in an even simpler way.
Looking at the past data, we first searched for the top 6 snow cover years and did an analysis on the winters, following the large October snow cover over Siberia.
Below are Winter pressure anomalies for the 6 winters following the highest October snow extent. You can see a very interesting pattern: high pressure over the polar regions and disrupted circulation, typical of a weakened Polar Vortex. Low-pressure areas span from the eastern United States into the North Atlantic.
The winter temperature anomalies for these winters are very interesting, with the colder air being released into the mid-latitudes. We can see cold air over much of the northern and eastern half of the United States, in a deep polar flow. Cooler air was also present over Europe.

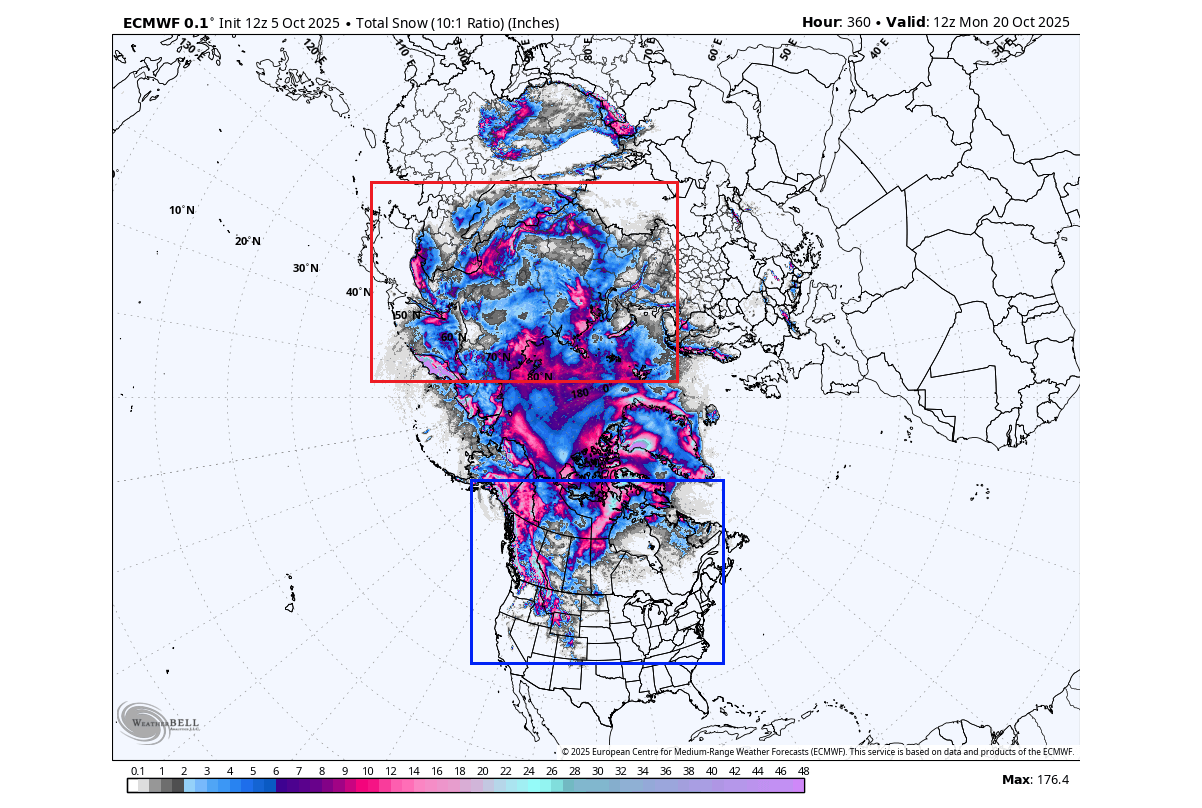
And looking at the latest ECMWF snowfall forecast below, you can see the area of interest in the red box, which shows exceptional snow cover for just over half of the month. In the blue box, you can also see the snowfall returning into western Canada and the northwestern United States.
From all this, you can see that having a larger October snow extent can mean a colder Winter and more snowfall over the United States and Europe. So, having a large October snow extent should be on your wish list if you are a fan of cold and snow during winter.
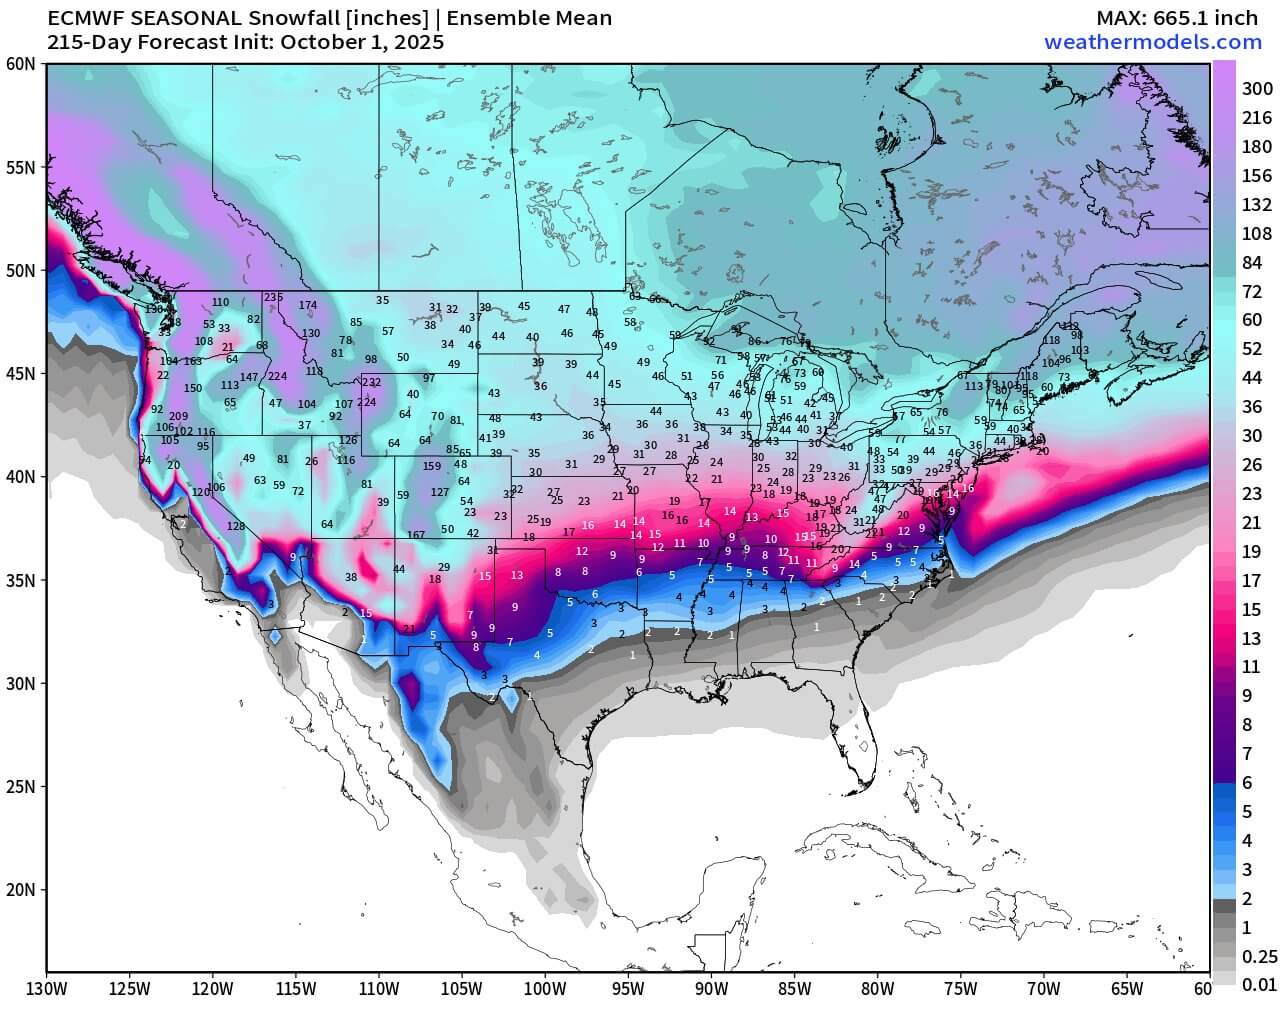
Below is also the very latest seasonal total snowfall forecast from ECMWF, which has caused quite a stir, and for a good reason. It shows the total seasonal snowfall amount over the next 6 months and indicates an impressive snow amount and coverage over the coming season. We will closely monitor this development.
Now, to summarize, we have seen a combination of four factors that have contributed to colder winters in the past and are now starting to align again for the 2025/2026 Winter season. There are still plenty of other medium or small-scale factors that can shift the scales in the opposite direction, but the main drivers show promise for now.
You can also follow the snow area graph on the NOAA NESDIS page. Simply change the region to Eurasia, as that’s where the main area of interest lies for October and the current 2025/2026 season.
And as promised, here is a more in-depth Polar Vortex emergence analysis: A New Polar Vortex is Now Emerging over the North Pole and will bring Weather Impacts on Winter 2025/2026
We will keep you updated on the developing weather trends in the coming seasons, so make sure to bookmark our page. Also, if you have seen this article in the Google App (Discover) feed, click the like button (♥) or add us to preferred sources there to see more of our forecasts and our latest articles on weather and nature in general.