The La Nina has reached near peak cooling anomalies in the equatorial Pacific, further assuring its influence on the Winter season. The latest forecast calls for the La Nina to continue into early Spring 2022, with now an increased chance for an El Nino event emerging for next Winter 2022/2023, bringing along a very different weather pattern.
But what are these La Nina and El Nino events, and how can they impact the seasonal winter weather across the entire Northern Hemisphere? As you will quickly find out, they are actually both just a part of a large old system that connects the ocean and the atmosphere called the ENSO.
We will also look at the current conditions across the ENSO regions, what the latest forecast shows for ENSO in the coming months, and how strong is the cold phase weather signal in the latest forecast for the Winter season 2021/2022. The image below shows the El Nino event of the 1997/1998 Winter season.

WHAT IT IS ENSO AND WHY IT MATTERS
Keeping it simple, ENSO is short for “El Niño Southern Oscillation”. This is a region of the tropical Pacific ocean. It is always changing between warm and cold phases, called El Nino and La Nina, respectfully.
ENSO has a major impact on the tropical convection patterns (storms) and the complex interaction between the ocean and the atmosphere. We can observe large-scale pressure changes in the tropics with each developing phase. With some delay, these changes affect the circulation over the rest of the world.
The image below shows the ENSO regions in the tropical Pacific. Regions 3 and 4 cover the east and west and together cover a large part of the tropical Pacific. But most analysis and forecasts are based on a combination of regions 3 and 4, seen on the image as the Nino 3.4 region. Region 3 covers the eastern tropical Pacific, while region 4 covers the central and western parts.

Each ENSO phase has a different effect on the pressure and weather in the tropics. This translates to the overall global circulation and thus impacts the weather worldwide differently. A specific phase (cold/warm) usually develops between late summer and fall and typically lasts till next summer. But some events can last even up to two years.
The cold ENSO phase is called La Nina and the warm phase is called El Nino. The name La Nina literally translates to “the girl”, and the name El Nino translates to “the boy”, indicating an opposite relation between the phases.
We determine the ENSO phases by looking at the sea surface temperature anomalies (warmer/colder) in the ENSO 3.4 region, which you saw in the previous image above.
The image below from NOAA Climate shows the typical circulation during a cold phase that we are currently in. Air descends in the eastern Pacific, causing stable and dry weather, while air rises in the western Pacific, causing frequent thunderstorms and a lot of rainfall.

This way, ENSO has a major impact on the tropical rainfall and pressure patterns and impacts the ocean-atmosphere feedback system. Through this ocean-atmosphere system, the ENSO influence is then distributed globally. We usually observe a global shift in pressure patterns during the emergence, but more during the peak of the ENSO phases.
But how does ENSO shift between cold and warm phases? There is no simple answer, but we can say that it is a result of the complex dynamics between pressure patterns and winds. The tropical trade winds usually initiate or stop a certain phase, by mixing the ocean surface layers and altering the ocean currents and thus temperature.
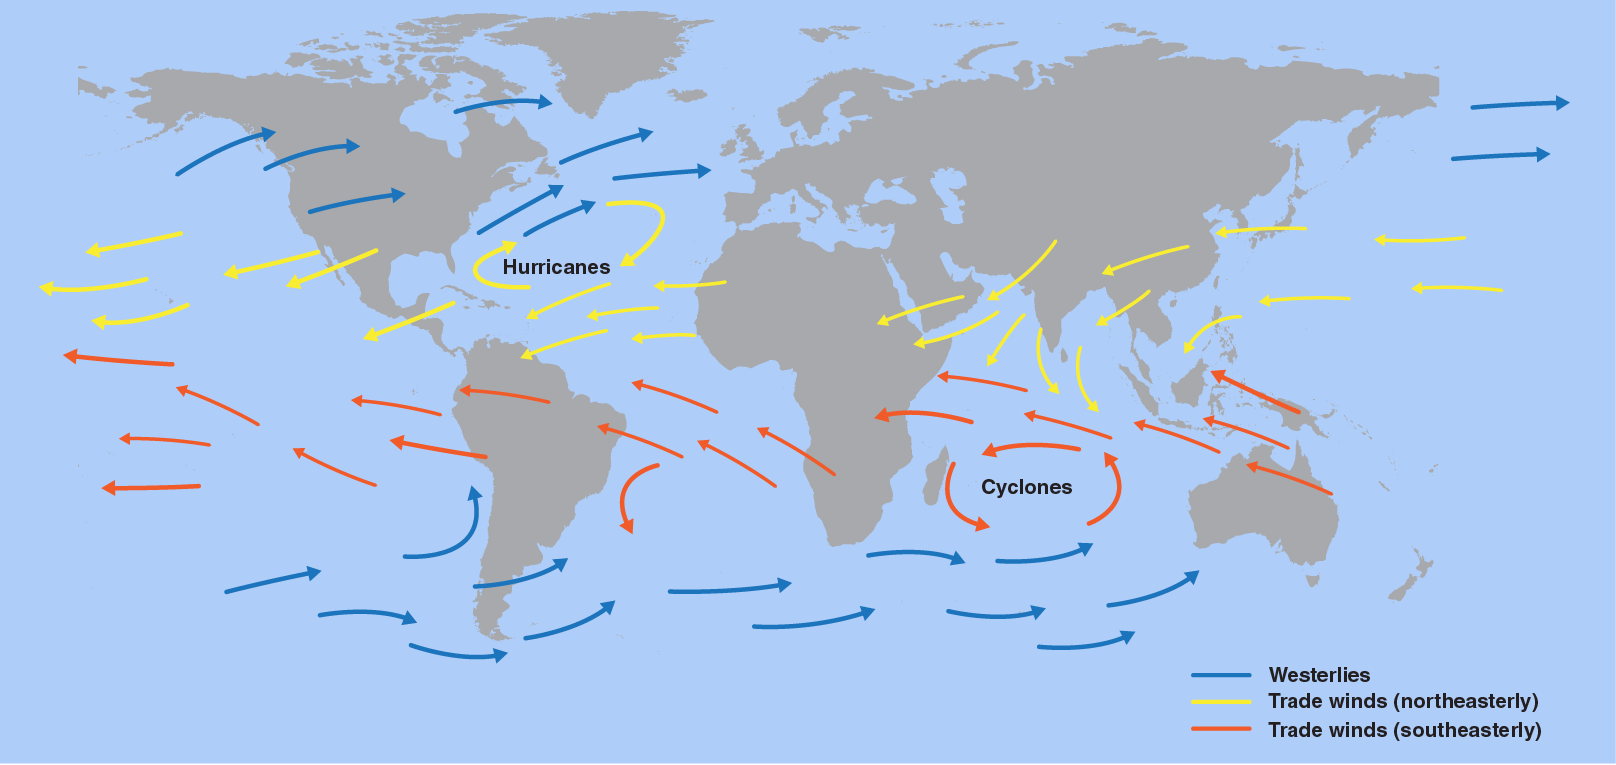
What are the trade winds? The trade winds are steady, and persistent winds, which blow towards (and along) the Equator in both Hemispheres. The image below from Weather.gov nicely shows a simplified version of the global prevailing winds. Trade winds are in yellow and red, depending on the Hemisphere.
When these easterly winds get stronger, they can actually start changing the ocean surface currents, and they can start pushing the water from east to west. This moves warm surface waters towards the west, bringing deeper (colder) waters closer to the surface.
This process is much better seen on the video animation below, which shows the ocean temperature anomalies from Summer to late Fall. You can see new cooling starting in July. Notice the “waveforms” across the region, as the surface water is being pushed west by the trade winds, bringing cooler water to the surface.
The image below shows the latest ocean surface currents in the ENSO regions. We can see strong easterly currents, which are pushing the water towards the west, and cooling the ocean surface. The easterly regions are usually always colder than the western.
But the secret is not just in the winds themselves, as they are always being driven by pressure changes. The ENSO phase directly responds to a unique atmospheric pressure variability, called the Southern Oscillation Index.
The Southern Oscillation Index or SOI represents the difference in air pressure measured at Tahiti (French Polynesia) and Darwin (Australia). The image below shows the location of the two pressure zones.
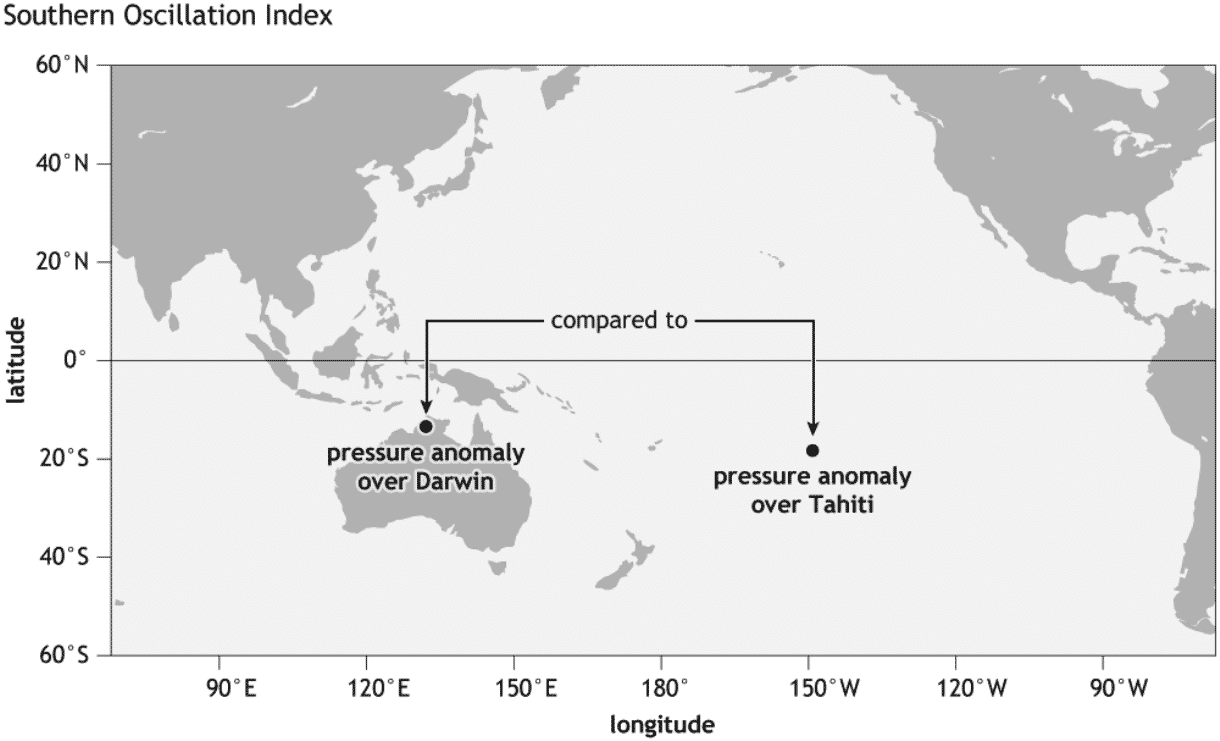
Positive SOI values mean that the pressure over the Tahiti side is higher than over Darwin in Australia. This corresponds to La Nina conditions. But during an El Nino, we see lower pressure in the eastern Pacific and over Tahiti, and higher over Darwin, Australia. This produces a negative SOI value and weaker trade winds, thus less ocean cooling.
The SOI tells us what the pressure pattern looks like in the tropical Pacific, which then affects the trade winds, warming or cooling the ENSO regions.
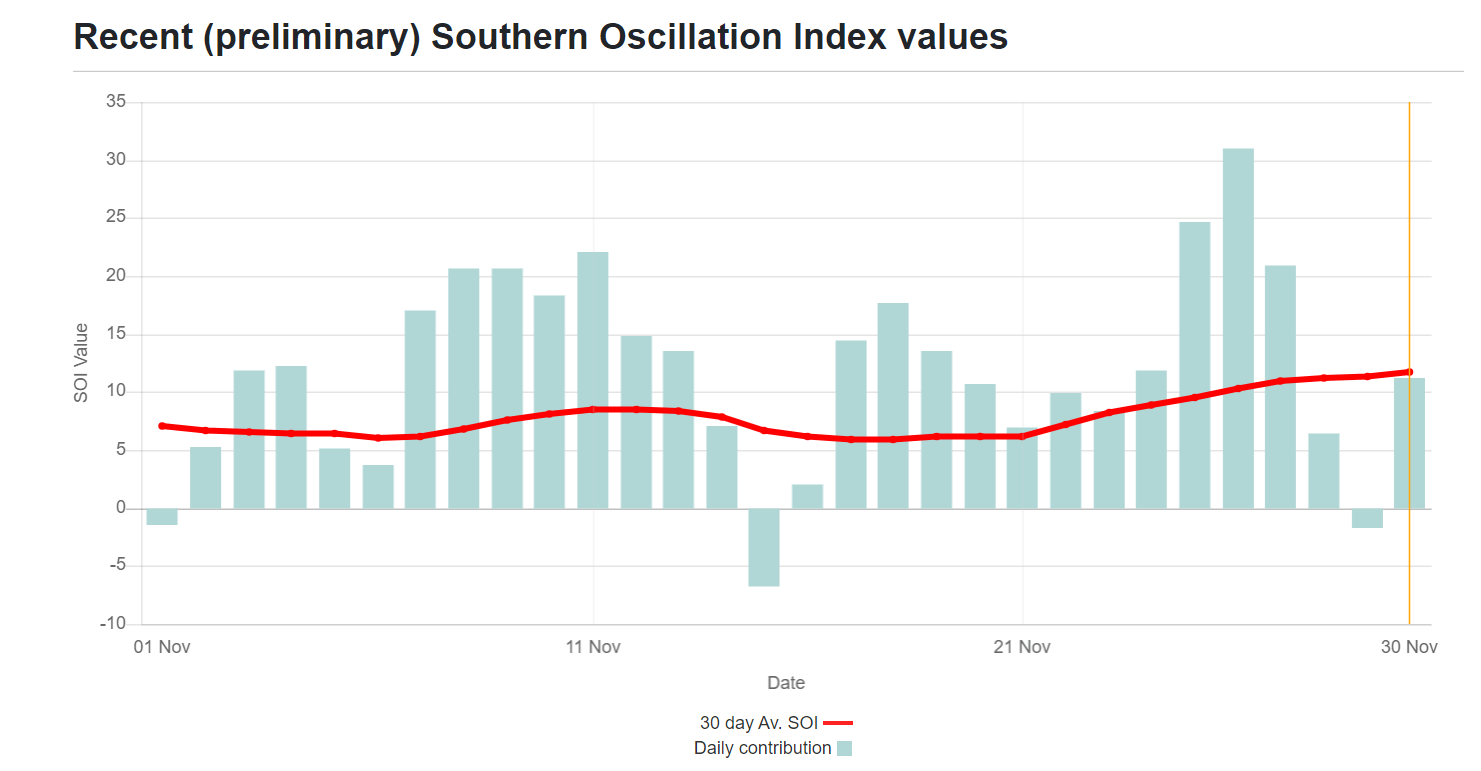
Below we have the 30-day average SOI index, which nicely the positive values and confirms the presence and further development of the cold ocean phase. The SOI can be used to determine the potential effect or direct influence of the ENSO phase on the climate in the western Pacific and Australia.
LA NINA – CURRENT CONDITIONS
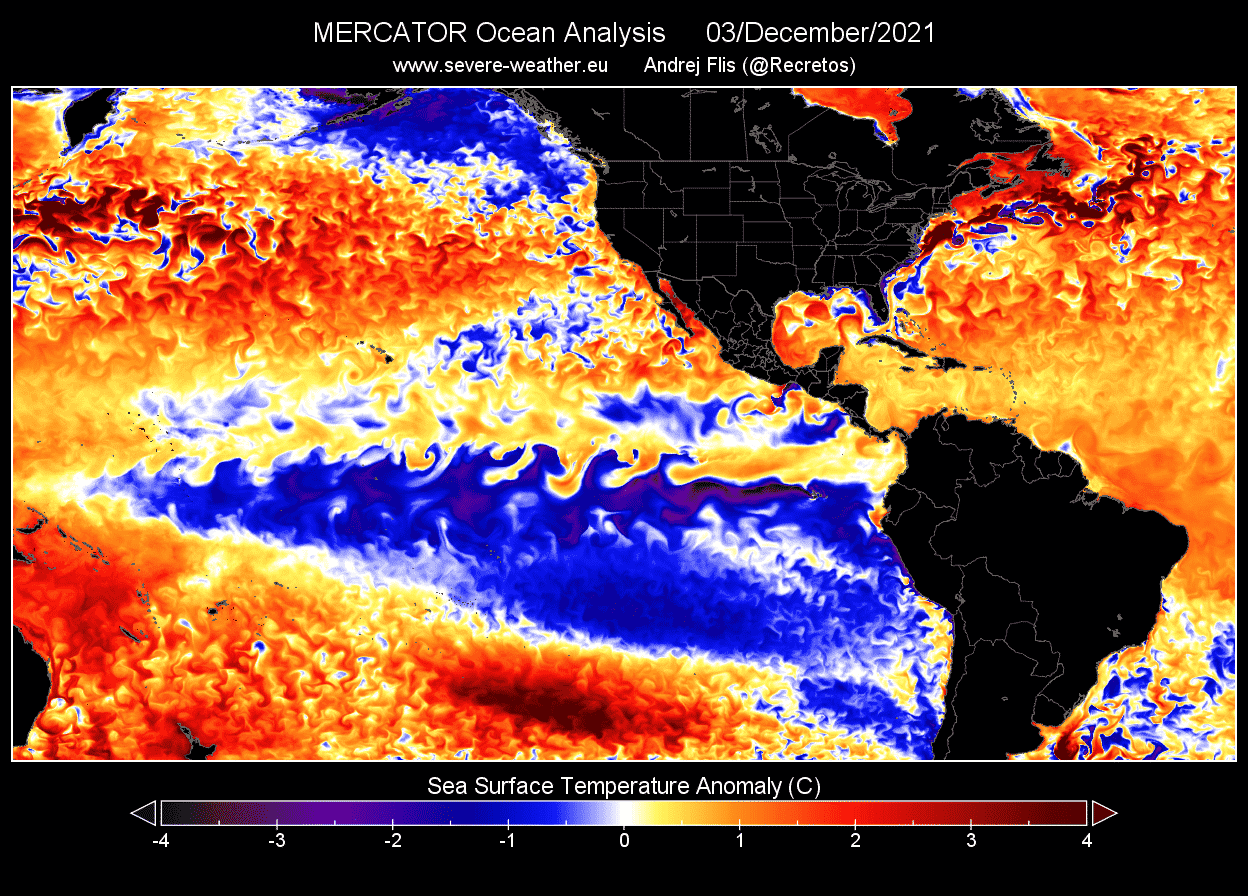
Current global ocean analysis reveals the strong cooling in the tropical Pacific. This is exactly in the ENSO 3.4 region, seen earlier above. The “wave-like” shapes of the cold anomalies indicate strong trade winds, pushing the surface waters from east to west.

Focusing on region 3.4, you can see on the image below how the rapid ocean cooling began in summer and autumn 2020. That was the development of the cold phase last year. We can see a new cooling emerging this September, which was the start of a new cold phase, that got stronger during Fall.

An interesting fact in the image above is that a lot of first-year La Ninas continue to evolve into a second-year event next cold season. This is exactly what we are seeing this year, with a new cooling event following the previous one. Such an event is called a second-year La Nina.
But it is not unusual to have two La Nina events follow each other. In fact, of the twelve first-year cold events, eight were followed by a second cold phase the next winter, two by a neutral phase, and two by El Nino.
The current cooling has been quite substantial and persistent from the beginning of the meteorological fall season. The image below shows the sea surface temperatures in the main ENSO 3.4 region. We can see a steady temperature drop since early September, reaching a bottom now in November.

But we have to remove the normal temperatures, to see the actual cooling, and the cold anomalies. The image below shows the temperature anomaly in the ENSO 3.4 region and reveals a stronger deviation from the norm since mid-September, due to stronger trade winds. We are currently well below the La Nina threshold of -0.5°.

Below we have a close-up image of the ENSO regions. You can nicely see the developing cold “waveforms”, as the pressure patterns are creating strong trade winds, forcing the wind-driven ocean surface cooling. Peak cold anomalies are now more towards the eastern region.
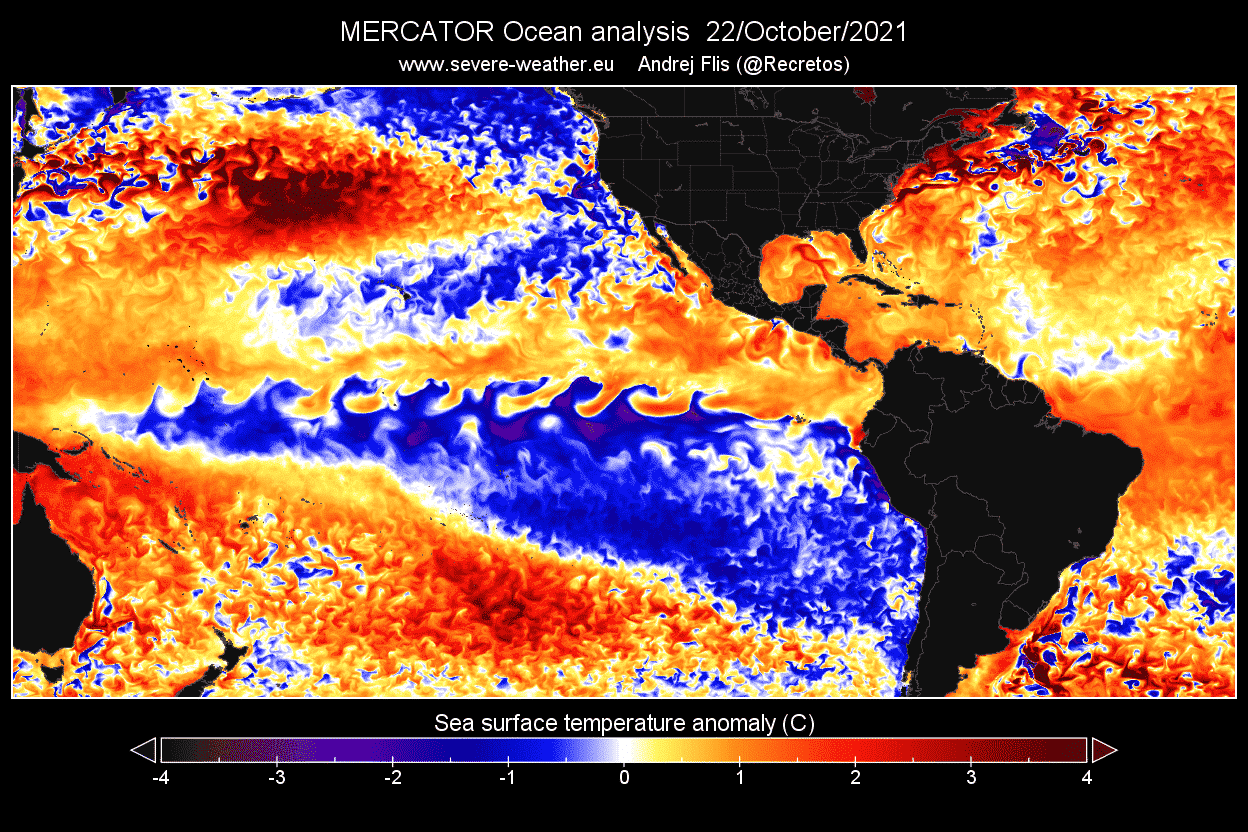
Looking back into mid-Fall, we can see the La Nina was not as strong overall but was peaking in the central regions. The cold waveforms were also not as defined, as the easterly winds were not as strong, and powered up in the next days/weeks, starting the stronger cooling towards the eastern regions.
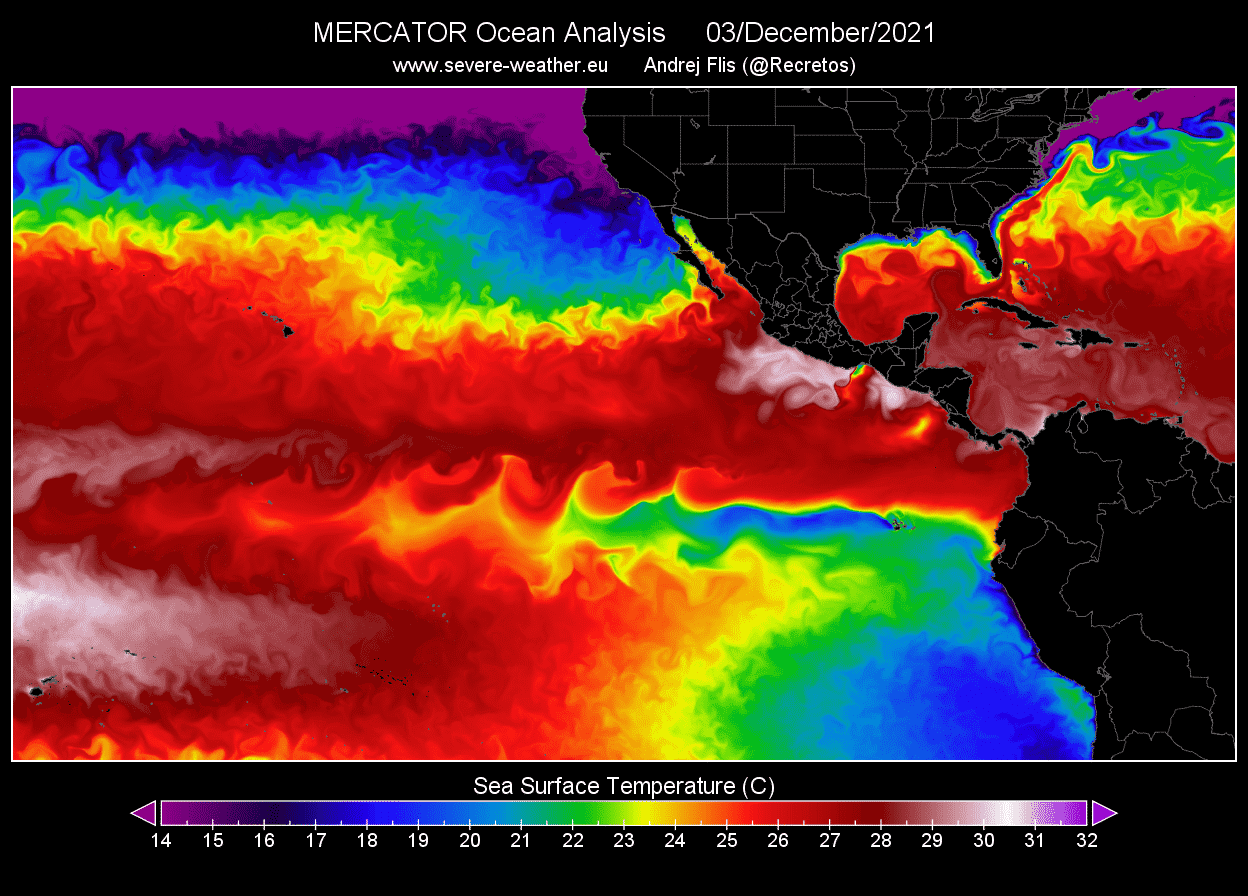
If we look at the actual current temperatures, they reveal a “cold-tongue” extending from South America, towards the west, directly across the equator. In this region, the surface waters are always colder than the surrounding regions, but during a La Nina event, they can be up to 4°C colder than normal. We can see the typical wind-driven surface pattern.
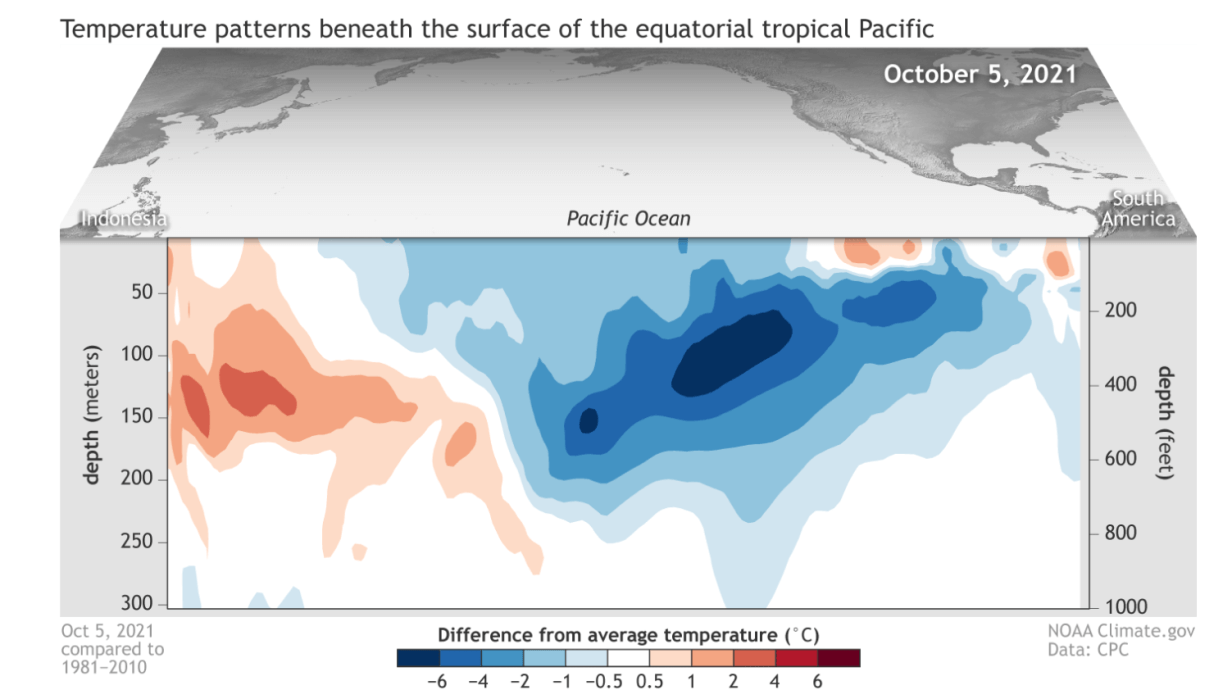
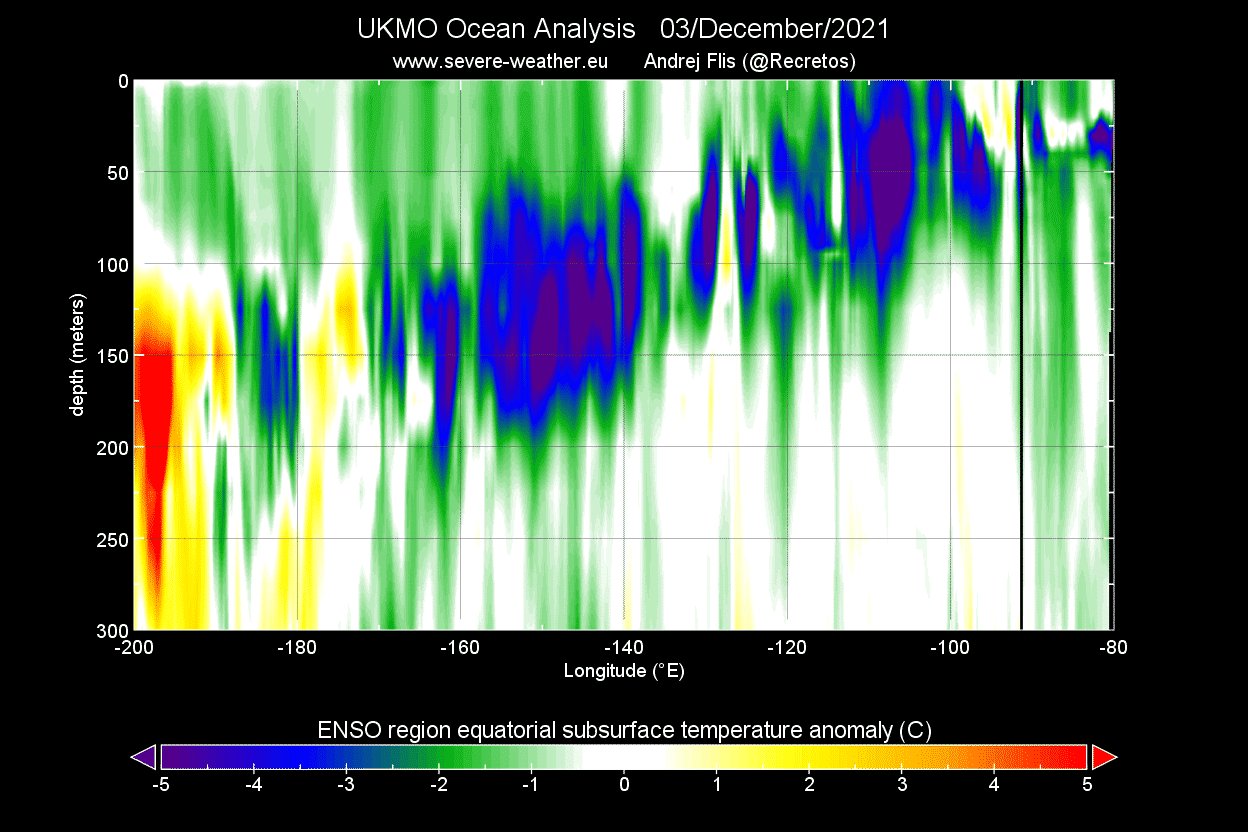
The next image below shows a cross-section by depth along the equator in the Pacific Ocean, from the Asian side on the left to South America on the right. The full vertical profile over the ENSO regions reveals the ocean temperature anomaly by depth. You can see very strong cold anomalies were found between 50 and 150 meters below the surface in early October.
Looking at the latest high-resolution analysis by depth under the ENSO regions, we still see much colder temperatures. The large cold pool is now broken apart slightly, with colder anomalies closer to the surface in the eastern regions. This shows that the upwelling is strong, due to strong trade winds.
One way to look at the whole ENSO region temperature strength is by looking at the ocean heat content. This takes the water at depth into consideration, not just the surface temperatures. And below we can see the first La Nina of last year weakening in Spring. But the cold anomalies have peaked in mid-October. Lately, the subsurface cold anomalies have weakened, indicating that the La Nina is near-or-at its peak.

Based on all the available data, an official La Nina watch has been issued by the NOAA’s Climate Prediction Center:
“La Niña is likely to continue through the Northern Hemisphere winter 2021-22 (~90% chance) and into spring 2022 (~50% chance during March-May). La Niña is anticipated to affect temperature and precipitation across the United States during the upcoming months.”
Tracking the weather effects of these ENSO phases is not all that easy. It is not as simple to just point at a certain weather event and simply call it “ENSO powered”. Global weather is a very delicate system, where everything has an influence on everything. But of course at quite different “power levels”.
For example, it is quite simple to find evidence for direct La Nina or El Nino-related weather patterns over the North Pacific or the United States in winter or spring.
But over Europe, the direct La Nina influence slowly fades, due to the generic weather pattern volatility. The influence is still there, but it is mitigated/modified by the existing weather patterns in the North Atlantic.
One way of searching for the “fingerprint” of the La Nina, is by looking at the atmospheric circulation, more specifically its angular momentum. Keeping it very simple, the Atmospheric Angular Momentum (AAM) is a measure of how the entire atmosphere rotates around the Earth. ENSO phases are strong enough to cause measurable changes in this atmospheric circulation around the Earth.
Positive anomalies are related to the warm phase of the ENSO, while negative values are more related to the cold ENSO phase, which we are currently in.
Below we have a relatively simple graphic by MJ Ventrice, which shows the global wind oscillation daily values and movement. Simply put, if the values are in the bottom half (low atmospheric angular momentum), that is a sign of the La Nina state. High AAM corresponds to the El Nino events.

LA NINA FORECAST 2021/2022
Knowing what the ENSO and its warm and cold phases are, we are going to focus on its evolution through the winter season and onwards into the next year 2022.
Below we have the ocean temperature forecast for the Winter season, combined from multiple global long-range models. It shows a developed La Nina across the equatorial Pacific Ocean. It is slightly weaker compared to last year, but has a strong presence in the ocean and also in the atmosphere, as we will see in the winter forecast part of the article below.

We can compare the latest forecast with the forecast from September below. You can see the latest forecast shows a stronger La Nina than was initially forecast. This can have a big impact on the atmospheric pressure and temperature development across the world, as the ocean anomalies and their strength have a different impact on the seasonal weather.

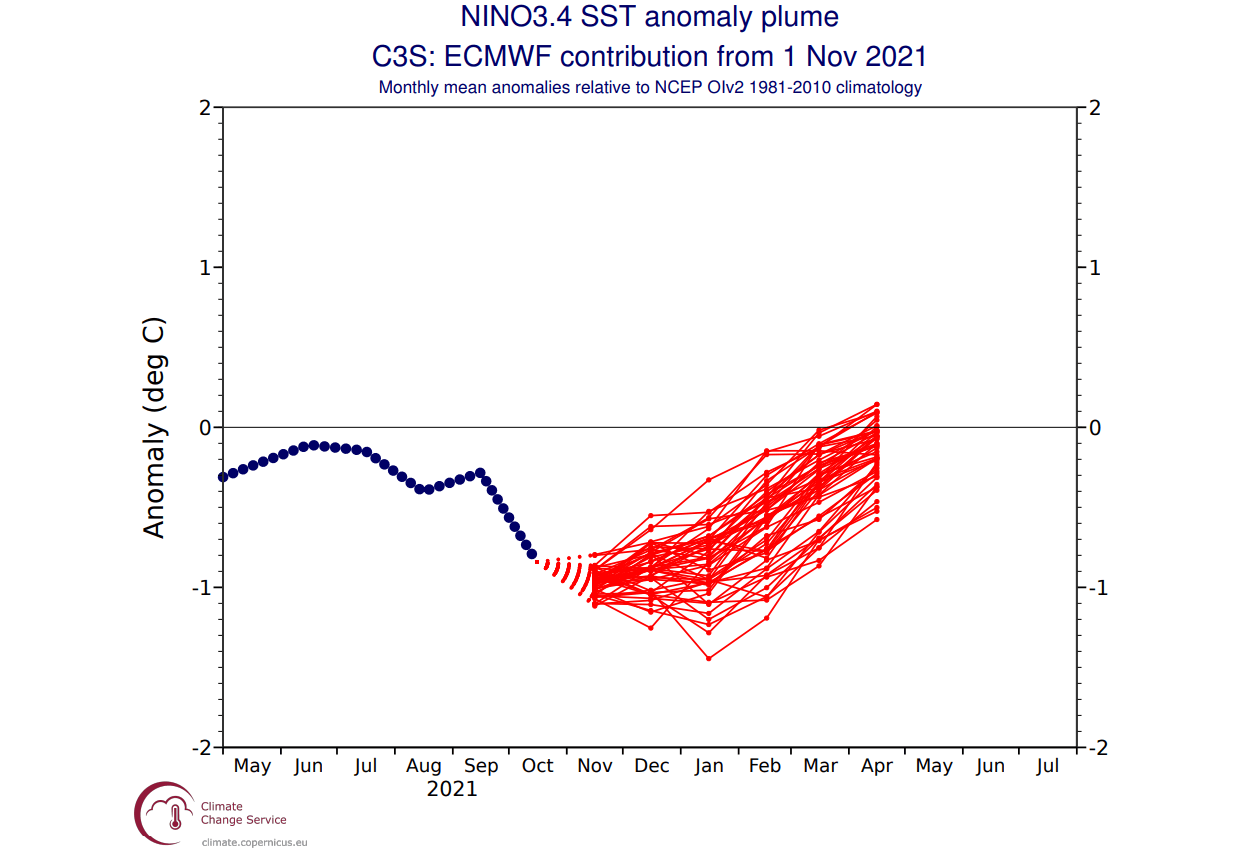
The ENSO region ensemble forecast below from ECMWF shows the La Nina starting to develop during late Summer, but cooling quickly over Fall, dropping lowest into Winter. We do see however a quick return to neutral conditions in early Spring. The rise, in the end, is quite rapid and if it continues, could lead to a warm phase (El Nino) in late 2022.
The ENSO forecast from the United States’ CFS model, shows a strong drop in temperature anomalies, but also a mid-Spring return to neutral conditions. Going into Summer 2022, there is an increasing chance of going into a warm phase (El Nino).
The CPC/IRI official probabilistic ENSO forecast shows the current La Nina holding on over the winter season into early Spring 2022. What is interesting is the transition into summer, where we do see the chances of an El Nino increasing, just like on both forecasts above. It is typical for a new phase to emerge in the Fall season, so seeing increasing El Nino chances during the Summer next year, is the first sign of a change.

The image below is an analysis and forecast image from multiple North American long-range models. It also shows the La Nina from last year weakening in Spring and a new one emerging in Fall. The forecast for this winter season shows the cold phase is expected to peak going into the winter season, with its influence reaching into early spring 2022.
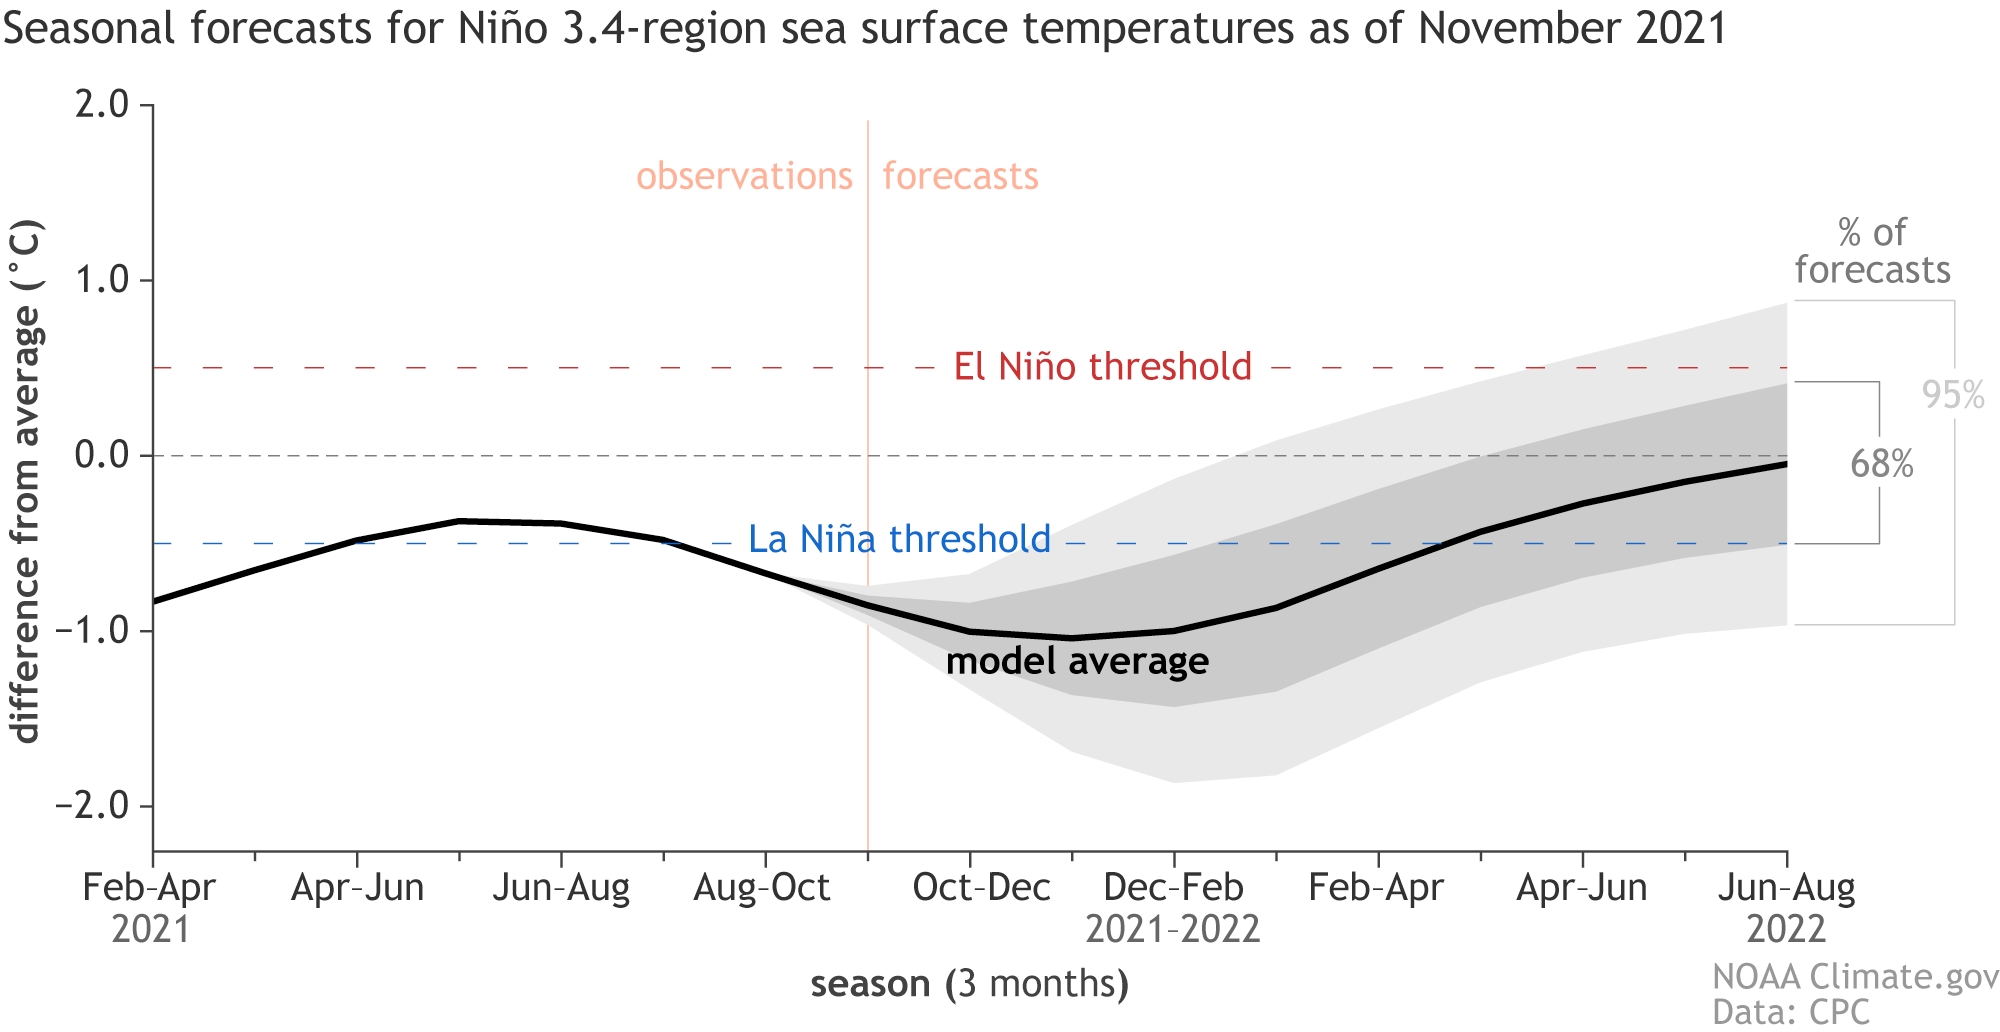
It also shows neutral conditions for next Summer, with 50/50 chances for either phase after. But it is unlikely to have a third-year La Nina, so chances are better for an El Nino emerging, compared to having another cold event.
The ECMWF extended seasonal forecast from November actually shows the developing warm phase (El Nino) during Summer 2022. ECMWF does these extended seasonal forecasts every few months. The next extended cycle is coming in February 2022, which will give a much better picture of what to expect for the next Fall/Winter season.

We now know that we might have to deal with an El Nino in 2022 and especially during the next winter season. So it’s time we look at how an El Nino actually differs from a La Nina both in the Ocean and in the Atmosphere.
LA NINA VERSUS ELNINO 2021/2022
To fully understand the ENSO, we also have to understand its phases, especially the El Nino. The forecasts are hinting at the emergence of an El Nino in 2022. This is why we will look at the main difference and weather influence of the El Nino versus a La Nina we are currently in.
On the image below we have a direct comparison between the El Nino and a La Nina in ocean temperature anomalies. Both examples show realistic data, from the 10 strongest events for each phase.
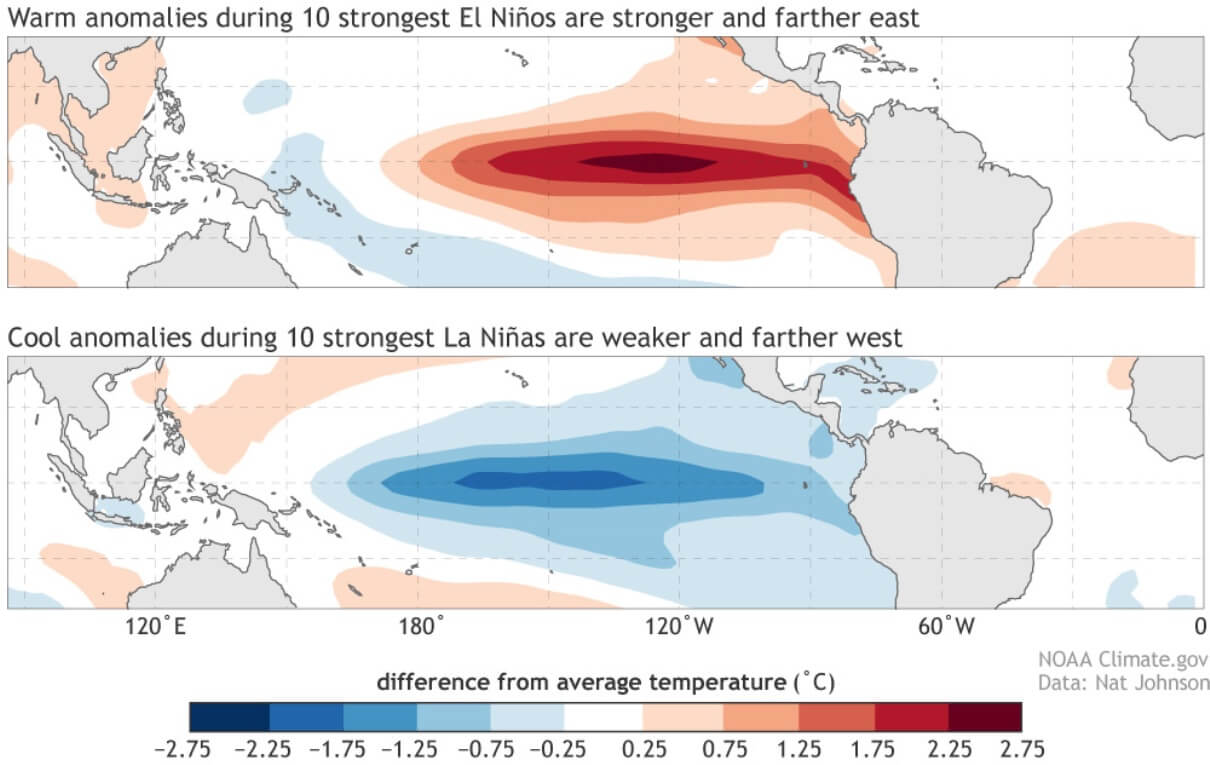
Typically, an El Nino features stronger anomalies, which are focused more on the eastern regions. On the other hand, a La Nina has weaker average anomalies, which peak more towards the central ENSO regions.
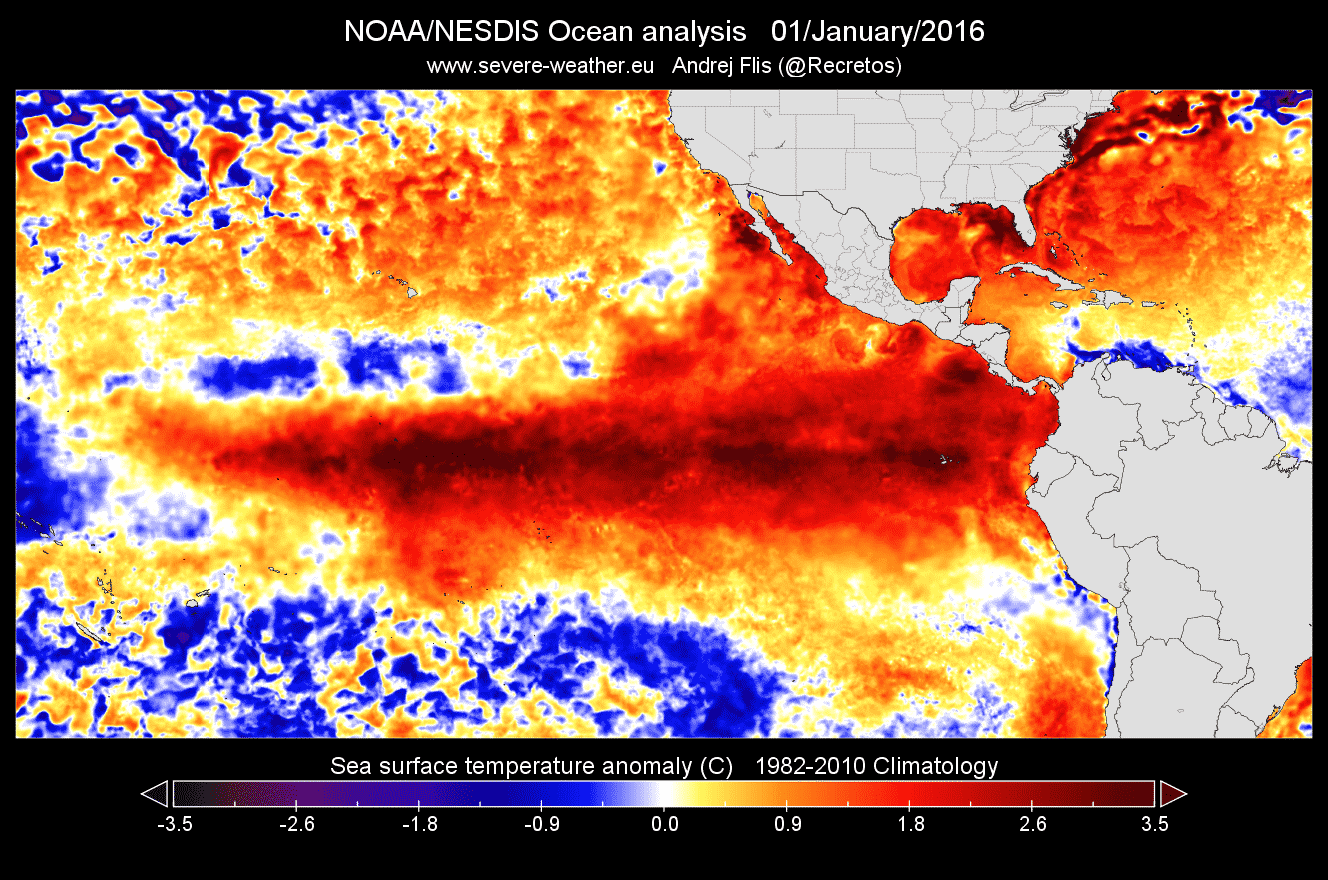
Below we have two real analyses of ocean temperature anomalies. First is the strong La Nina in October 2020. The second is the strong El Nino event of the 2015/2016 winter season.
We can see a completely opposite anomaly and two different phases over the same area of the ocean. Cooler than normal ocean temperatures during a La Nina, and warmer than average temperatures during an El Nino. As we will see later, their influence on the weather is also almost pretty much the opposite.

Below is the El Nino event during the 2015/2016 Winter season.
But besides the temperatures, one of the main differences is also in the pressure state. During an El Nino, the pressure over the tropical Pacific is lower, with more rainfall and storms.
But during a La Nina, the pressure over the equatorial Pacific is high, creating stable conditions and less precipitation. This obviously translates into the global circulation, affecting both Hemispheres over time.

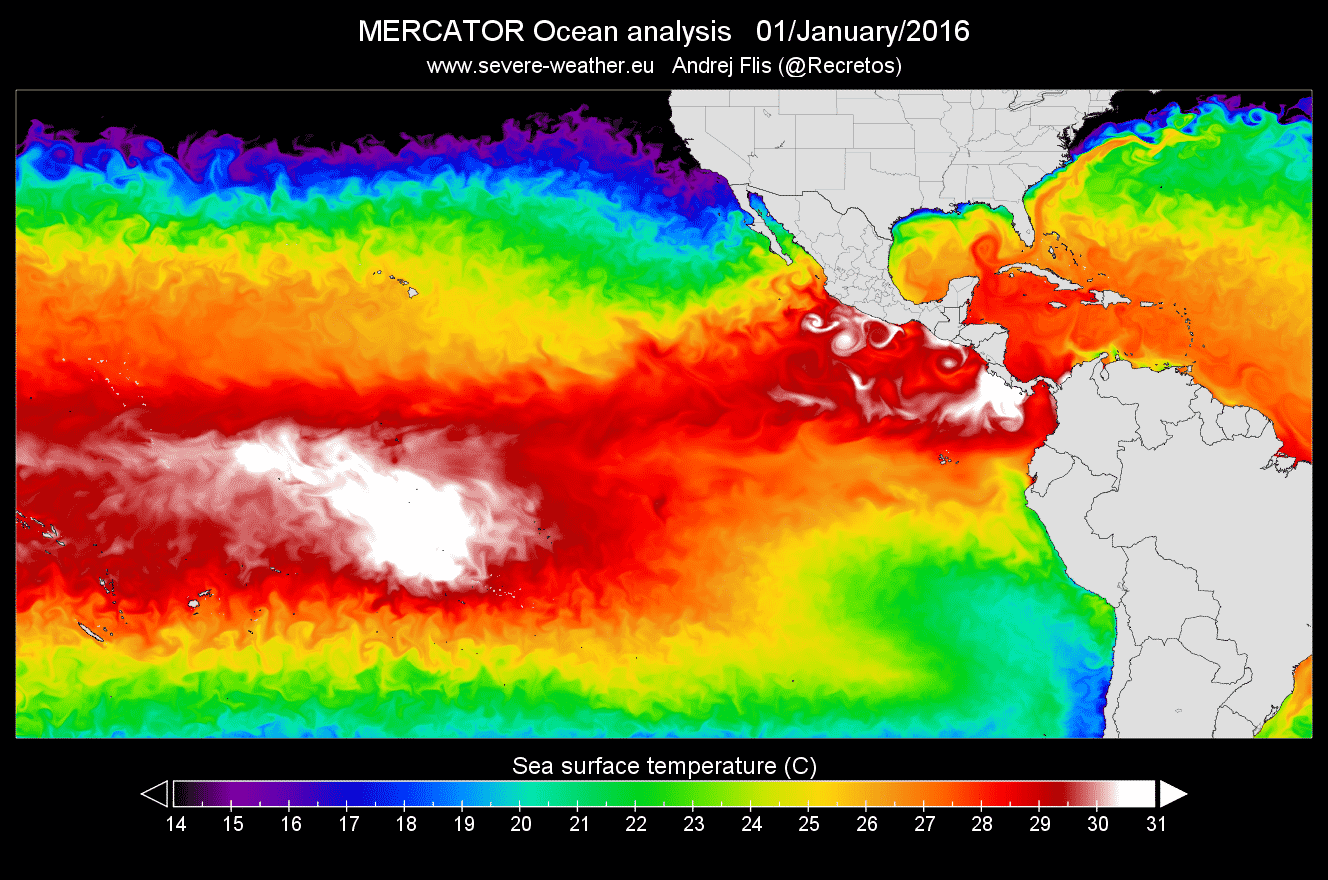
Looking at the actual temperature instead of the anomalies can also help to see a big difference between the phases. The first image below shows the sea surface temperatures of the new La Nina. The second image shows the temperatures during the strong 2015/2016 El Nino event.
Obvious again is the “cold tongue” of cooler ocean waters during a cold phase, which is driven by the stronger easterly trade winds. The ocean temperature difference between the La Nina and El Nino can be quite large, up to 10 degrees Celsius in some places.
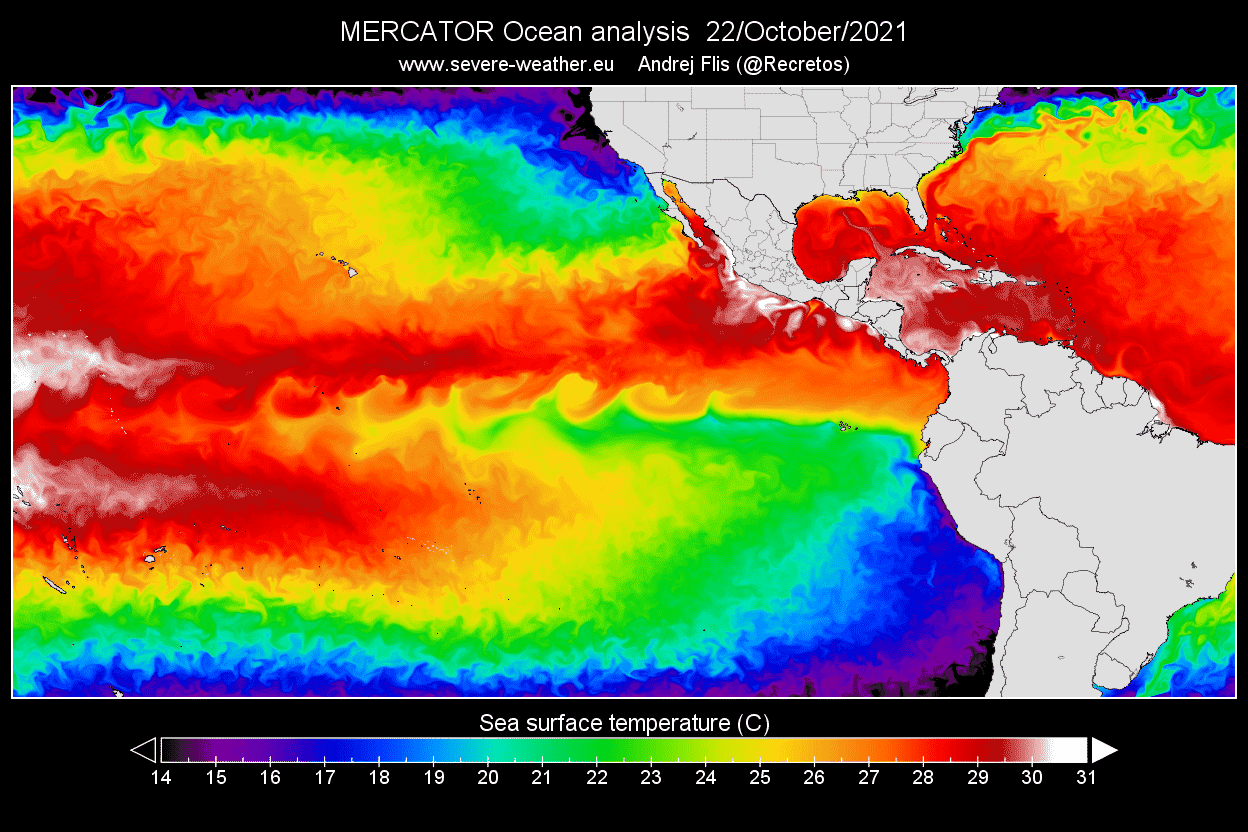
You can briefly see a very weak “cold tongue” also in the warm phase below, but it is very suppressed and much weaker than normal. This cold tongue is actually normal due to persistent easterly trade winds. But it is much stronger during a La Nina and much weaker during an El Nino, due to pressure changes affecting the intensity of the trade winds.
Strong trade winds are also important because they affect the food chain in the tropical Pacific regions and on both American continents. Strong trade winds mean that deeper and cooler water rises up to the surface, replacing the water that was “pushed away” by the winds.
This process is known as “upwelling.” Essentially this is a vertical transport process, as shown in the image below, which transports cooler waters and nutrients to the surface.
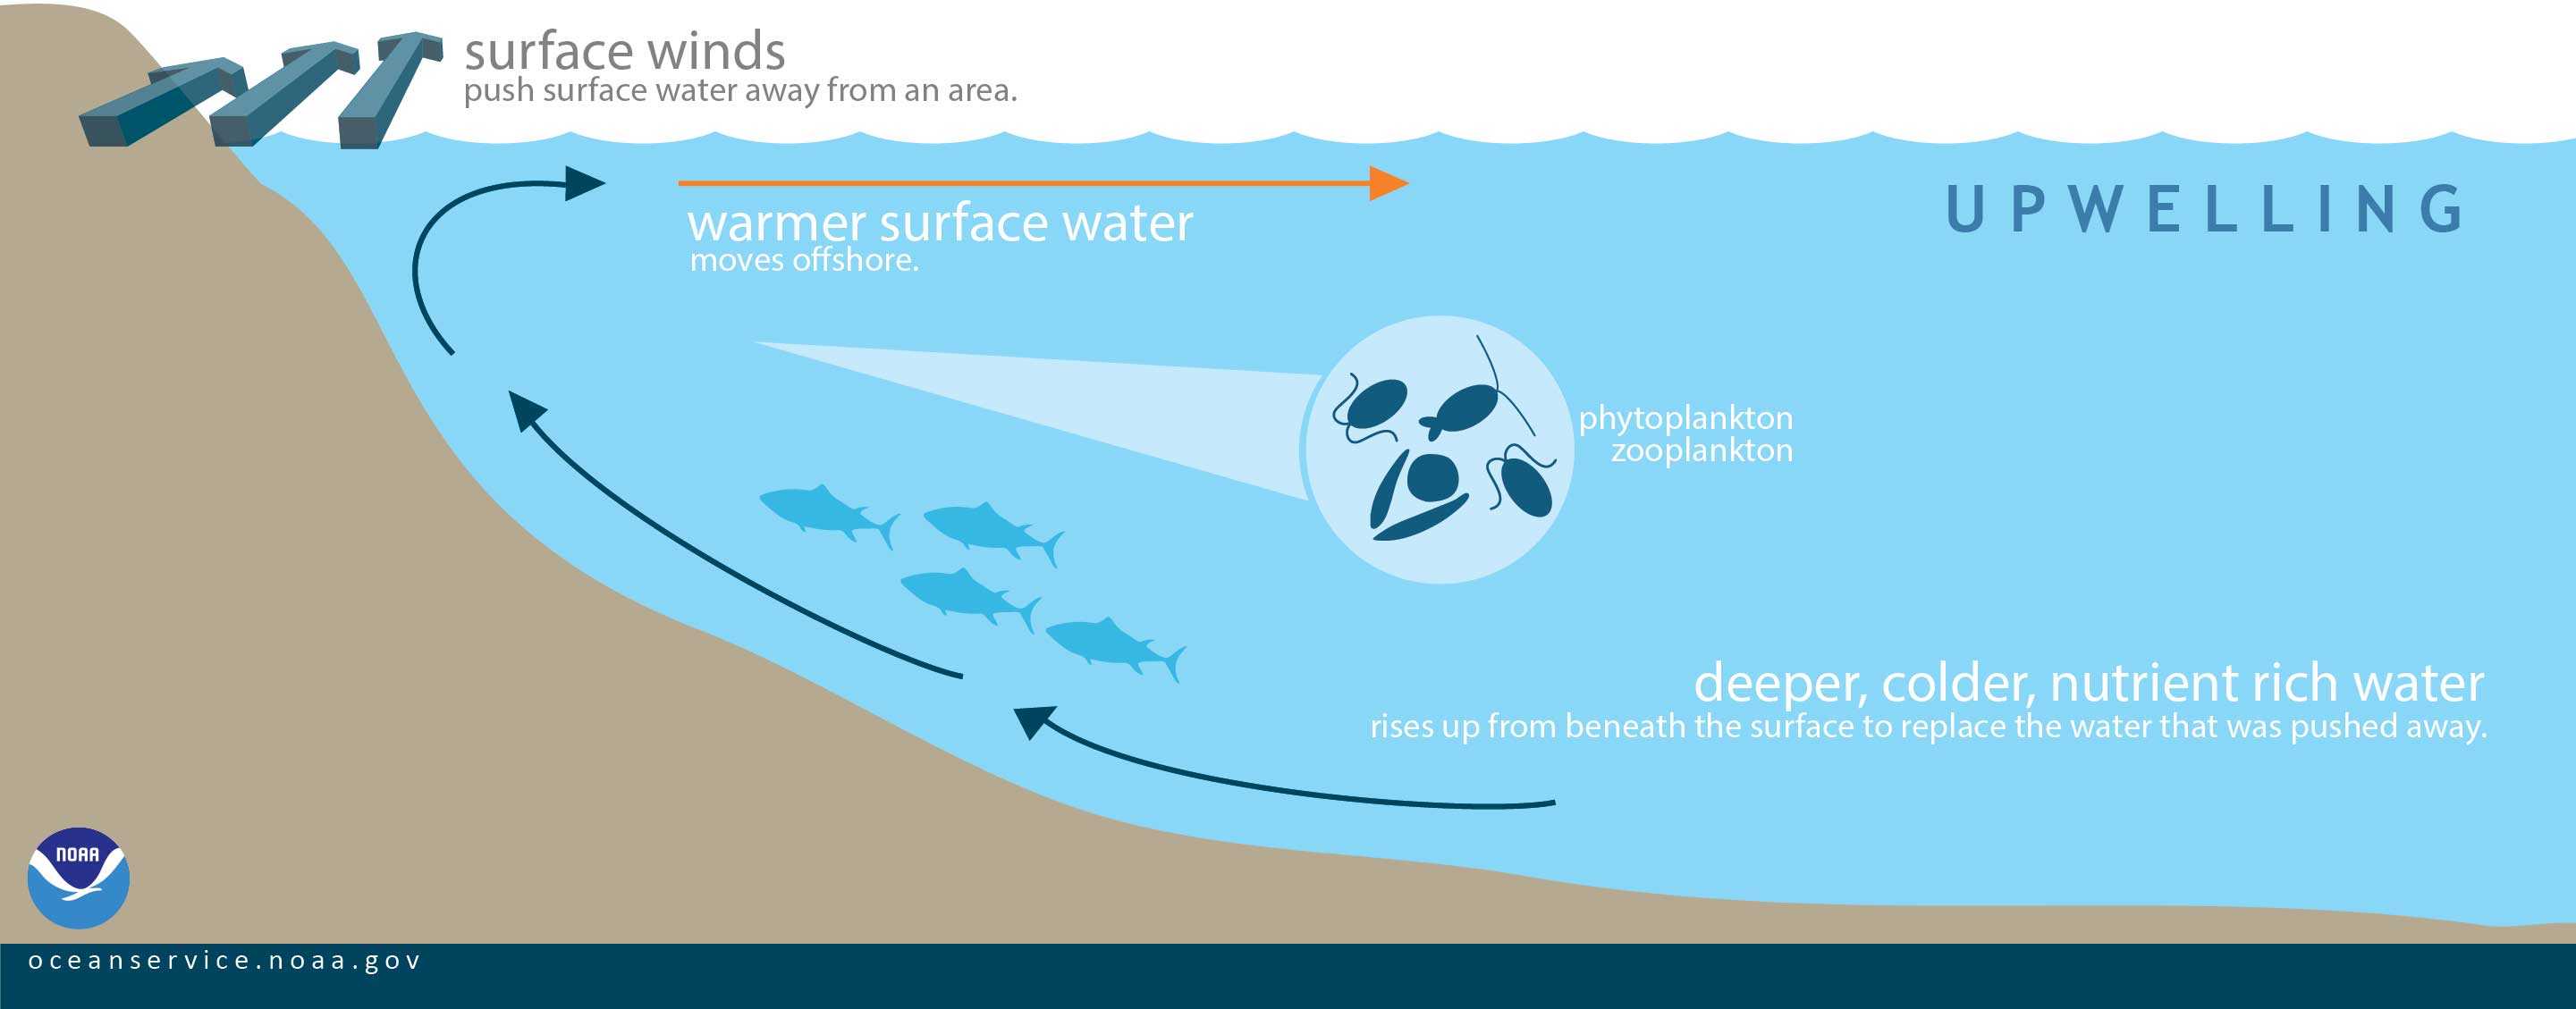
Water that rises to the surface as a result of upwelling is typically colder and is quite rich in nutrients. These nutrients can “fertilize” the surface waters.
This means that these surface waters often have high biological productivity. We can track that by looking at the amount of chlorophyll (phytoplankton) in the ocean.
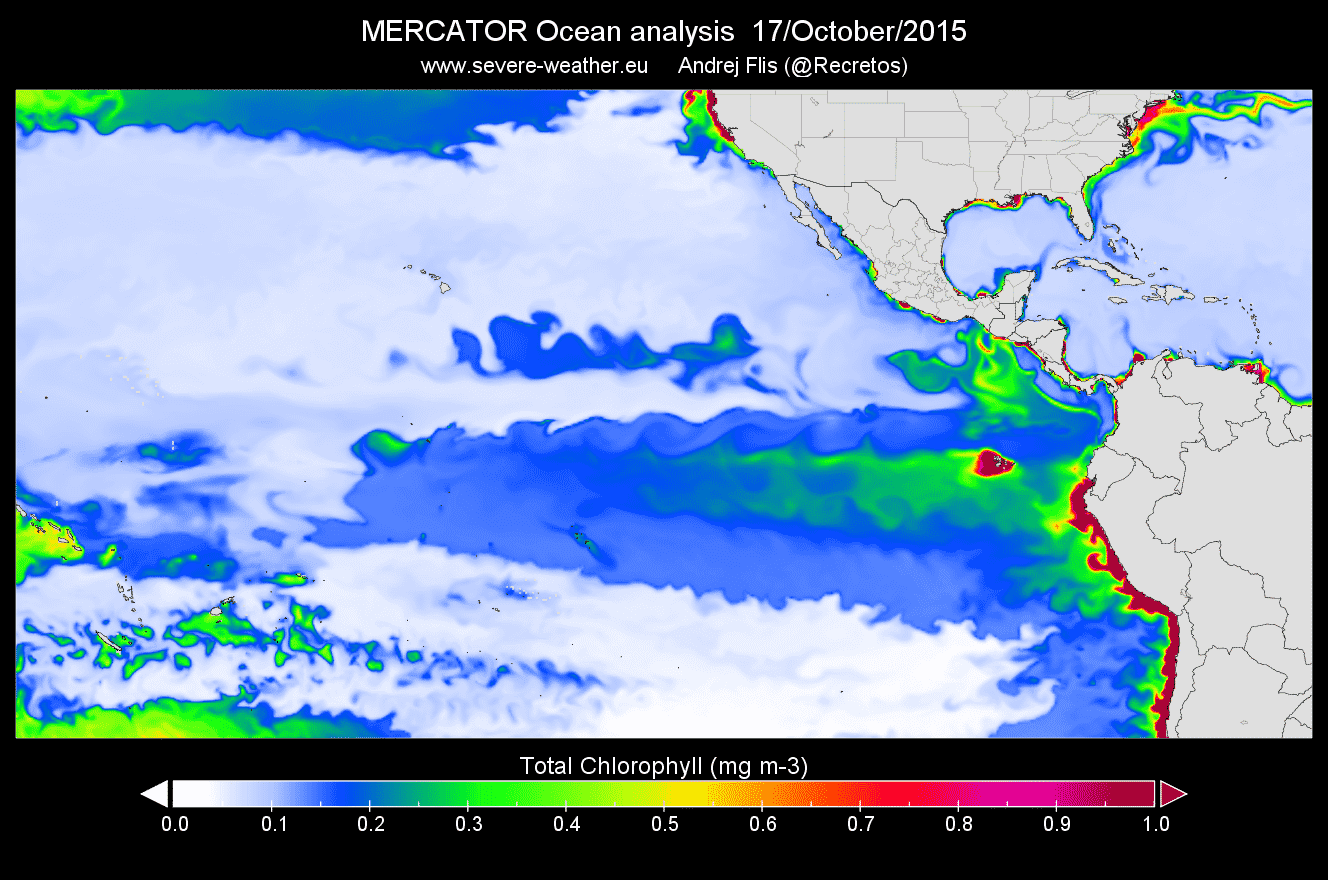
The comparison below shows the Chlorophyll concentrations in the last La Nina (first image) and during the same period in the 2015 El Nino event (second image).
We can see that during La Nina, much more nutrients are available along the entire ENSO region, and also by the coastal areas of Middle and South America. This means more food is available for the fish, helping to bring a good fishing season to the eastern equatorial Pacific and the surrounding regions.

Below are Chlorophyll concentrations during an El Nino Fall season, exhibiting lesser concentrations than during a La Nina season.
We can see this upwelling effect directly when comparing the temperature by depth during a La Nina and an El Nino event. The first image below shows the water temperature by depth during the 2015/2016 El Nino event. We can see much warmer waters in the upper-ocean layer, and cooler waters staying deeper down.

But the subsurface analysis of the current La Nina event shows a much different picture. You can nicely see how the 20°C threshold is much closer to the surface during a La Nina. This is due to the upwelling effect, as the trade winds cause the deeper colder water to rise towards the surface.
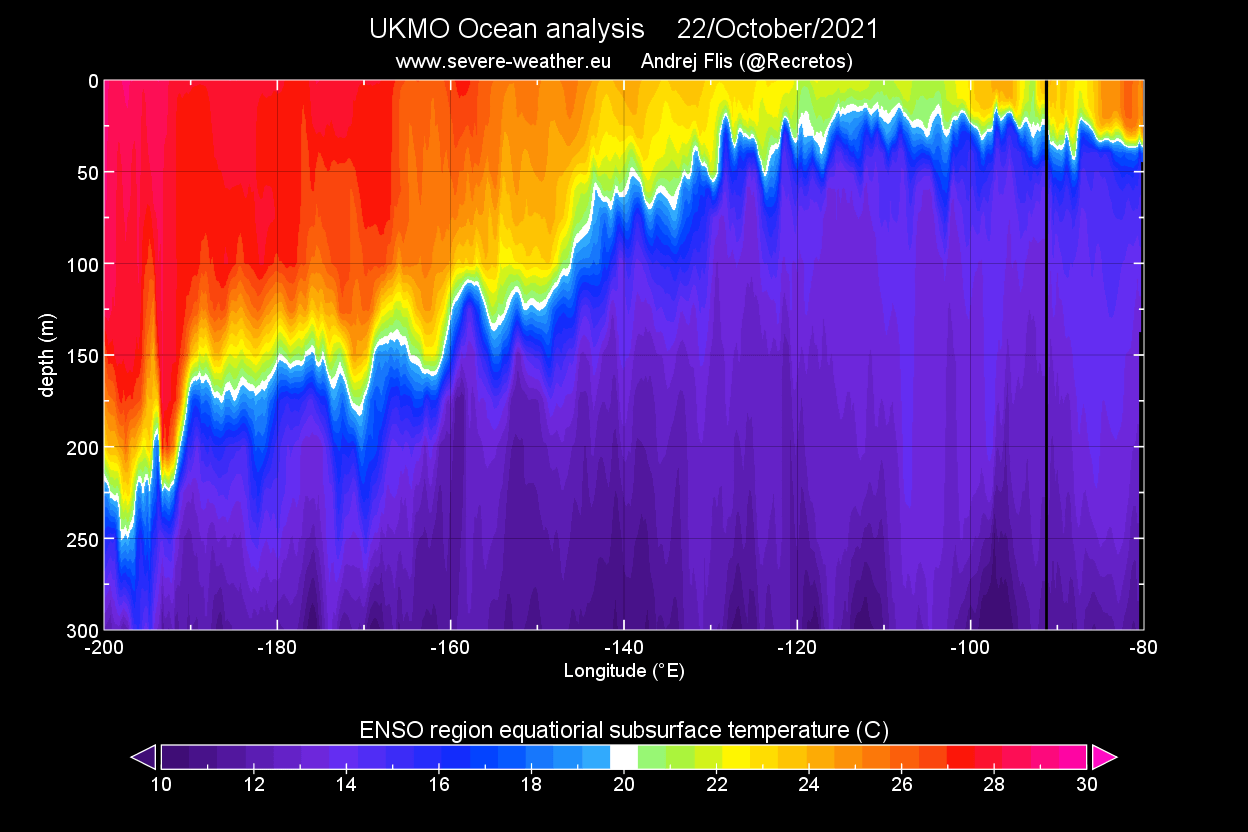
The layer between the warmer and colder waters is called the “Thermocline”. This is a thin layer where the ocean temperatures drop significantly, separating the upper warm and deeper cold layers. In an El Nino, the thermocline layer is pushed deeper. That is due to the warmer waters from the west entering the region, warming the upper-ocean layers.

LA NINA VERSUS EL NINO IN WINTER SEASON
Here we have to add an important point that an ENSO phase is not just a pure “influencer” for our weather. It can also be viewed and interpreted as somewhat of a response to the overall global state of the atmosphere.
Almost like a “warning light” on the dashboard of a car, the ocean anomalies can tell us what is going on with the global circulation. But generally, ENSO does exhibit an important influence on the Jet stream in the Pacific Ocean, and consequently also downstream and upstream around the world.
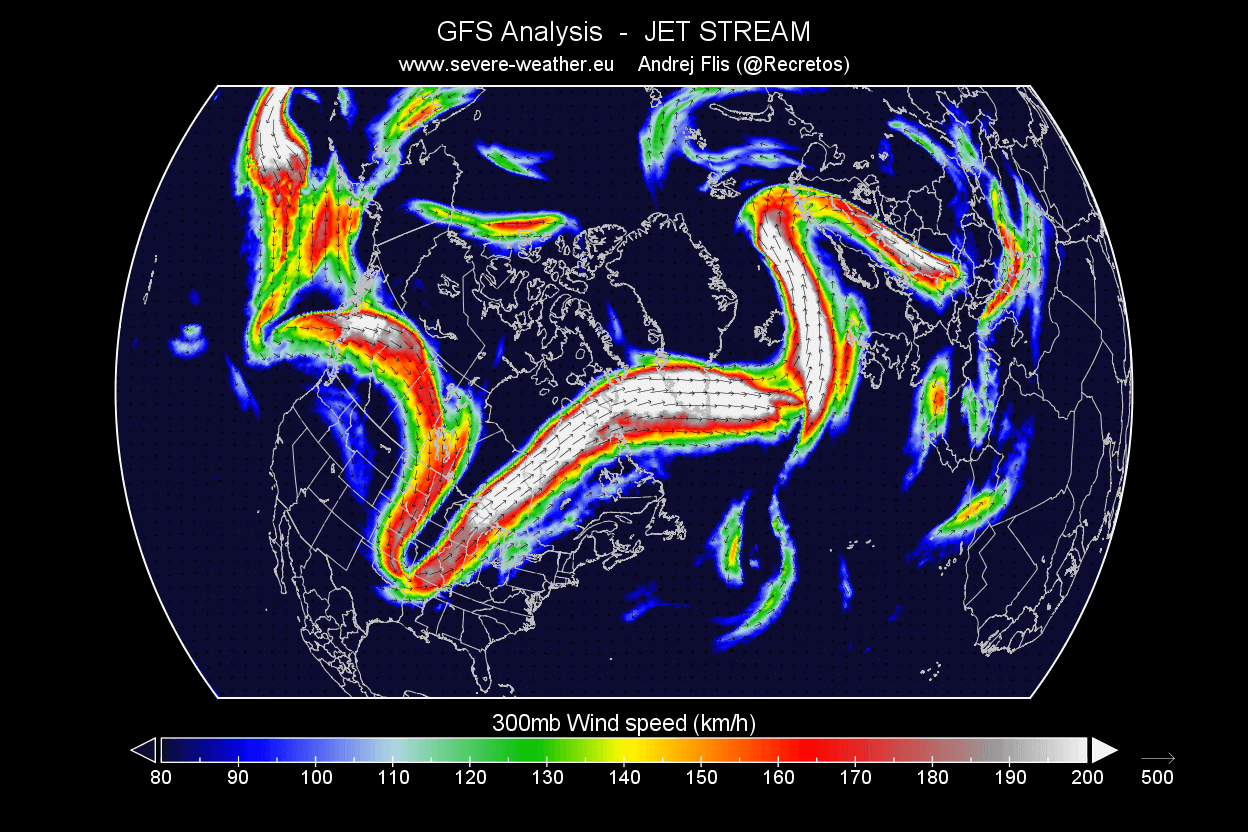
The jet stream is a large and powerful stream of air (wind) at around 8-11km (5-7mi) altitude. It flows west-to-east around the entire Northern hemisphere, affecting the pressure systems, their strength, directly shaping our weather at the surface.
Below is an example of the jet stream in winter at the 300mb level (9km/5.6mi altitude). In this example, the jet stream is curved quite far down over the central United States, which brings colder air down from the north. It is curved upwards over northwestern Europe. Such formation brings colder weather to the central United States and stormy weather to Iceland and the British Isles.
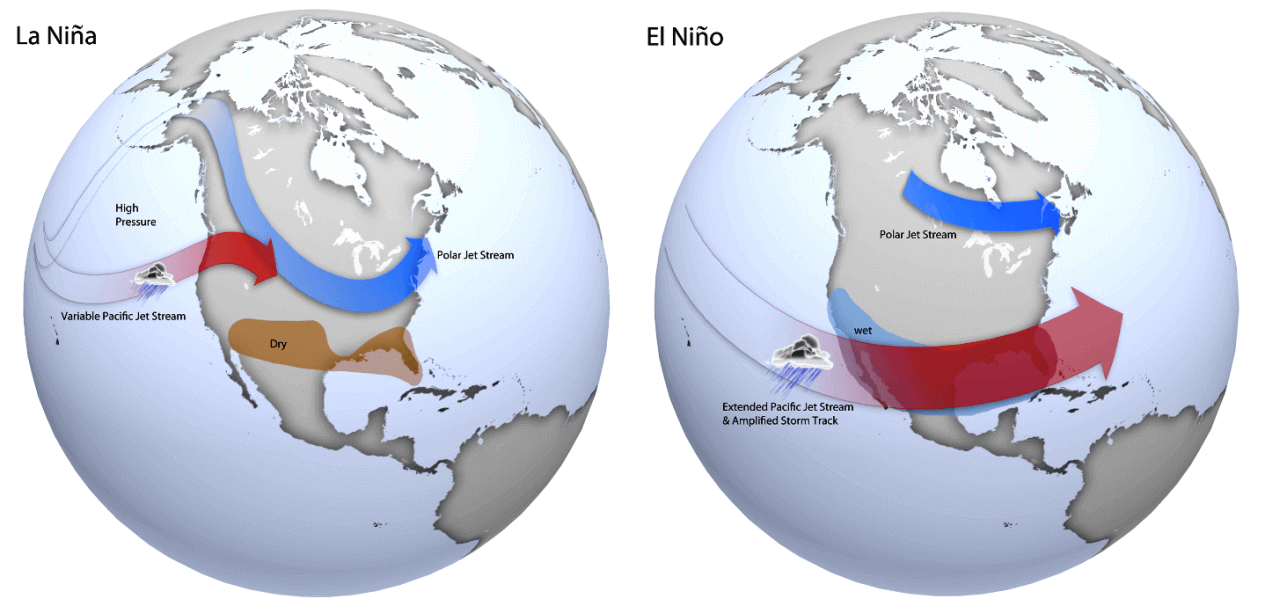
Comparing the two phases of the ENSO on the next image below, we can see that they typically produce an entirely different winter weather pattern across North America. We will focus on this region as they have a major/direct influence on the position of the jet stream over the continent.
La Nina features a stronger and extended polar jet stream from Alaska and western Canada down into the United States. But the El Nino features a stronger Pacific jet stream and an amplified storm track over the southern United States.
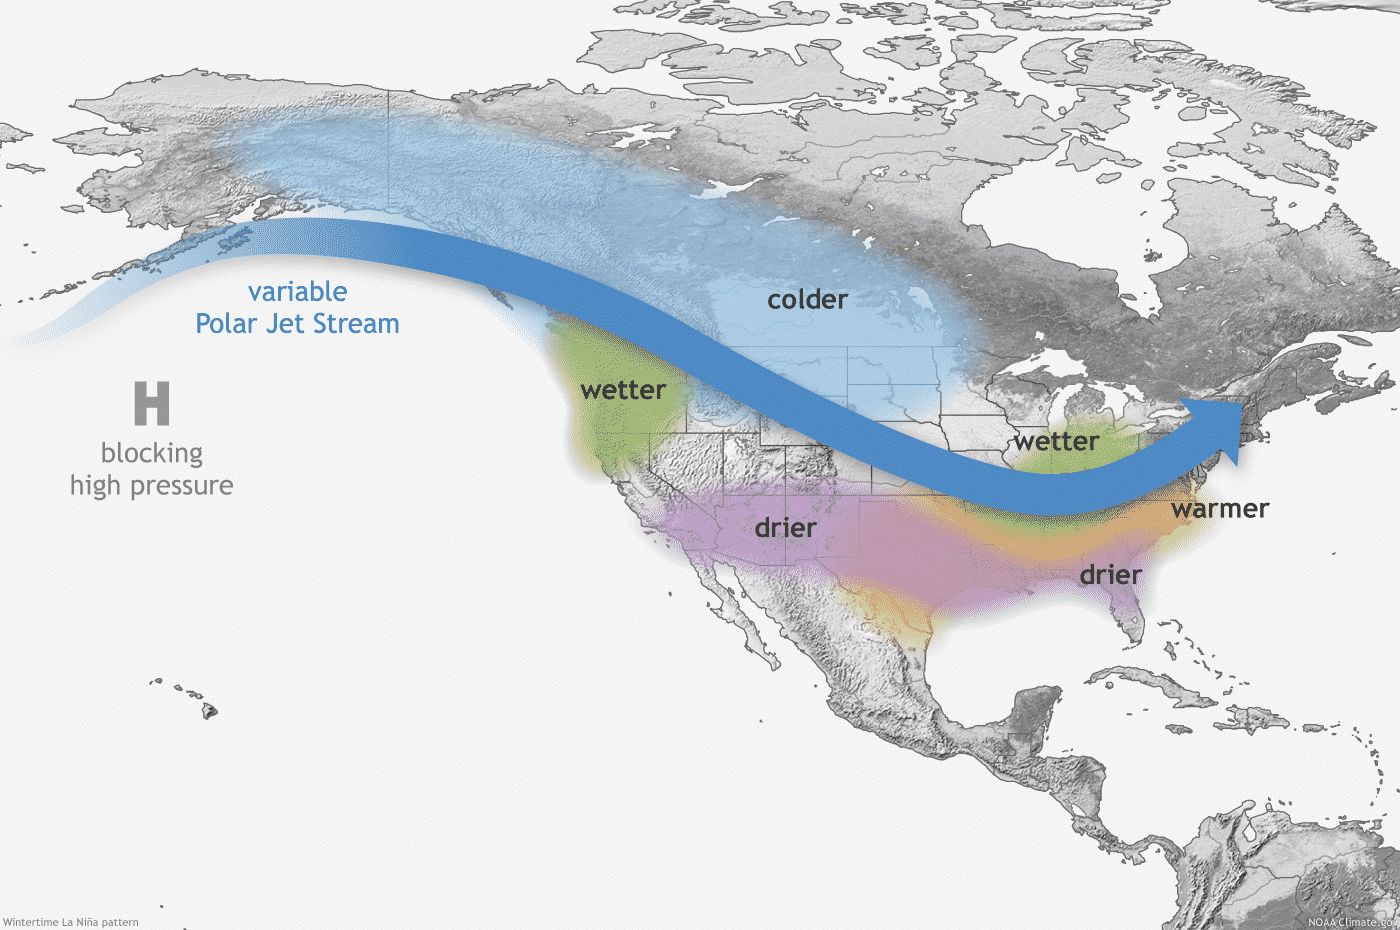
Looking closer at La Nina below, we can see that its main feature is a strong and persistent high-pressure system in the North Pacific. That usually bends the jet stream from the northwest down to the southeast, creating a dipole weather pattern over the United States.
Alaska, western Canada, and the northern United States typically experience colder than normal winter, with more precipitation. Southwestern and the southern United States usually experience warmer and a bit drier conditions during La Nina winters.
The shifted jet stream also means a different snowfall potential over the continent. The colder air is more easily accessible to the northern United States, which also means that it has an increased snowfall potential during a La Nina winter. Especially areas like Alaska, western Canada, and the northern United States benefit from the northerly jet stream to produce more snowfall. The graphic below is by NOAA-Climate.

But during an El Nino winter season, we have a strong and persistent low-pressure area in the North Pacific. That pushes the polar jet stream further to the north, bringing warmer southerly flow to the northern United States and western Canada. The southerly Pacific jet stream is amplified, bringing storms with lots of precipitation and cooler weather to the southern United States.

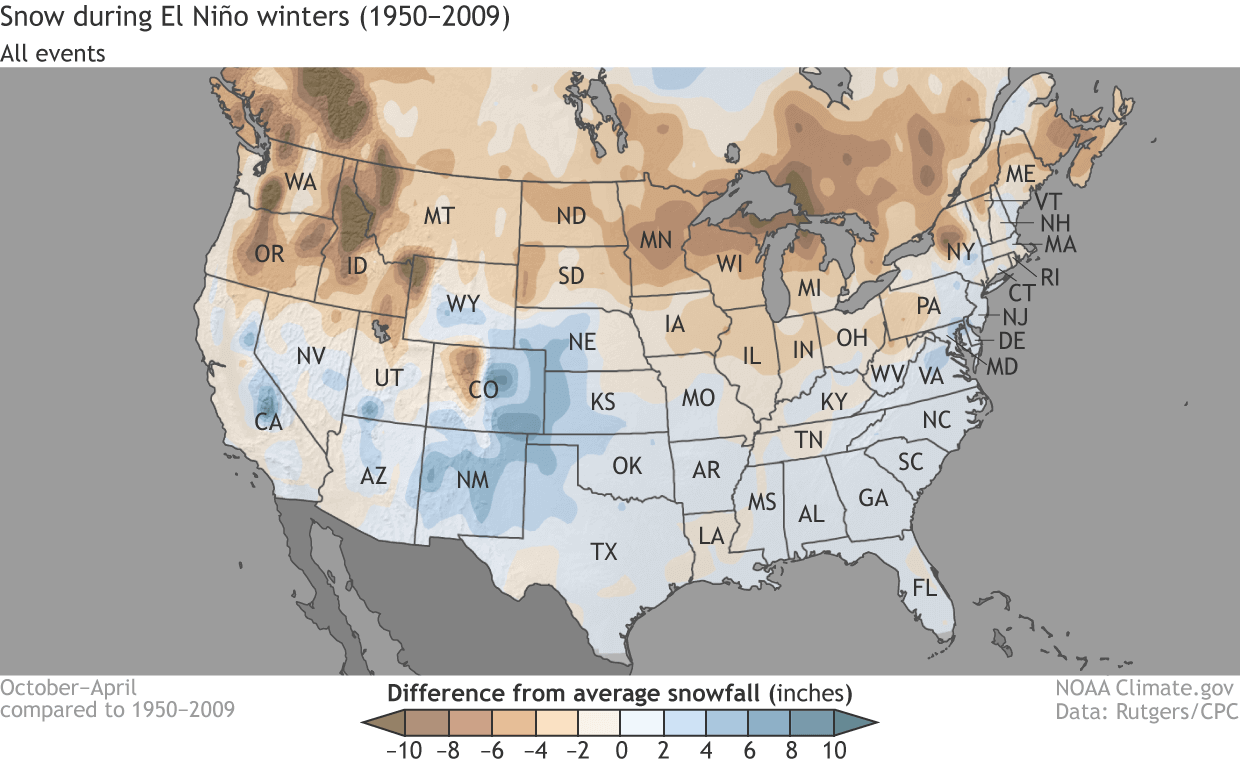
Looking at snowfall during the El Nino winters, we can see a much different picture than with the La Nina. There is less snowfall in the northern United States during the El Nino winter season. The conditions are mostly warmer than normal and drier than normal in the north. But there is more snowfall in the west-central United States and in the parts of the eastern United States.
After passing Canada and the United States, both the polar and the subtropical jet streams move out into the Atlantic. There are different paths they can take from there.
A lot depends on the overall circulation pattern and the existing pressure systems in the North Atlantic. This is where ENSO generally perhaps loses its direct influence for Europe, as regional systems in the Atlantic take over.
But it usually still has an important influence, as it changes the position of the entering jet stream from the west. The incoming jet stream can merge with the systems in the Atlantic, helping to create a whole new weather pattern for Europe. The problem is that the final outcome is far more unpredictable in this zone than over North America, which feels a much more direct and predictable influence.
WINTER SEASON 2021/2022 LA NINA INFLUENCE
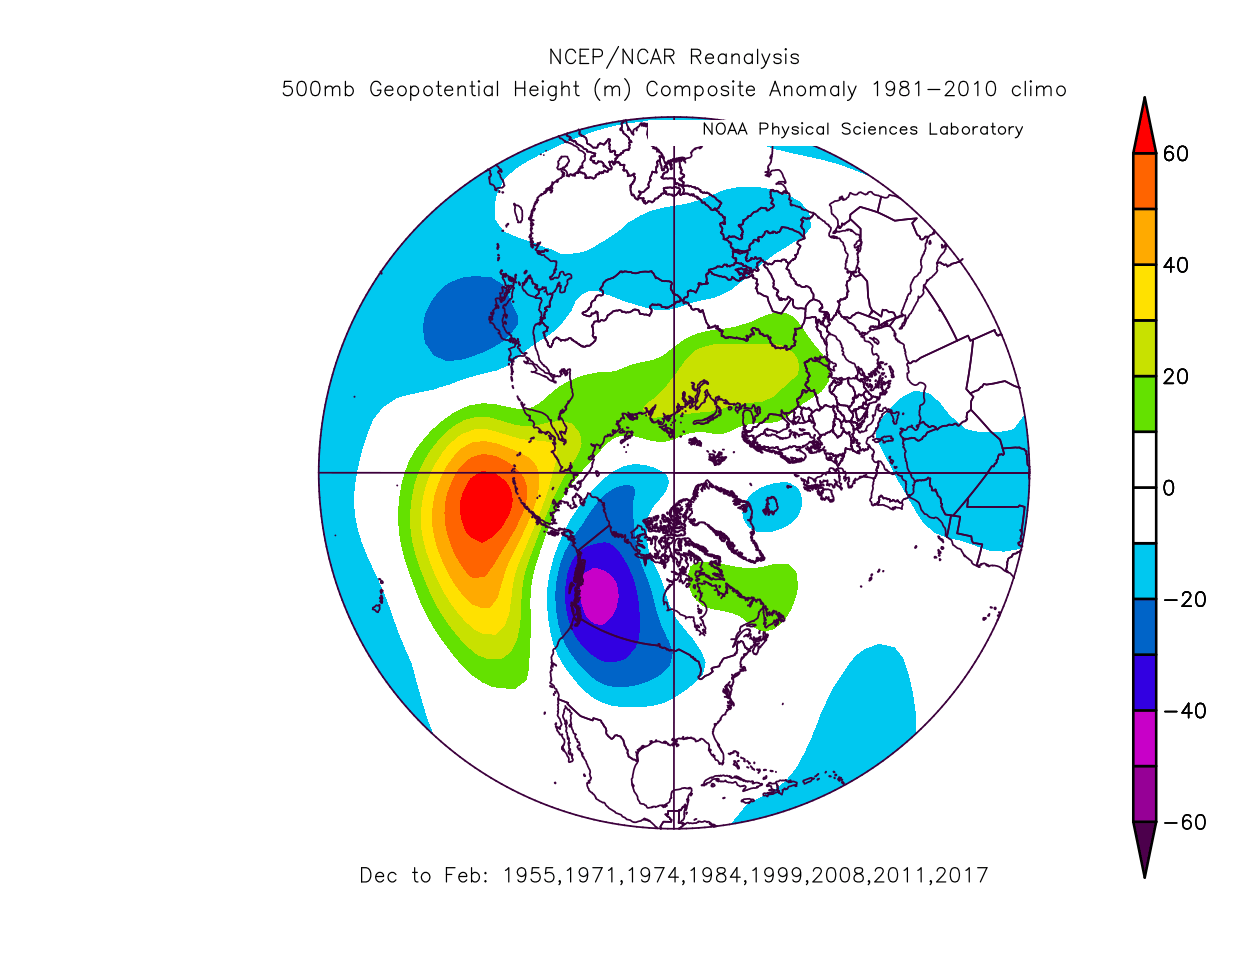
We have seen that the main feature of La Nina winters is a strong high-pressure system in the North Pacific. On the image below you can see the average winter pressure pattern during second-year cold events in the past decades like we will have this winter season.
The main takeaway is the strong high-pressure system in the North Pacific, sending the polar jet stream over the northern United States. We have seen that on the previous images above, which is the typical La Nina weather response.
In the pressure pattern forecast from ECMWF below, we can see the typical La Nina high-pressure system in the North Pacific. The low-pressure system is developed over western Canada and the jet stream is bending in between the two pressure systems, just like we have seen in the previous segment.
We also see the North Atlantic in a positive North Atlantic Oscillation (NAO) mode, which means an amplified jet stream over the British Isles and into Scandinavia. It results from a lower pressure over Iceland and Greenland and higher pressure over the central North Atlantic.
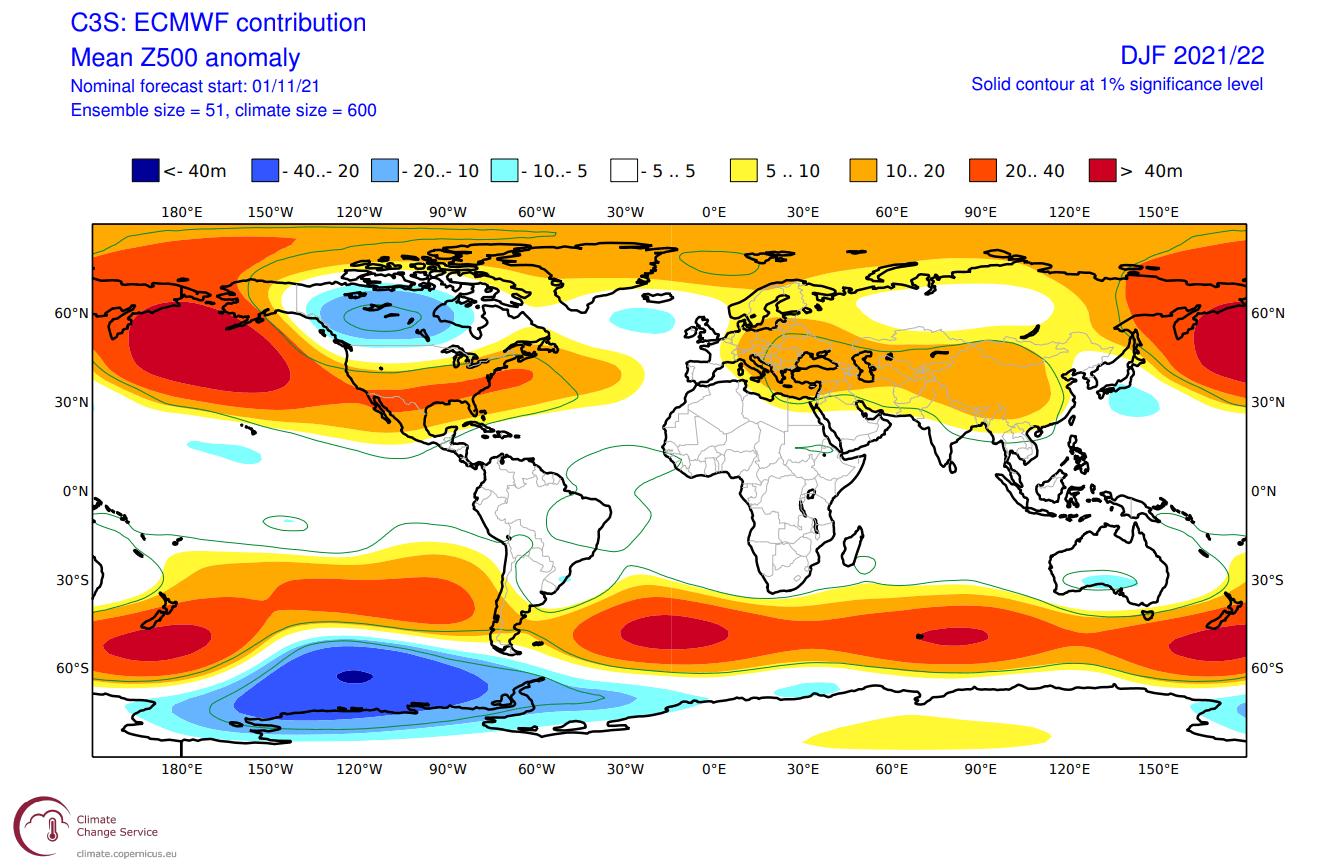
But this is not a typical positive NAO setup and is also a weaker one. It still allows for winter situations over Europe. Most likely if the high-pressure system in the central Atlantic can crawl further up the North Atlantic for a while, creating a more northerly flow into Europe.
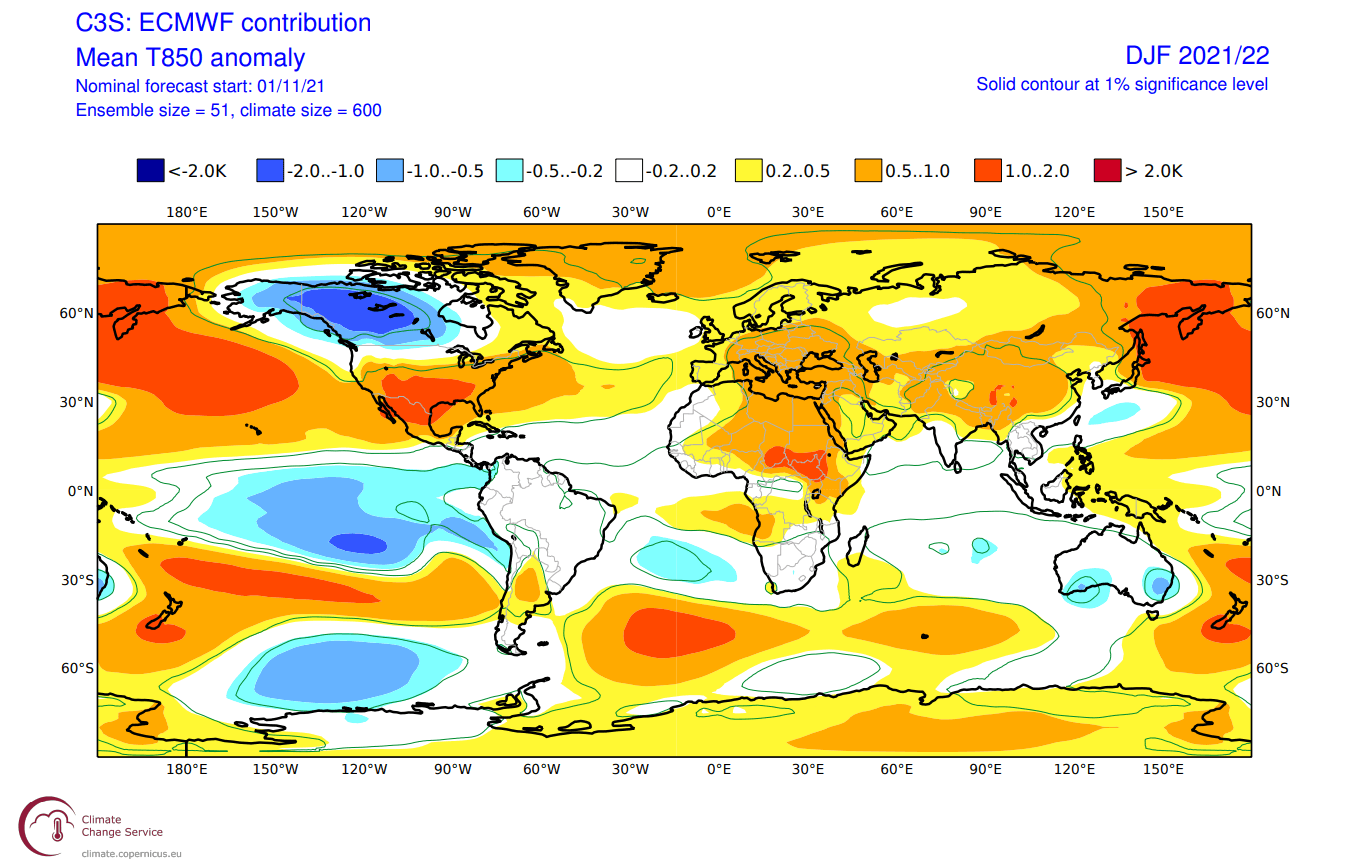
The airmass temperature forecast below shows North America divided into two parts. Western and central Canada is forecast to be colder than normal. Thanks to the polar jet stream, there is a high chance of the colder air extending south, into the parts of the northern United States and over the Midwest, and into the northeastern United States. The Southern United States is forecast to be warmer than normal.
Europe also features higher than normal temperatures. A more westerly flow dominant scenario is suggested, but the pressure pattern does allow for a break in the flow. Occasional cold flow from northwest Europe is possible down into the central regions.
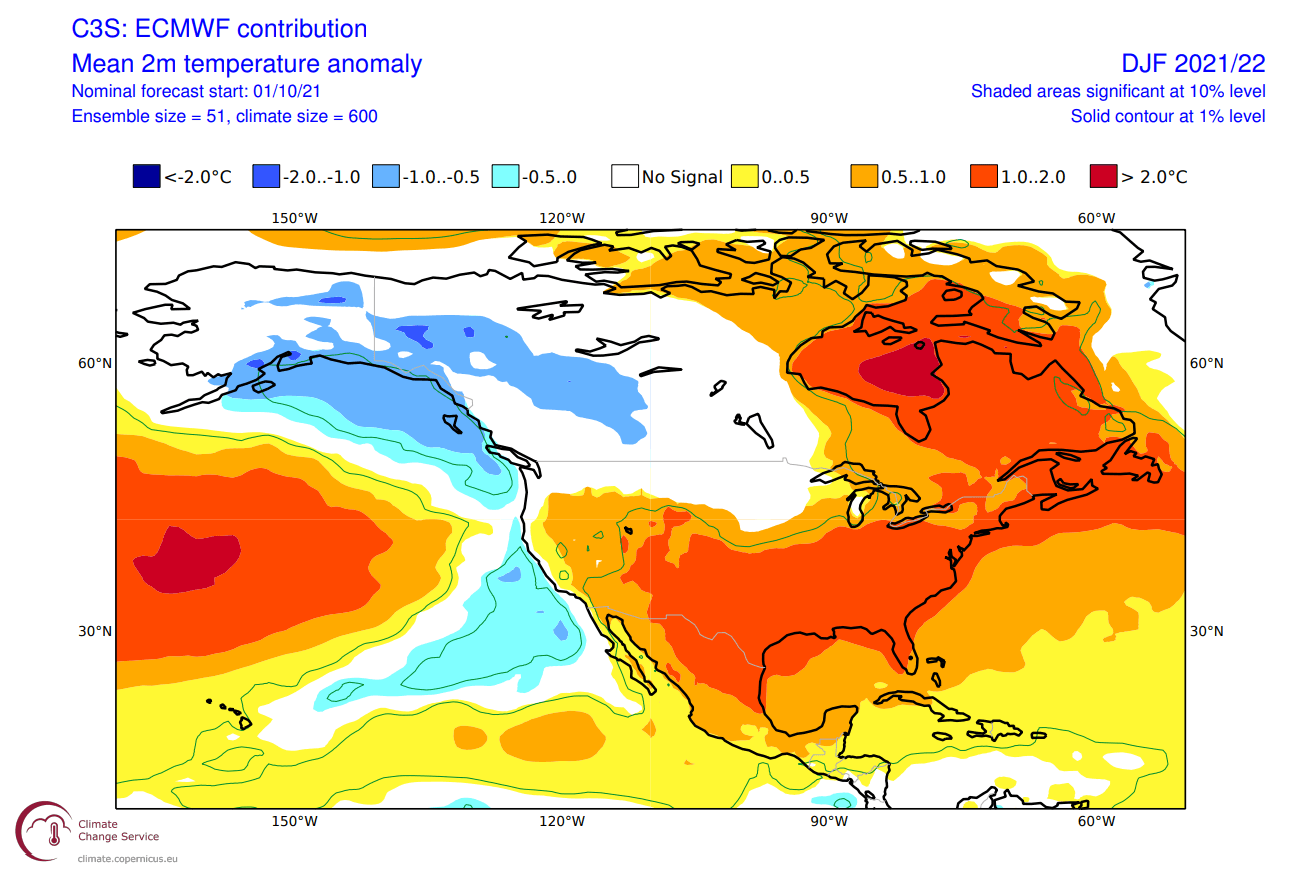
We will look closer to the ECMWF surface temperature forecast over North America, as it feels a more direct La Nina impact. The forecast shows colder than normal temperatures over much of Alaska and western Canada.
We do see an indication of colder air intruding down into the northwestern United States and can extend into the Midwest. Warmer than normal temperatures are forecast for the southern United States.
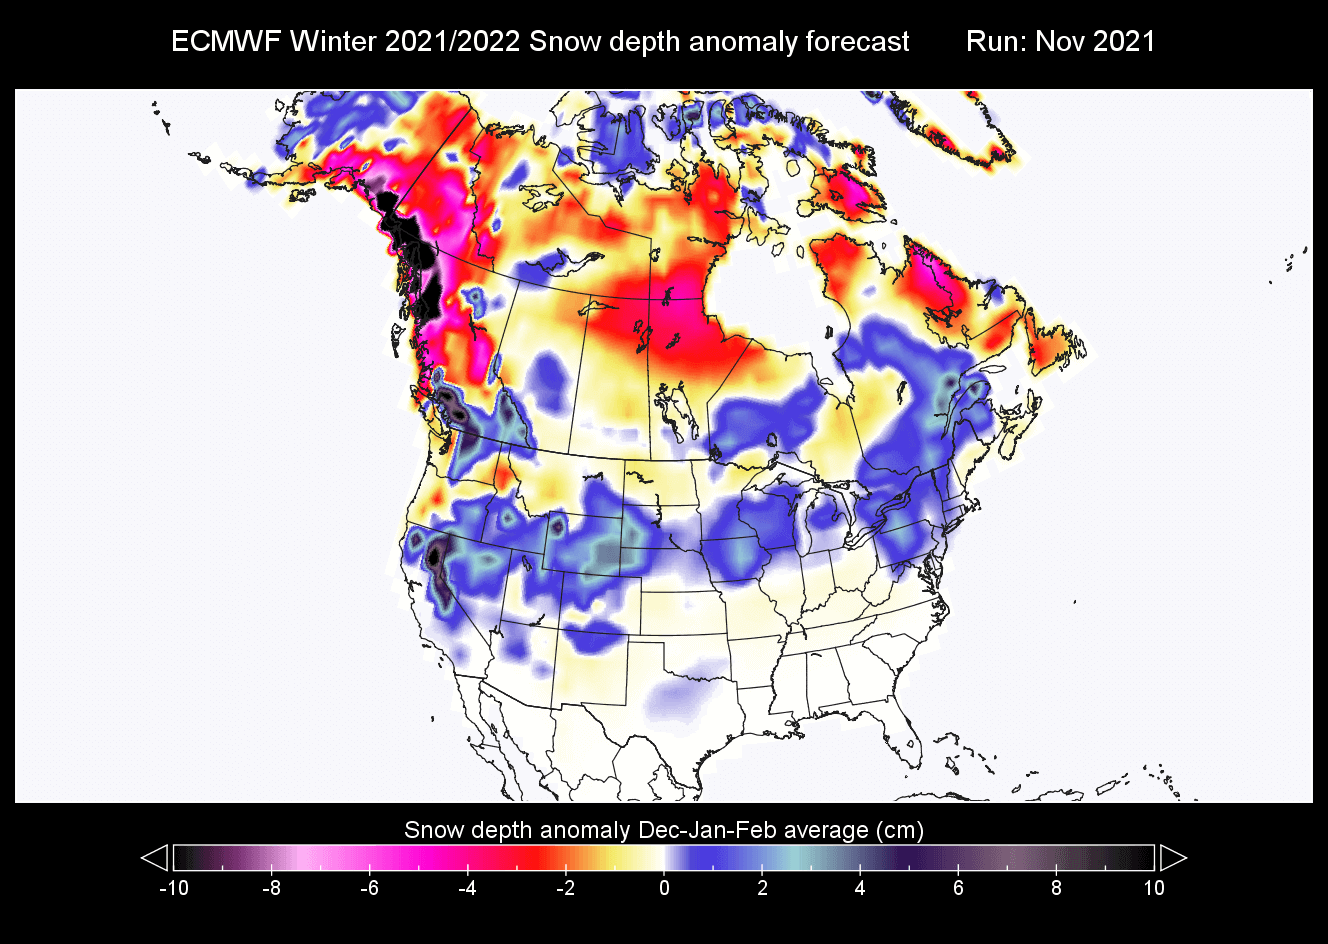
Over North America, we see a very interesting snowfall forecast in the image below. ECMWF suggests more snowfall than usual in most of the northern United States, especially in the western states.
The increased snowfall potential continues over the Midwest and into the northeastern United States. We can also see a small extension of more snowfall down into the south-central regions. This is a similar scenario to a typical La Nina influence over North America in the winter season.
Below we have the official temperature forecast for the United States by NOAA. It shows the temperature probability, with colder to equal chances in the northern United States. The southern half of the country and the northeast have a higher probability of warmer than normal weather, which we saw in the models above. This is the expected scenario in a weak to moderate La Nina event.

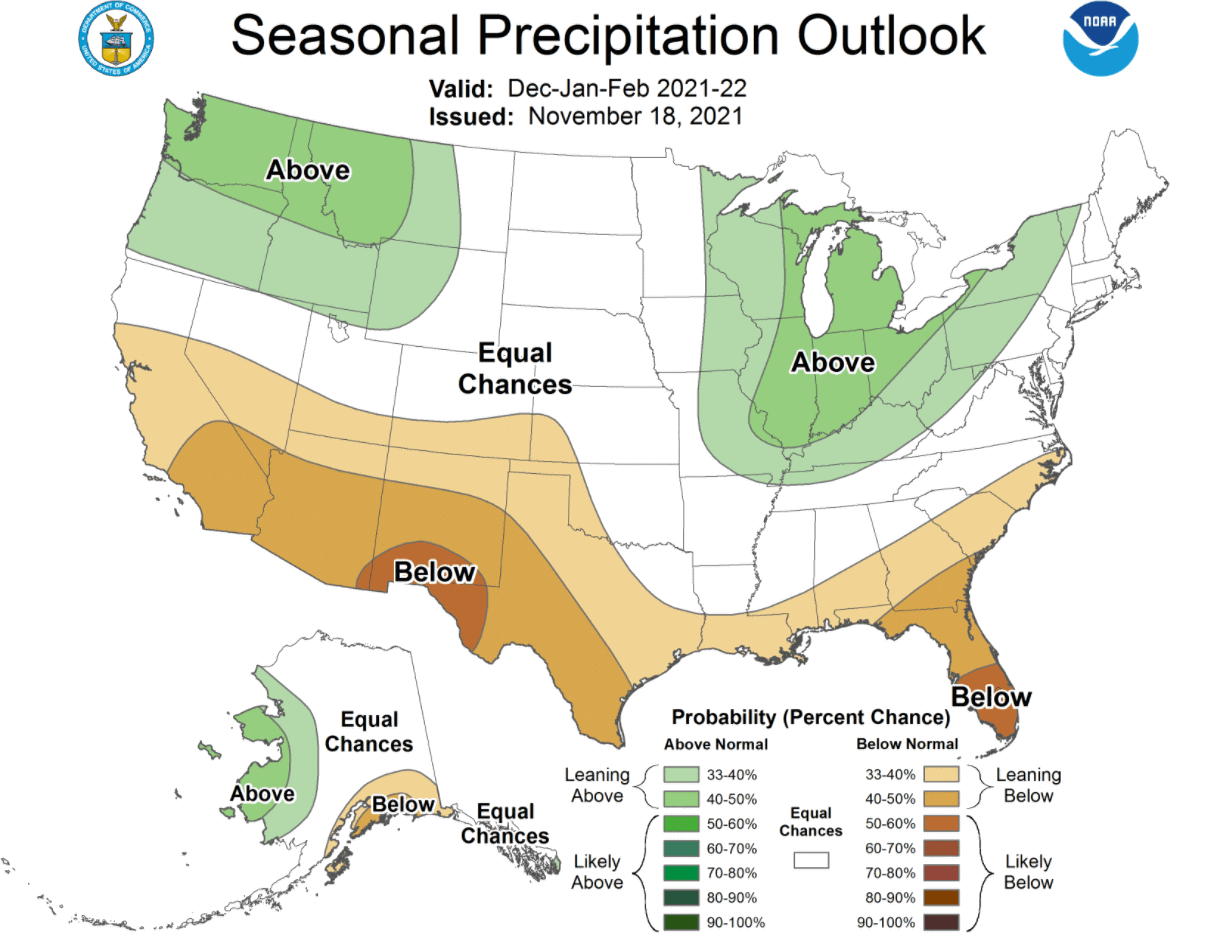
The official precipitation forecast also shows an obvious La Nina influence. We see an equal-to-higher probability for more precipitation (and snowfall) in the northwestern and the northeastern United States. The Southern United States is forecast to have a drier than normal winter season.
Both the actual weather and the forecast show a clear sign that the La Nina is showing a strong presence, exerting its influence on the winter season in the United States and the entire Northern Hemisphere in one way or another. The confidence is growing for a very different winter season between the northern and the southern United States.
We will keep you updated on the state of the La Nina and it’s Winter 2021/2022 weather influence, so make sure to bookmark our page. Also, if you have seen this article in the Google App (Discover) feed, click the like (♥) button to see more of our forecasts and our latest articles on weather and nature in general.