Latest analysis and forecast data show a pressure anomaly descending in the Stratosphere, a direct result of the recent Stratospheric Warming event and the Polar Vortex disruption. A breakdown of the lower circulation is now forecast, releasing cold Polar air into the United States, Canada, and Europe.
The Polar Vortex is usually the “keeper” of cold, locking it into the polar regions. But when it’s properly disrupted, it can unleash the cold air, creating proper winter weather across the mid-latitudes.
We will first quickly look at the Stratospheric Warming event and the disruption of the Polar Vortex. Then you will see how those events are now playing into the weather patterns, enabling a cold air release into the United States, Canada, and Europe, and why it can last deep into January.
THE LARGE POLAR VORTEX
Despite its ominous name, the Polar Vortex is not hard to understand. In simple terms, the Polar Vortex is a name for the broad winter circulation over the northern (and southern) hemispheres.
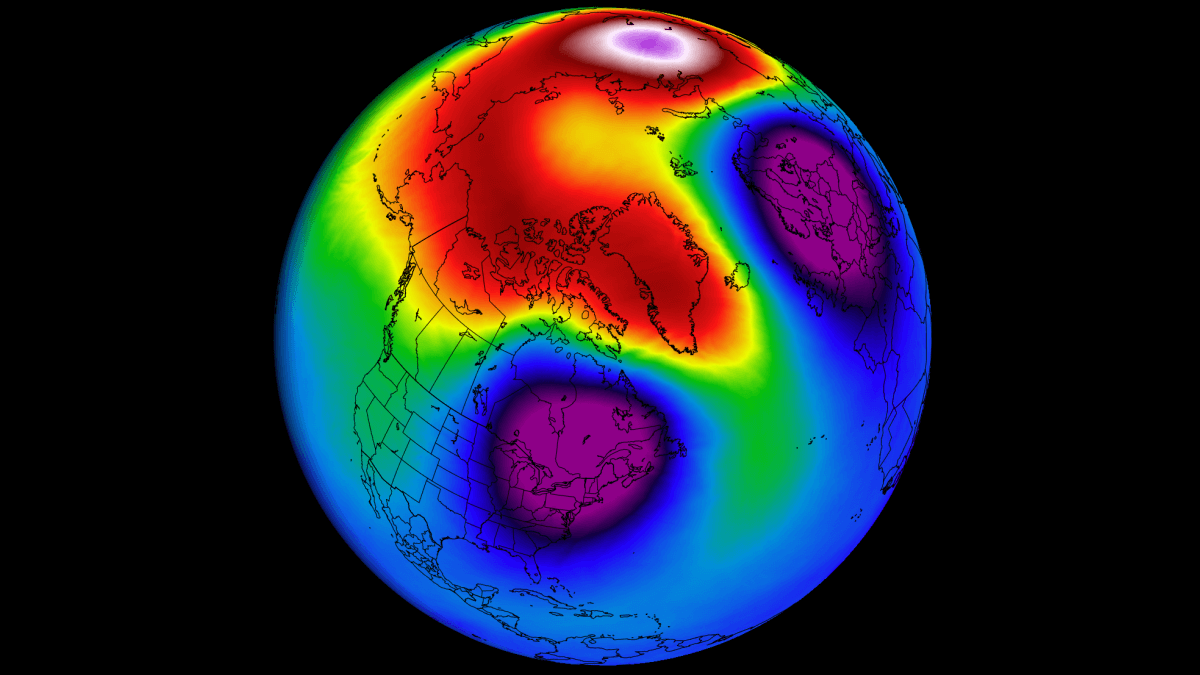
You can imagine the Polar Vortex as a cyclone (or a spinning wall) over the polar regions. It rises from the surface into the stratosphere (over 50km/30miles high), containing the cold polar air inside.
As you can see in the image below, there are two atmospheric layers that we monitor at all times around wintertime: the stratosphere and the troposphere. The first is the higher layer, and the second is at a lower altitude. The Polar Vortex rises through both layers, but with different strength, shape, and impacts.
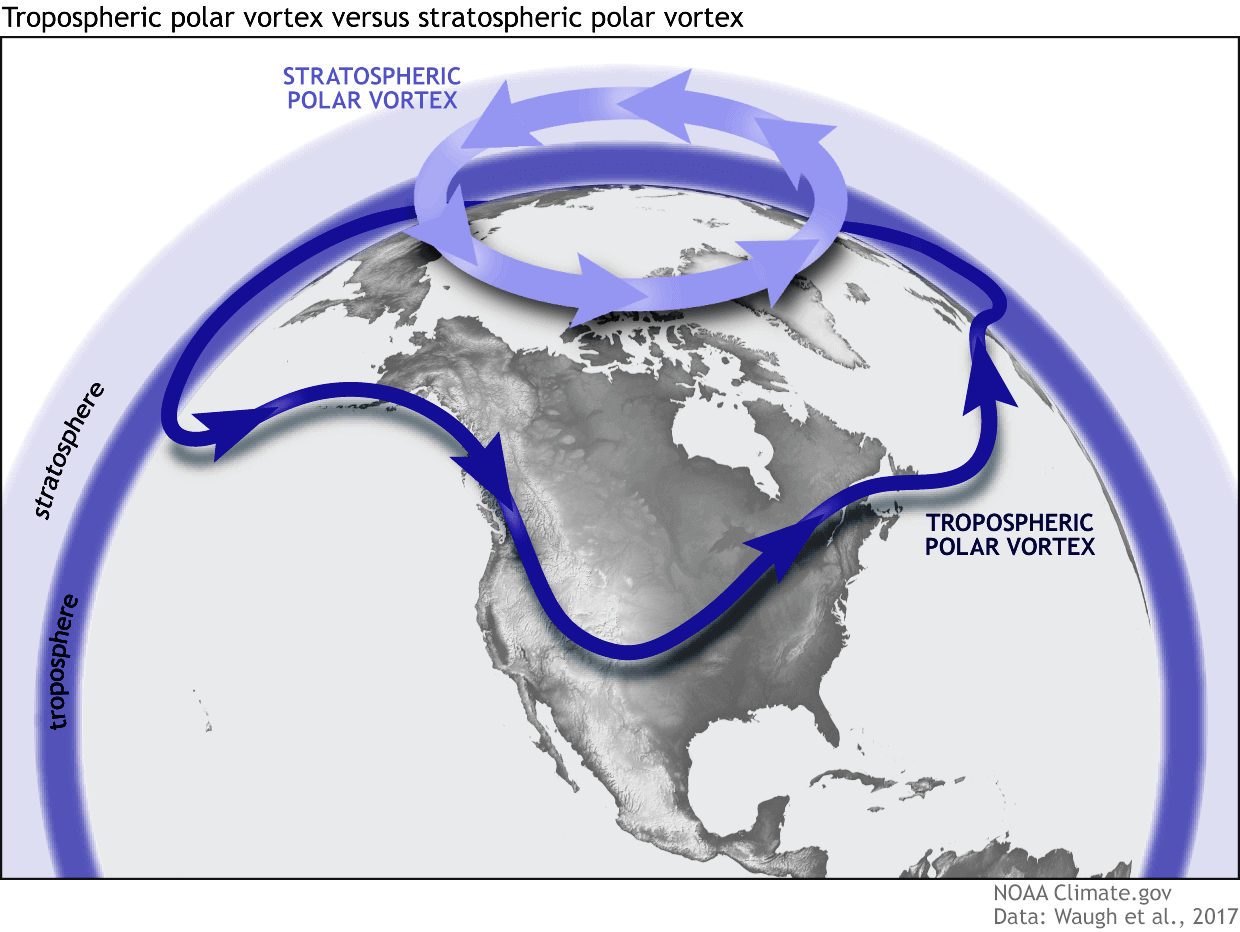
For this reason, we separate the entire Polar Vortex into an upper (stratospheric) and a lower (tropospheric) part. A strong Polar Vortex can lock the colder air into the polar regions, preventing its escape. This creates milder conditions for most of the United States, Europe, and other mid-latitudes.
But when the Polar Vortex is disrupted or fully collapses, it can no longer contain cold air, which can now easily escape from the polar regions into the United States and other mid-latitude regions. Below is an example of how a disrupted Polar Vortex brings cold polar air into the United States and Europe.
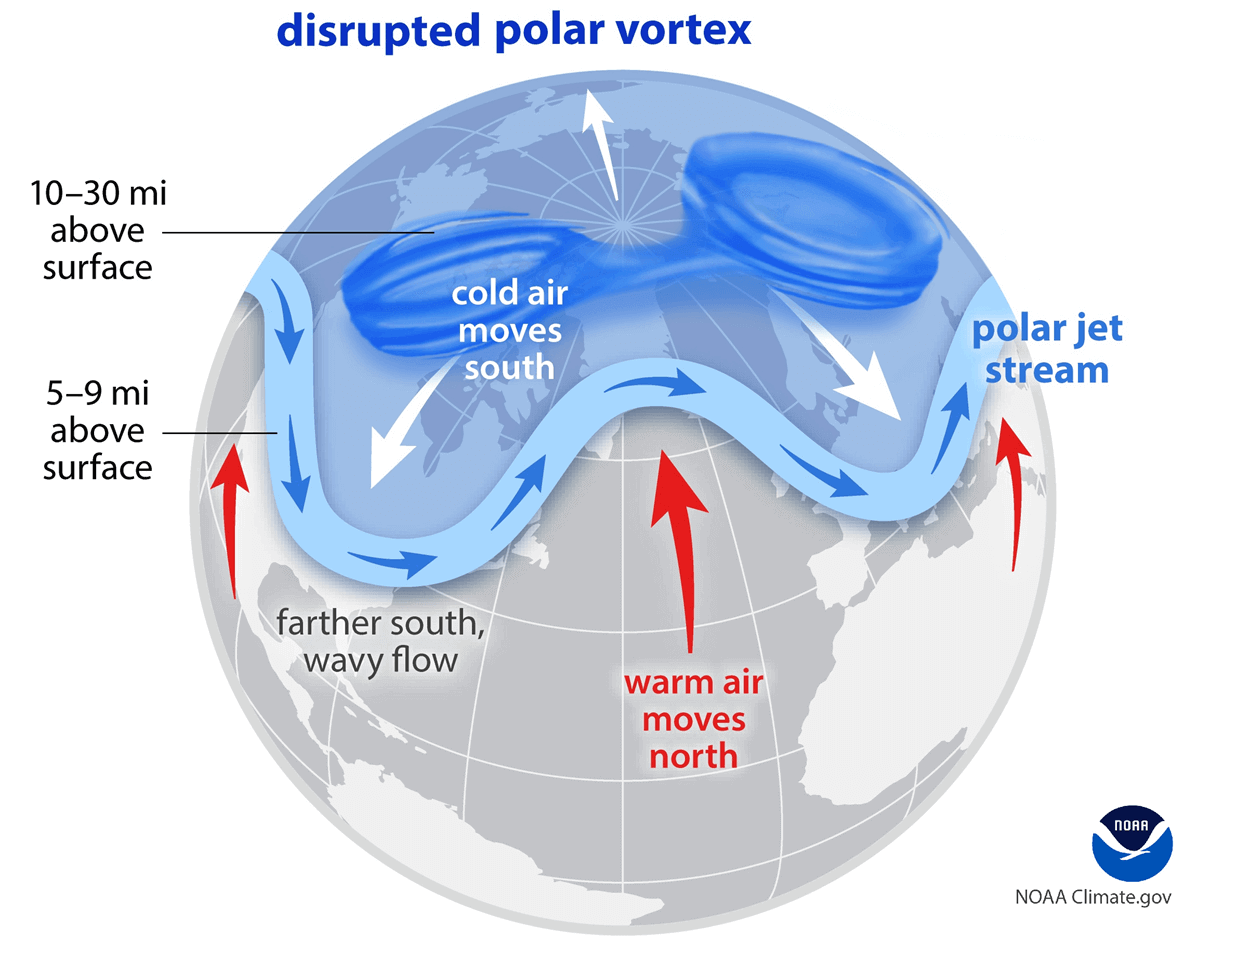
This weak/disrupted Polar Vortex is exactly what you will see in the forecast below, with cold weather across the United States, Canada, and Europe. The disruption itself usually comes from the rise in pressure and temperature in the stratosphere, called a Stratospheric Warming (SSW) event.
To better understand what the Polar Vortex is, we produced a high-resolution video below. It shows the Polar Vortex in 3D, during the recent stratospheric warming event.
We will now look at the latest analysis and the Sudden Stratospheric Warming event, and how it will help to unleash colder weather and snowfall several weeks after the event.
STRATOSPHERIC WARMING EVENT
As mentioned, an SSW event means a rise in pressure and temperature in the stratosphere, putting a lot of stress on the Polar Vortex. The recent SSW event occurred in late November/early December, with a strong blow to the Polar Vortex.
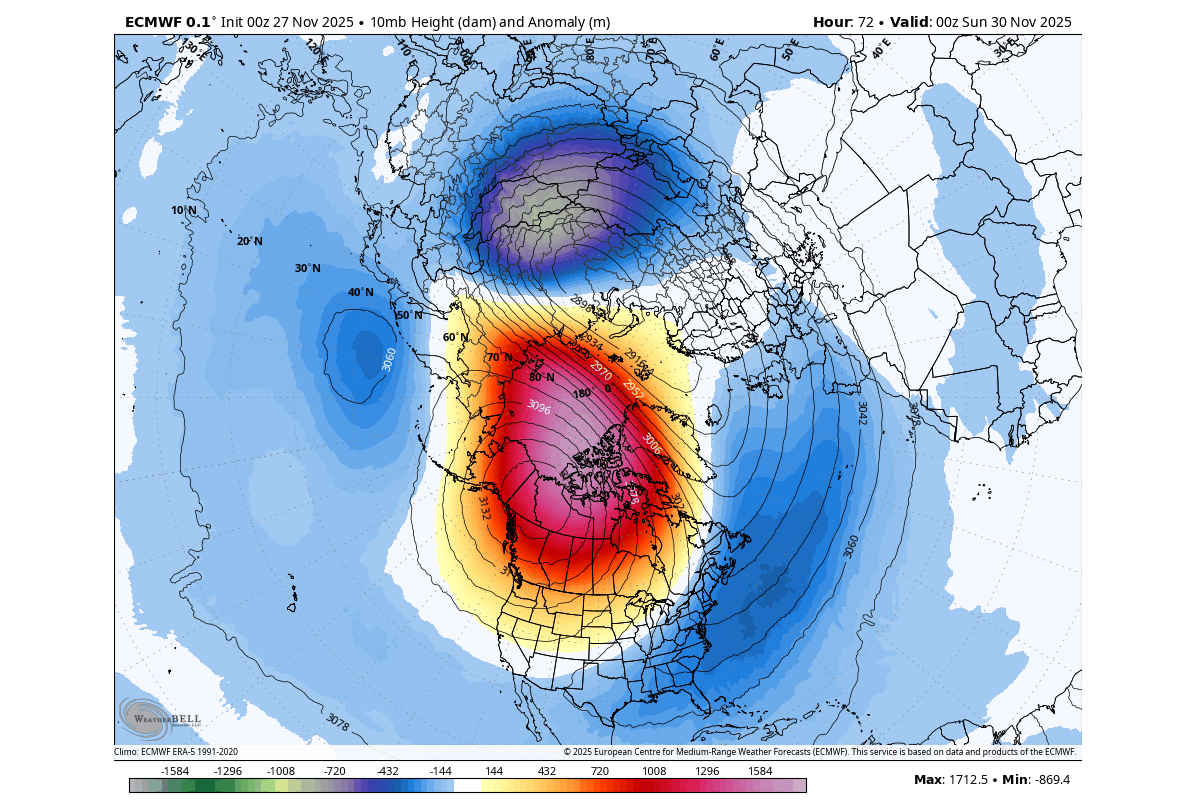
Below is the pressure and temperature map for the mid-stratosphere at the 10mb level (30km/18.5miles height) during the SSW event. You can see a very strong high-pressure area (H) in the mid-stratosphere, and a very strong warming wave occurring where it comes together with the Polar Vortex (L), deforming and disrupting its structure.
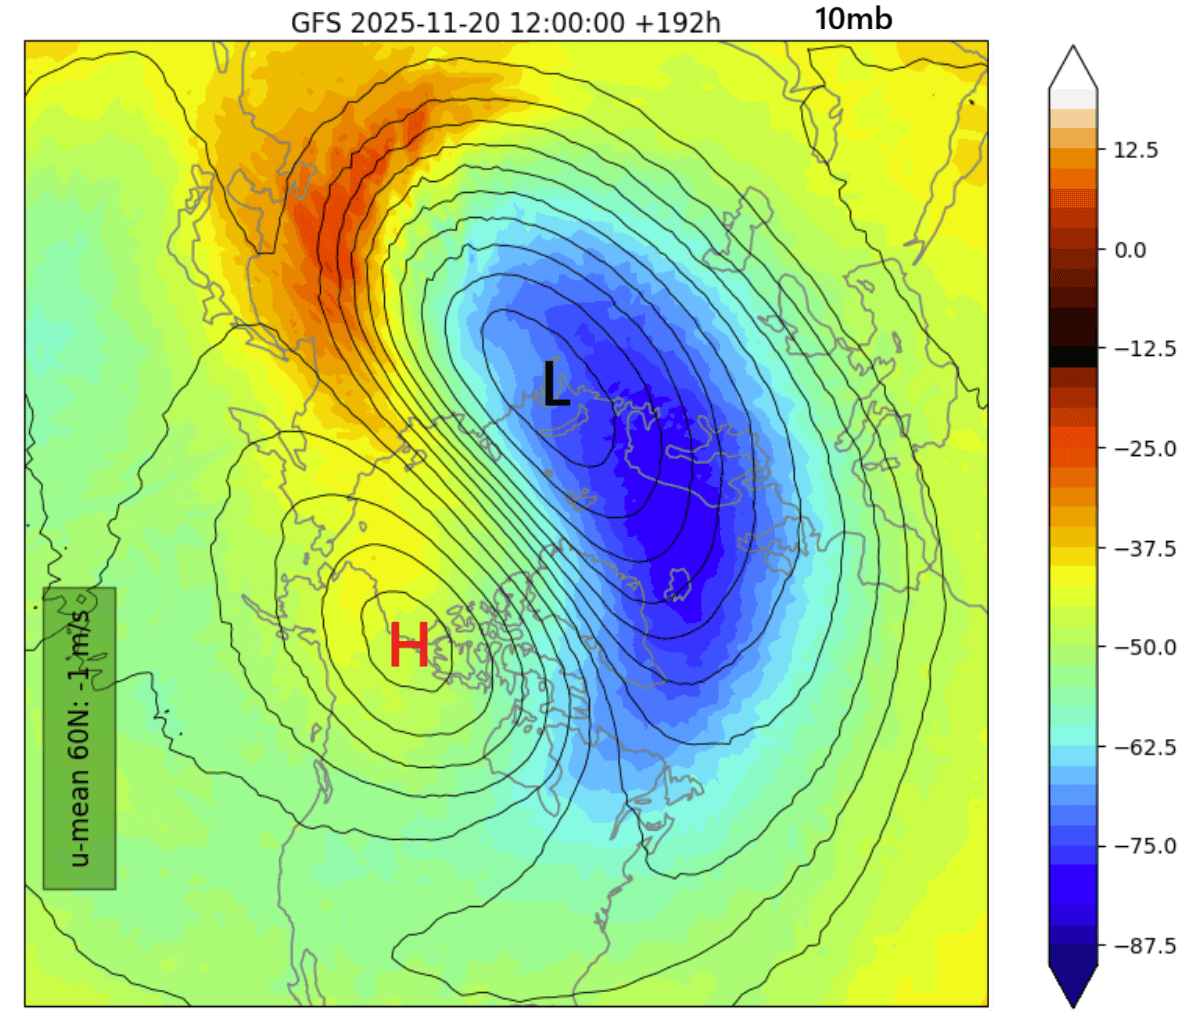
Such a stratospheric warming event is quite unusual at this time of year. There are fewer than a handful of these stratospheric events recorded this early in the past 70 years, with this being the earliest on record.
We can also look at the pressure anomaly for the same level/time. This reveals the full extent of the high-pressure anomaly in the mid-stratosphere. You can see how it was squeezing the Polar Vortex and slowing it down, creating a major disruption in this layer of the atmosphere.
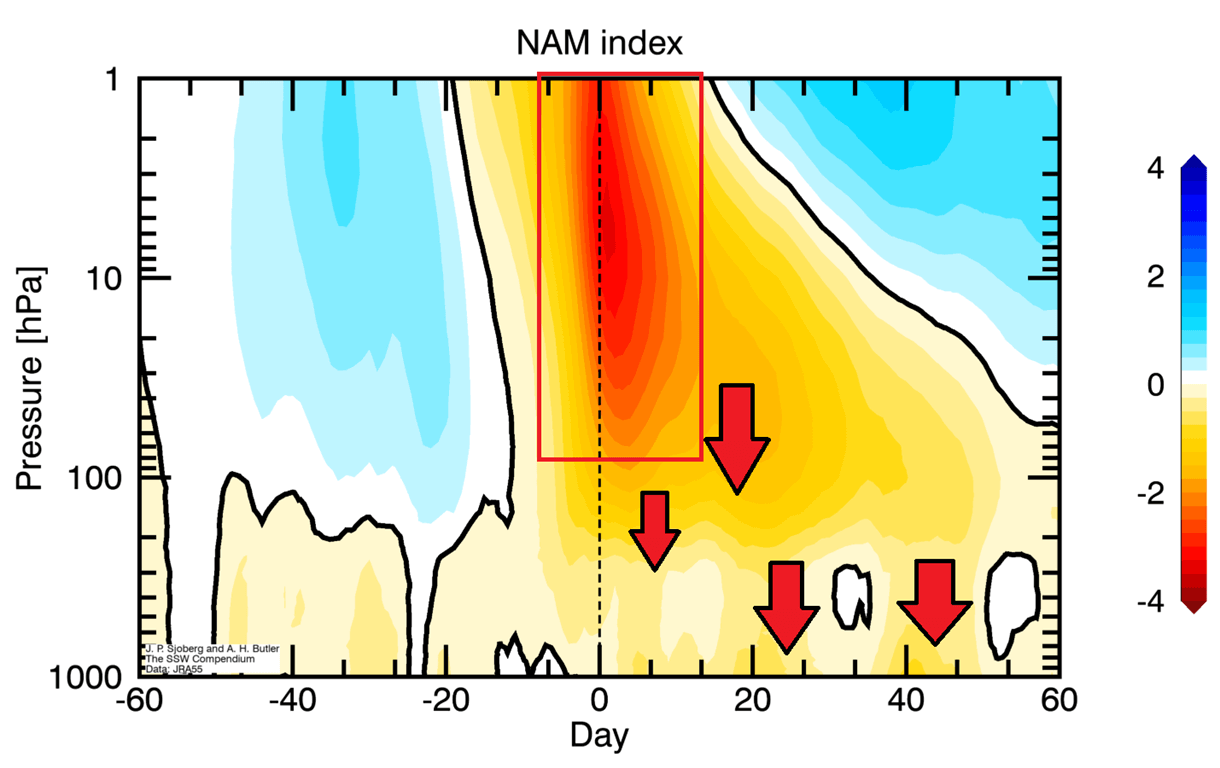
Below is a typical vertical schematic of how a stratospheric warming event works. The image shows pressure anomalies across the atmosphere over the whole SSW event, with 0 being the day of the event. You can see how the main event in the stratosphere affects the surface layers downwards over a certain time period, mostly with a 20-40 day delay.
The top-down disruption of the Polar Vortex allows high pressure to build over the polar regions, releasing cold air into the United States and/or Europe.
We are now within the time period when we can look for this downward impact. Below is a special image that shows polar region pressure anomaly across the atmosphere (by altitude). It goes back to early November, and you can really nicely see the buildup of high pressure in the stratosphere and the SSW event.
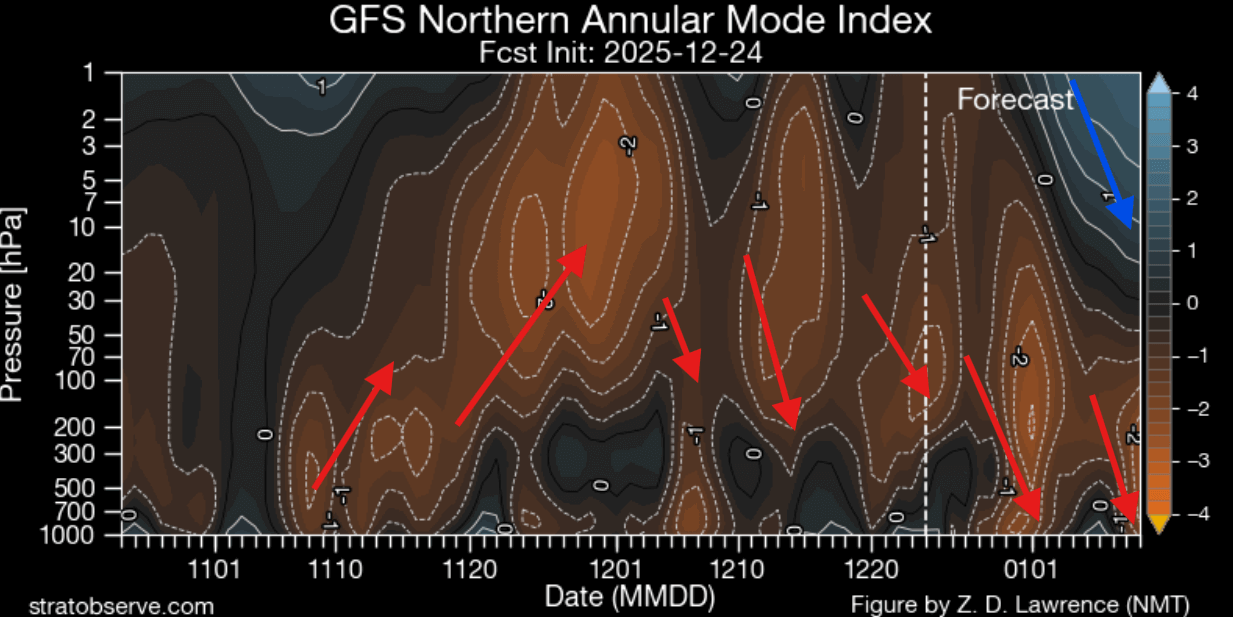
Arrows show the apparent movement of the pressure anomalies, with a clear upward movement in November that led to the stratospheric warming event. You can also see the downward progress of the high-pressure anomaly, with a stronger wave now also forecast to connect with the surface.
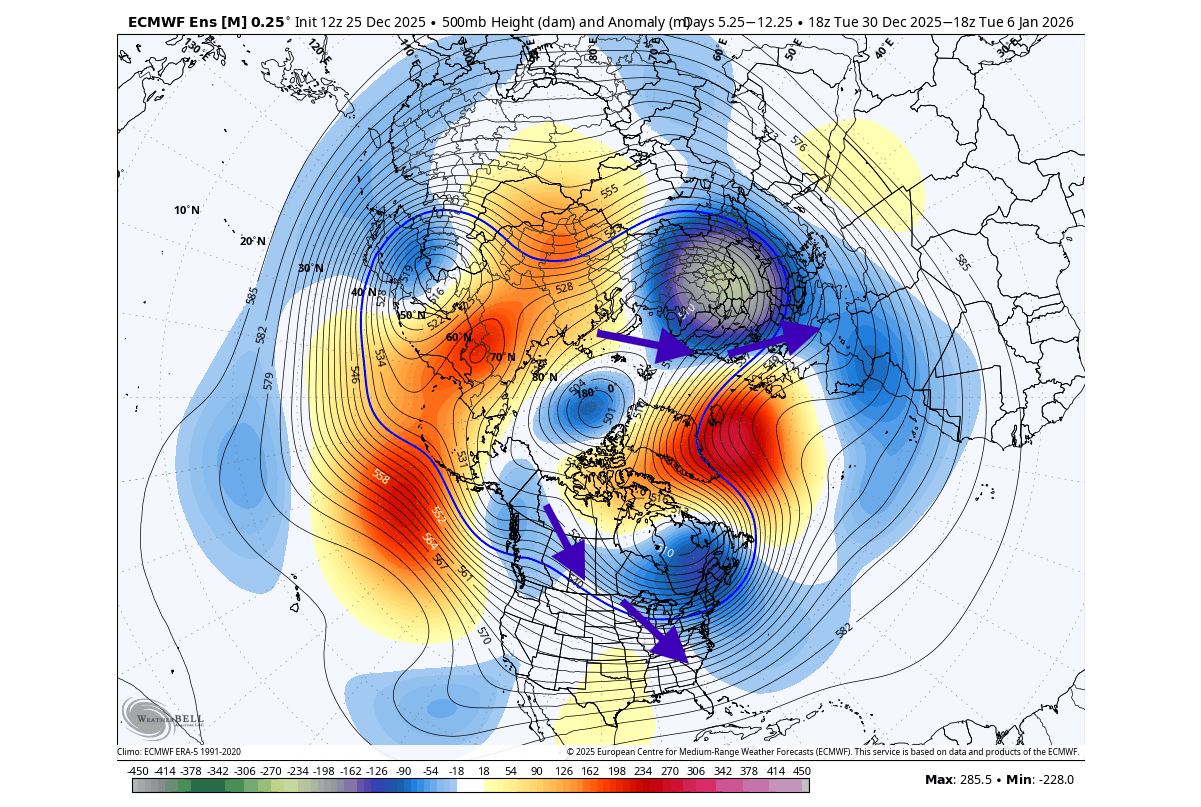
We can see this directly by looking at the lower stratosphere forecast at the 50mb level (20km/12.4 miles). What you can see is the pressure anomaly over the polar regions, with the Polar Vortex core split into two main areas, one over North America and one headed for Europe.
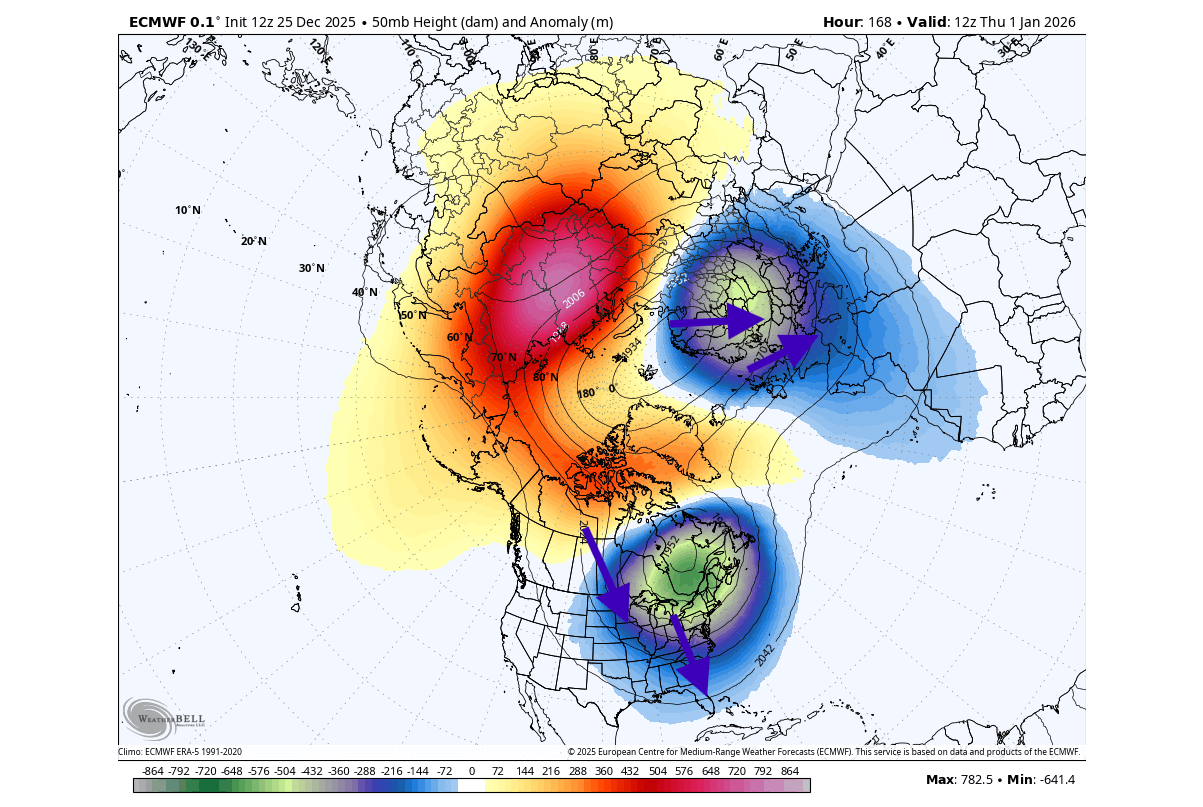
These Polar Vortex cores are significant for weather development, as they usually arrive with cold northerly air, now forecast to head into the United States, Canada, and Europe.
This means that we can now shift our focus to the forecast for lower levels and see the direct weather changes in the coming days/weeks.
COLD AIR RELEASED
Above, we see two strong cores of the Polar Vortex pushed into North America and Europe, impacting the weather patterns below.
You can see this much better in the 3D forecast below, with a visible separation of the lower Polar Vortex structure. One core area is pushed towards North America, and one into Europe, both creating a local northerly flow and a source for colder Polar air. You can also see the high pressure between the core areas. Image by Stratobserve
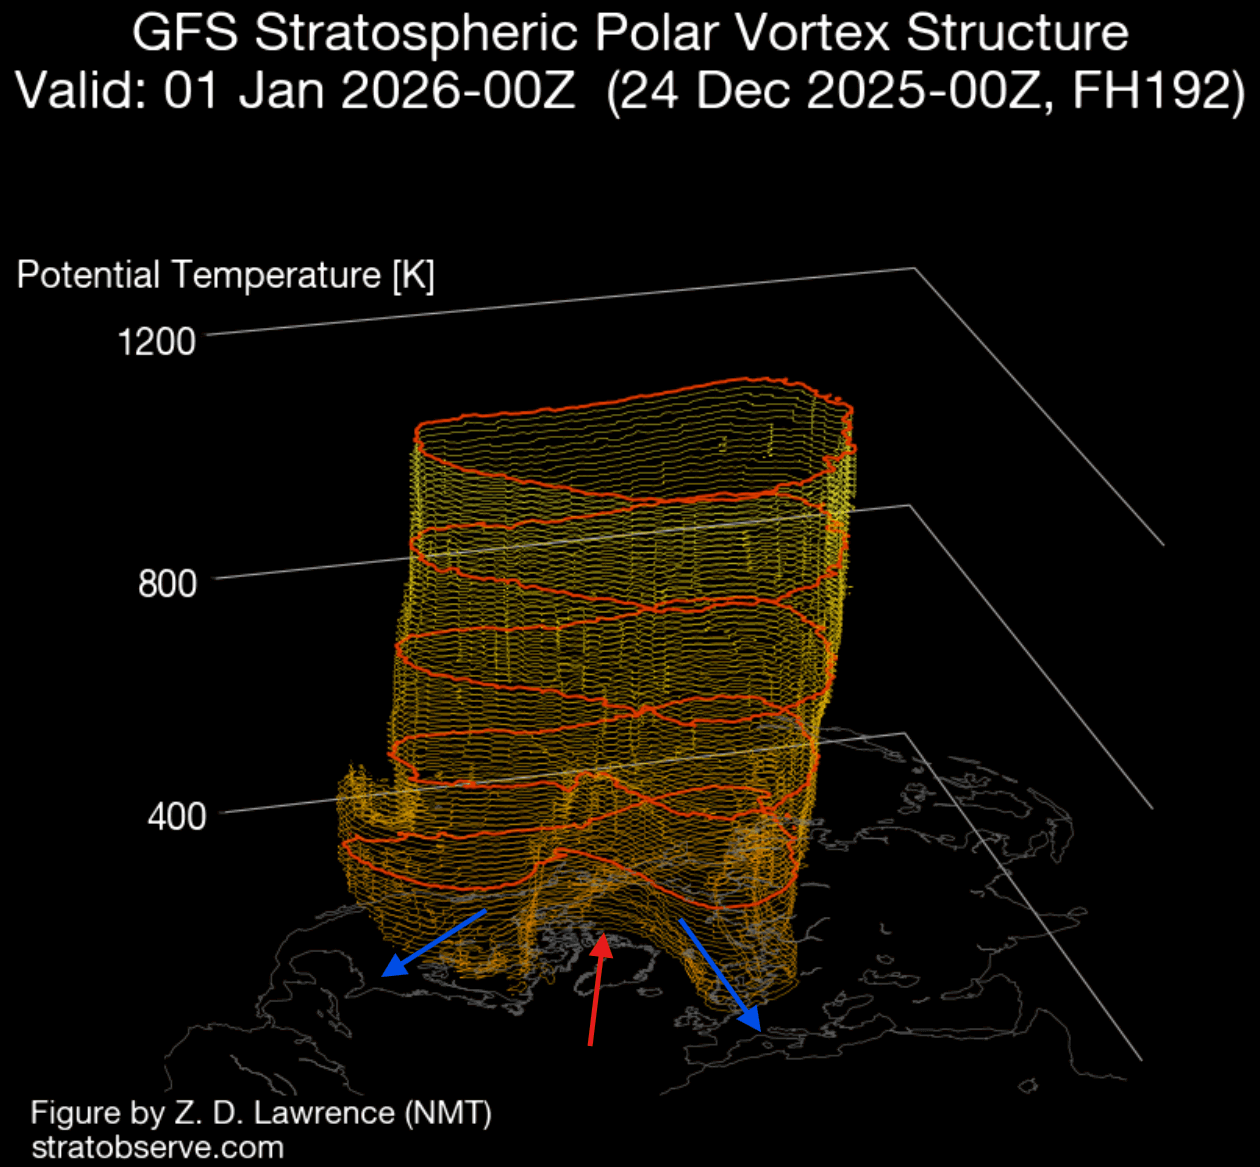
We can also see this below on the vertical pressure forecast, from the surface to the top of the stratosphere. You can see the main upper Polar Vortex, with two “legs” connecting down into the United States and Europe. Also, note the high-pressure anomaly that separates this lower structure.
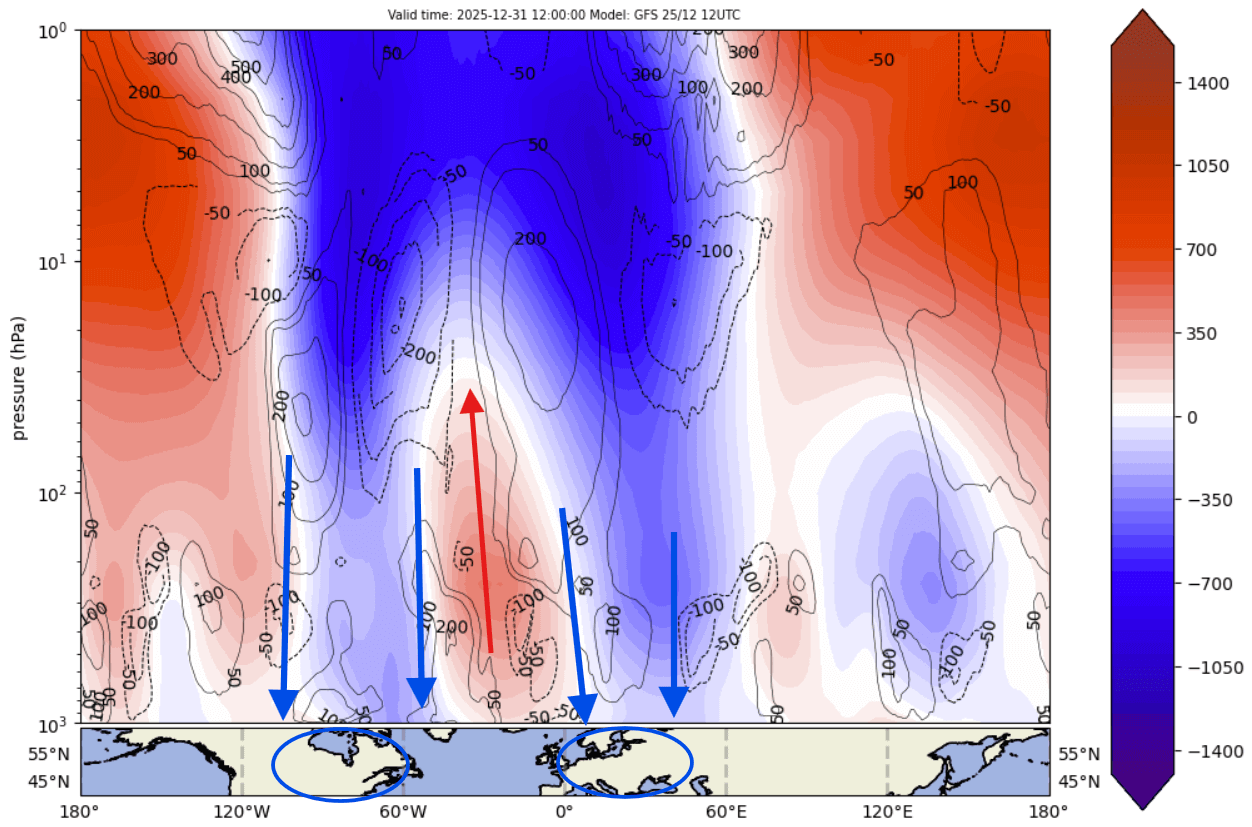
This is the result of stratospheric warming disruption, with some upward influence. Together, this will split the Polar Vortex into two main cores. So, with all the data in mind, it’s now clear that we will be dealing with proper Polar Vortex impacts on both sides of the Atlantic.
Below is the 5-10 day pressure forecast at the lower levels, where you can see two main low-pressure areas, which are the Polar Vortex cores that you saw above. Both will create a path of cold air out of the Polar regions, with a more established path over the United States and Canada.
We have seen many cold air events so far in the United States, with a strong cold supply building over western Canada. This provides a shorter route for strong cold-air outbreaks, as the cold is already stored and waiting in western Canada to spill into the United States.
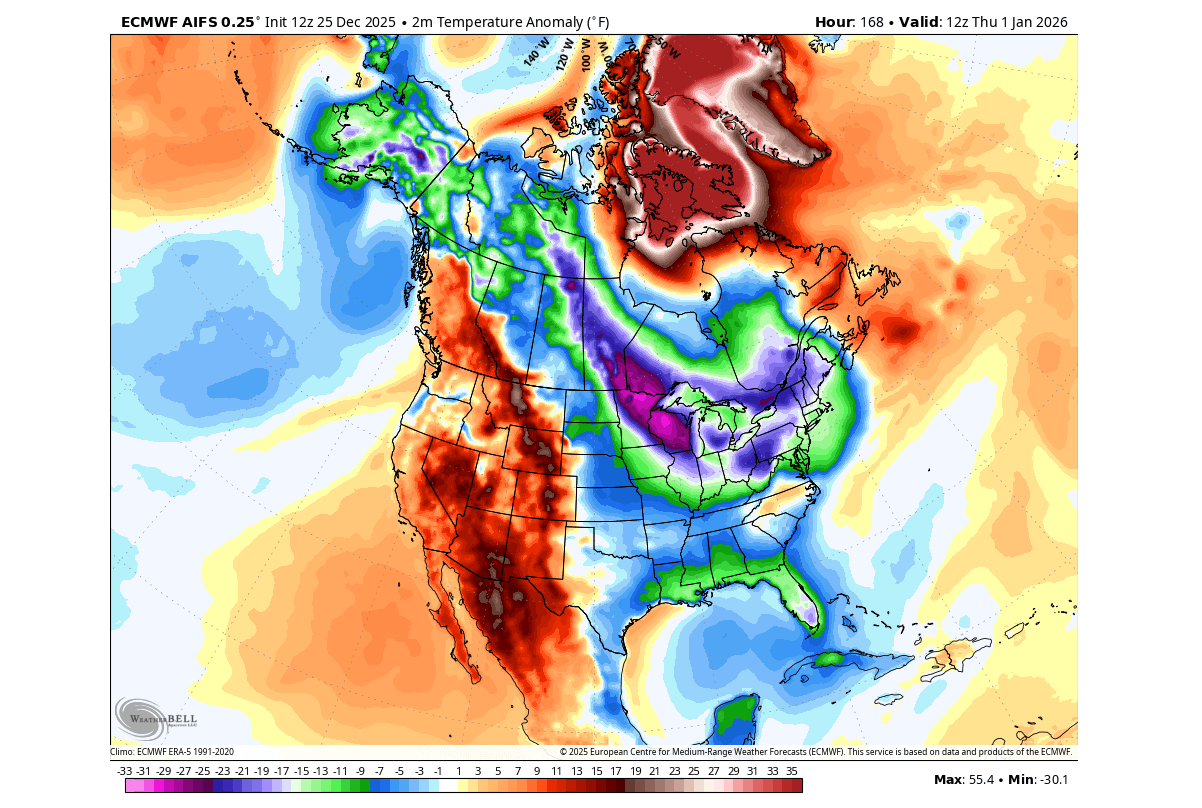
Because a low-pressure system spins counterclockwise, we get a colder northerly flow on its rear side. But in front, the low-pressure system creates a milder westerly/southerly flow. You can see this in the temperature forecast below for the next 5-10 days, with a cold airmass spill into the eastern half of the United States.
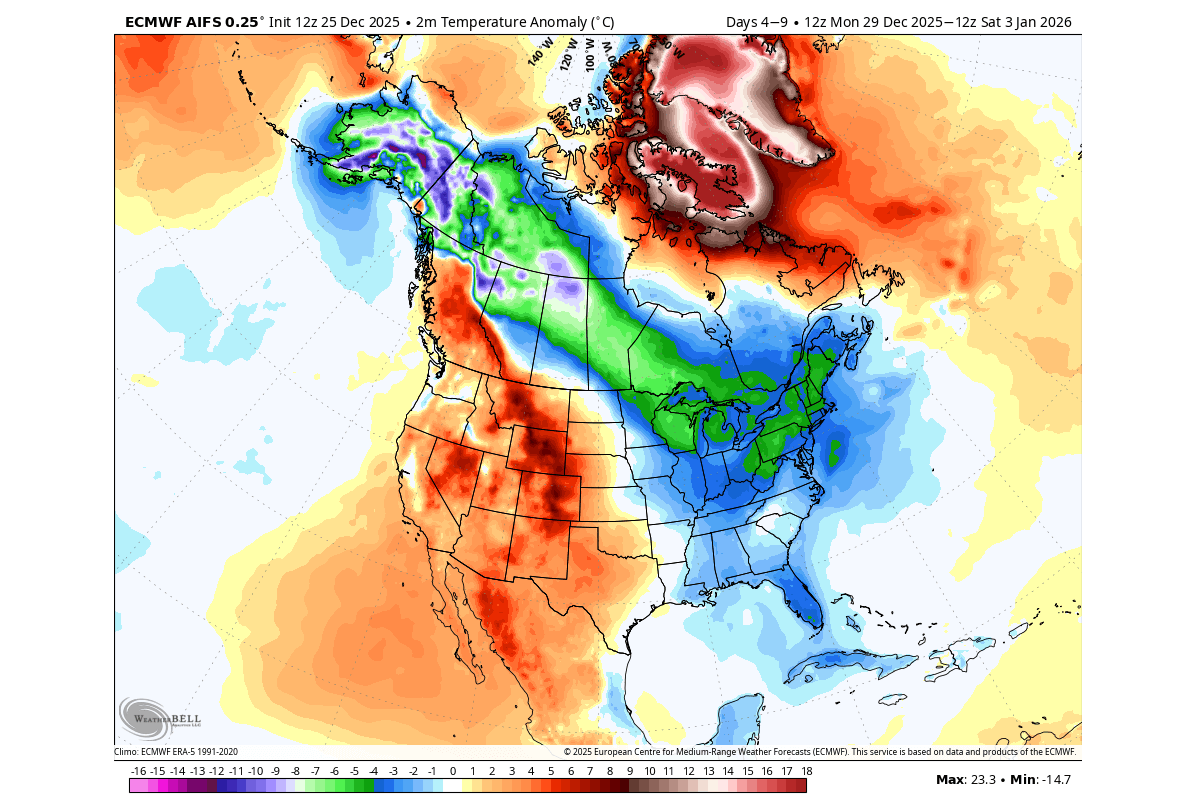
At the same time, you can see a strong warm anomaly over northern Canada and Greenland, driven by the southerly flow ahead of the low-pressure Polar Vortex core. But this is just an ensemble average forecast, which can hide the true cold potential at the medium range.
Below is a single-run example that shows the temperature forecast for next Thursday. You can see an obvious route of cold air from Canada down into the central and eastern United States. Cold air can also reach the southeastern United States, with the coldest temperatures reserved for the Midwest and the Northeast.
A very interesting pattern is also shaping over Europe for next week, with its own version of a Polar Vortex core. The northerly flow is forecast to bring cold temperatures across most of the continent, reaching also into the southern parts.
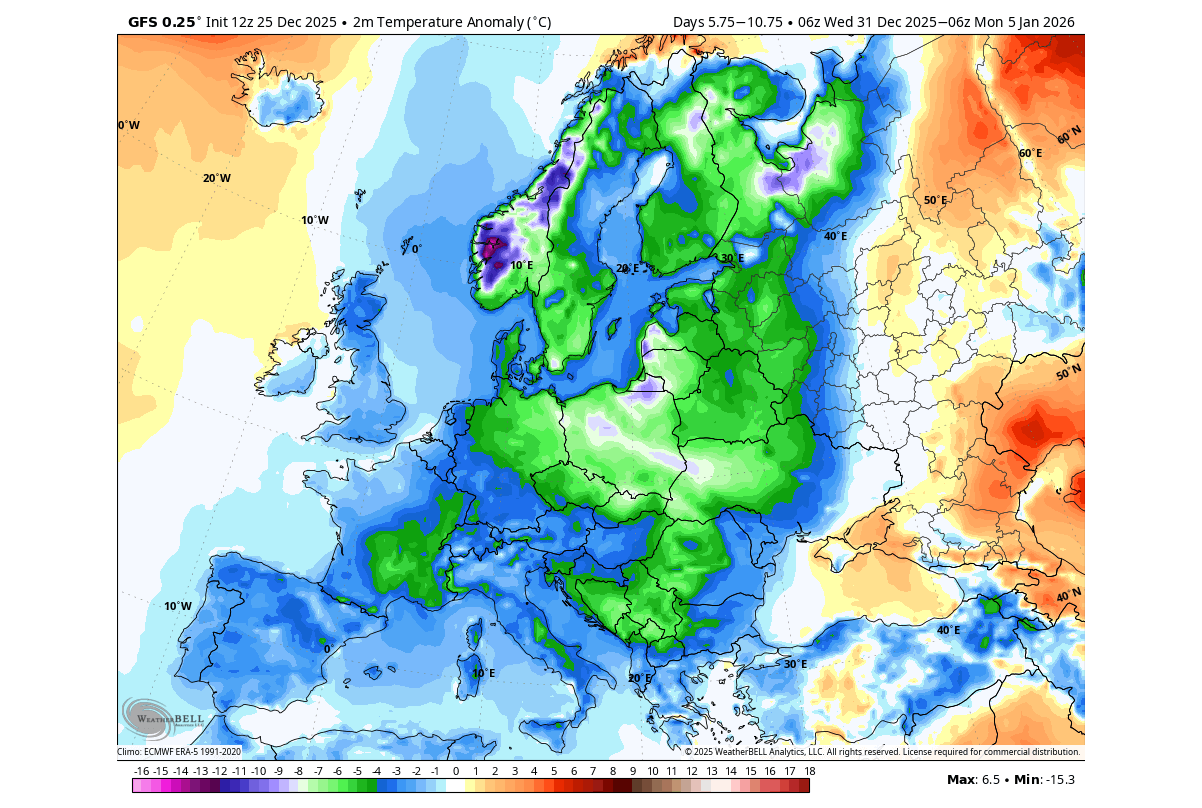
We won’t look at snowfall in this range, as a lot of details are in play. But it’s safe to say that both Polar Vortex cores will bring enough cold air for snowfall across the eastern and central United States and Europe. The question is only the availability of moisture.
At this point, we of course need to ask the important question: How long is this cold supposed to last? For this, we can look back in time and find some years with similar conditions and look at how those years turned out.
FORECAST LESSONS FROM THE PAST
We will first look at the stratospheric analysis of the season so far. Below is the NASA wind analysis of the mid-stratosphere at the 10mb level (30km/18.5miles height). Zonal wind strength at this level directly corresponds to the strength of the Polar Vortex. The red/purple/orange line is the 2025/2026 season, and the blue line is last year.
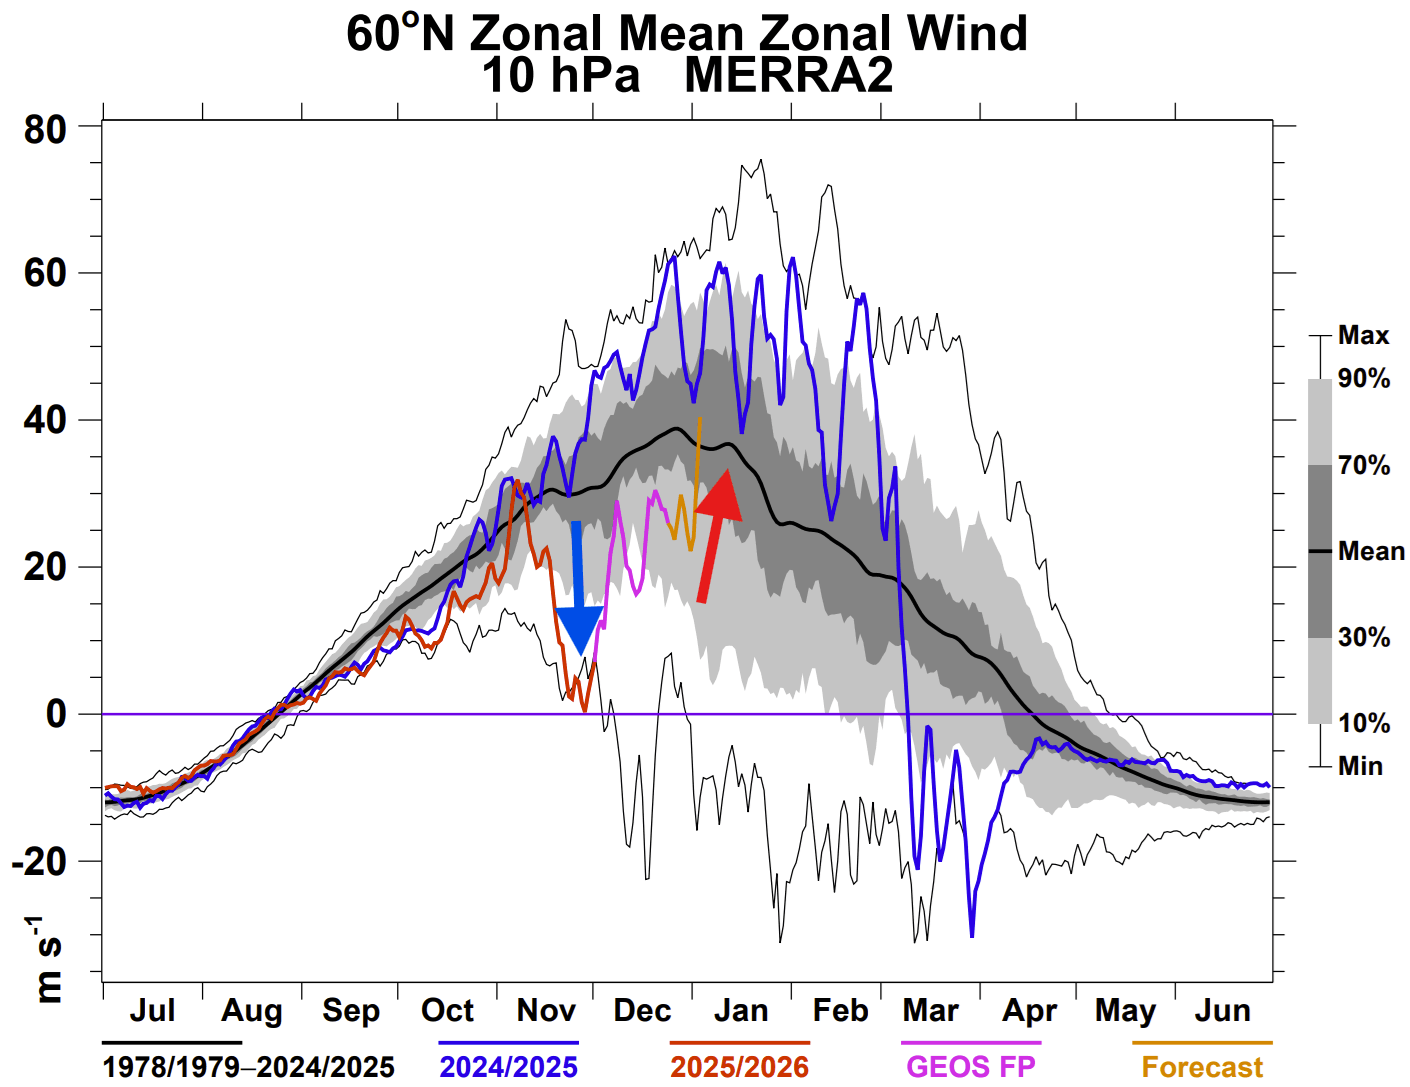
What you can see is a strong disruption in late November/December, associated with the Stratospheric Warming event. But the forecast shows a stronger-than-normal Polar Vortex will develop at this level of the stratosphere. This means that after all the disruption, the Polar Vortex is picking up power in the higher levels.
We have said that a stronger Polar Vortex can lock the cold air into the Polar regions, but not always. If the lower pattern is disrupted enough, then it cannot “connect” with the stronger part above. And this year, we have quite an ongoing disruption of the lower Polar Vortex.
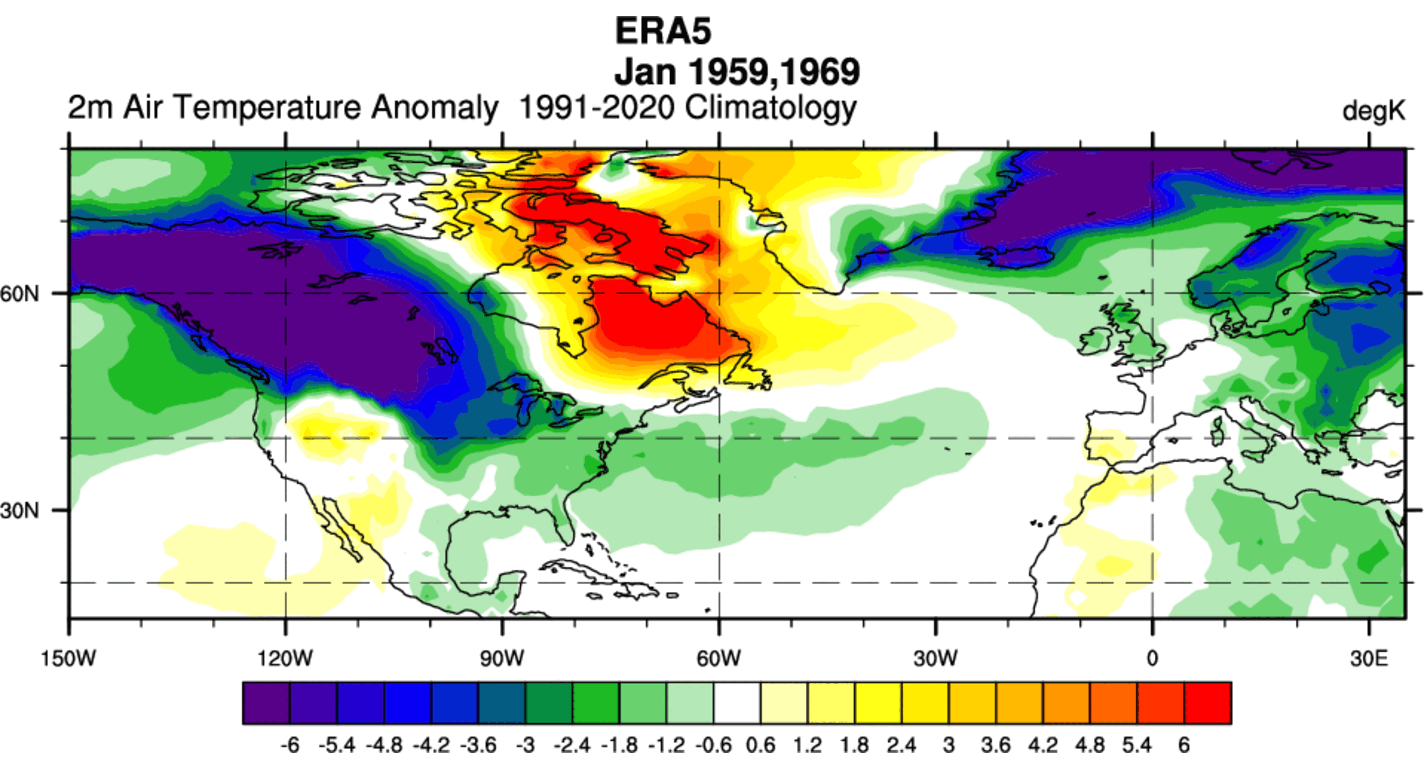
So, if we look at the data from the past decades, we can find a few years with a similar scenario to what we had so far: an early disruption of the Polar Vortex, followed by a strong phase in January. The image below from PSL shows the January temperature anomaly merged from all those years.
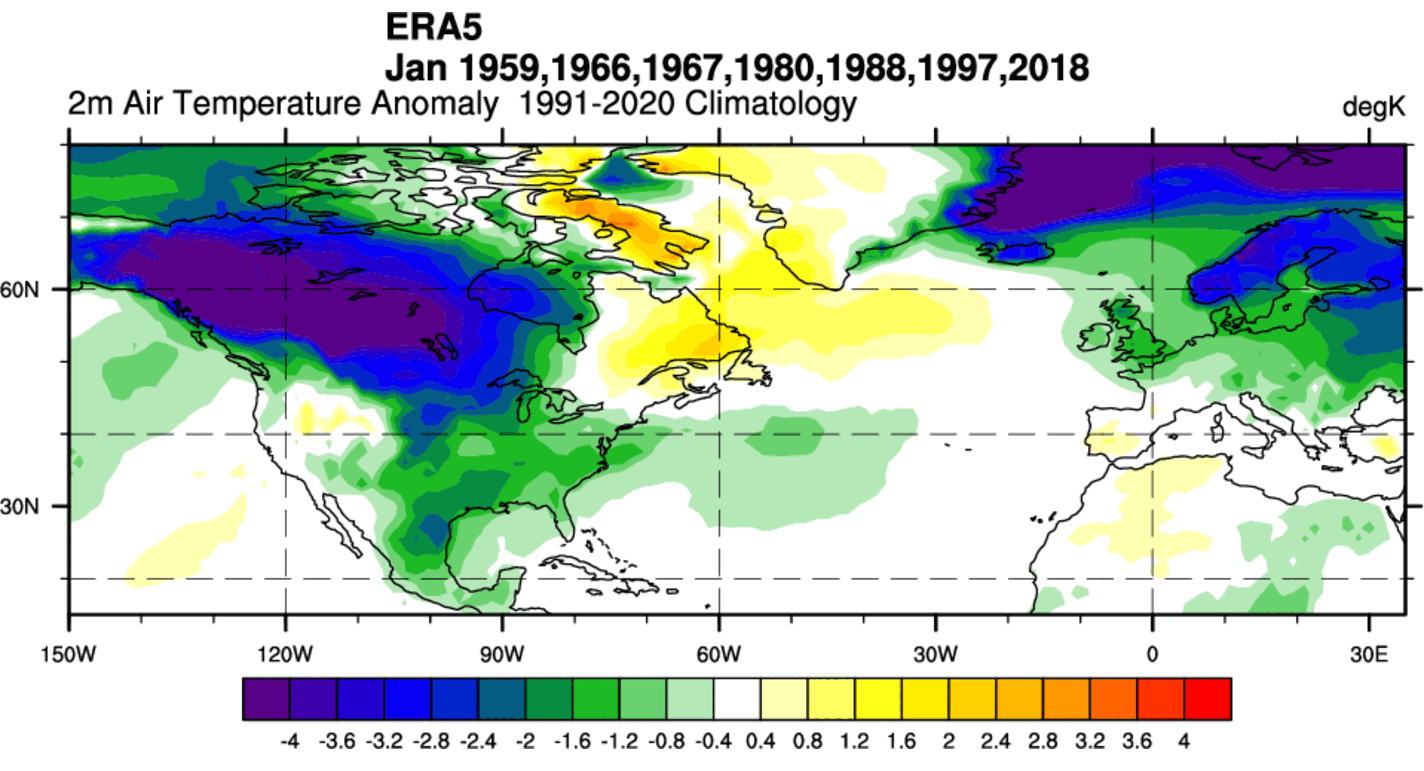
As you can see, it’s a rather cold look, similar to what we are seeing now in the forecast. A strong cold air supply is seen over western and central Canada, with extensions down into the northern, central, and eastern United States. There was also cold air spreading into Europe in January of those years.
This can tell us that similar past years have shown a colder pattern in January, despite a stronger upper Polar Vortex. Very likely because the weather patterns were too chaotic to allow the connection above.
We can also look at another set of years, now with an actual early Stratospheric Warming event. Here, only two years qualify with an actual SSW event so early in the season. And as you can see, the result is very similar, with another signal for a colder January over the United States, Canada, and Europe.
The pattern of cold over North America is set up very similarly to what we are seeing currently in the forecast. Thanks to the extended range forecast data available, we can actually look at the latest forecast trends for January and see if we will get another “blast from the past”.
JANUARY POLAR VORTEX WEATHER
For January, we will look at the monthly average forecast, which contains 30 days of data, averaged into a single image. This means that it shows the prevailing weather pattern and can hide some of the day-to-day or week-to-week details.
Starting in Europe, we can see from the monthly pressure forecast below that this is a favourable pattern for cold in January. You can see high pressure over the north and a low-pressure area over the mainland. This creates a stable northerly to northeasterly flow, which is great for colder air transport.
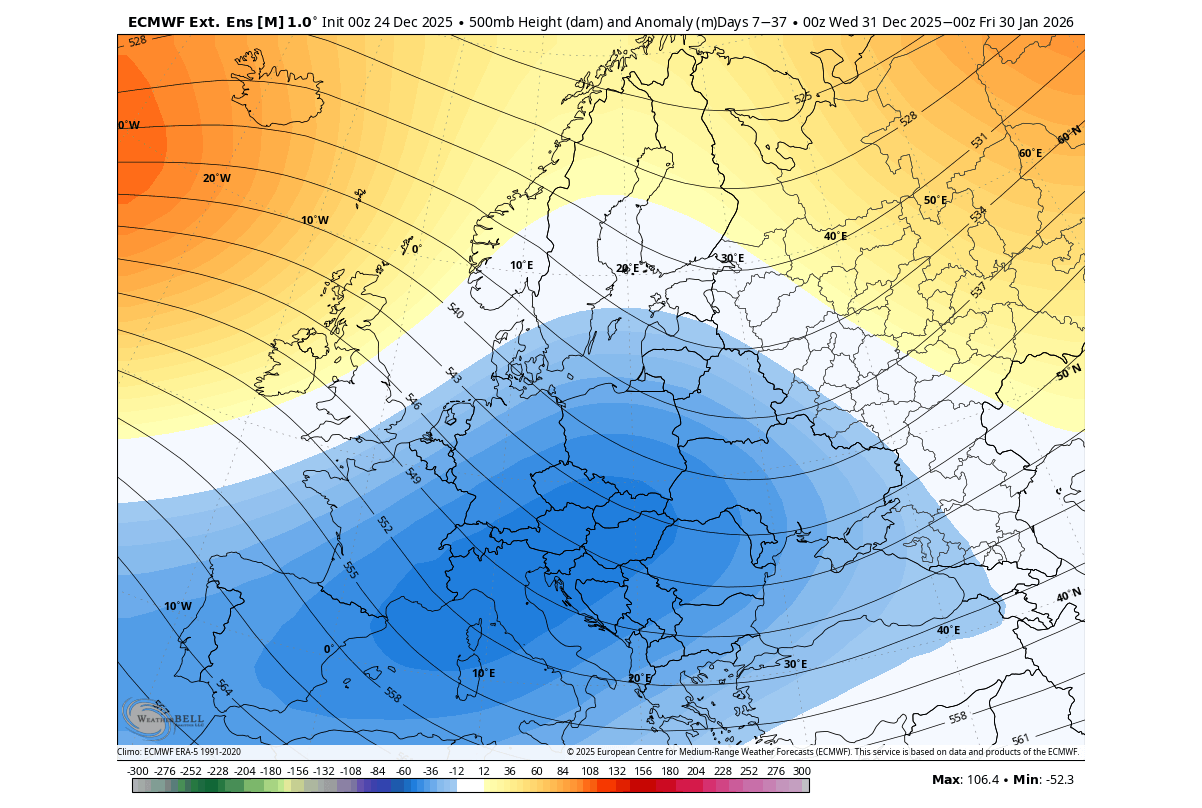
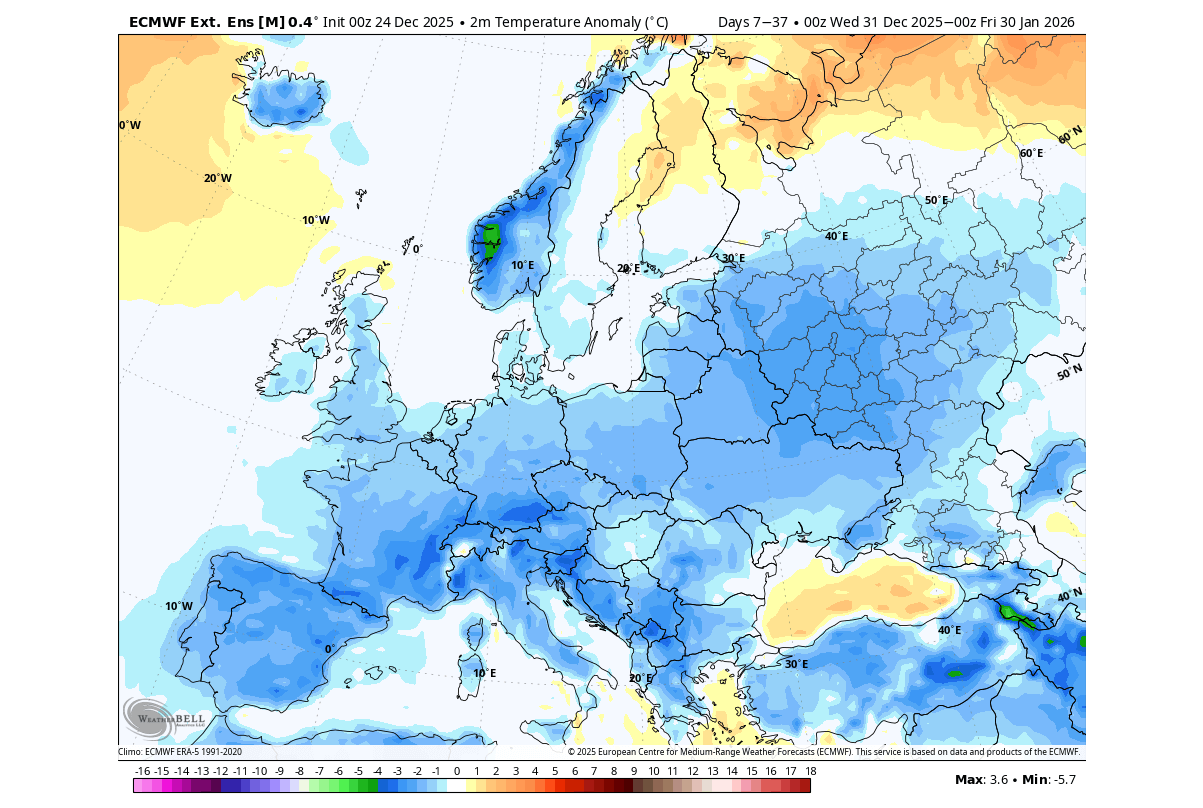
The temperature anomaly forecast does show below-normal temperatures for January, across most of the continent. This is expected to unfold from such a pressure anomaly, and is also what was indicated in the analysis images from the previous segment. For now, it looks like the past is likely to repeat itself again.
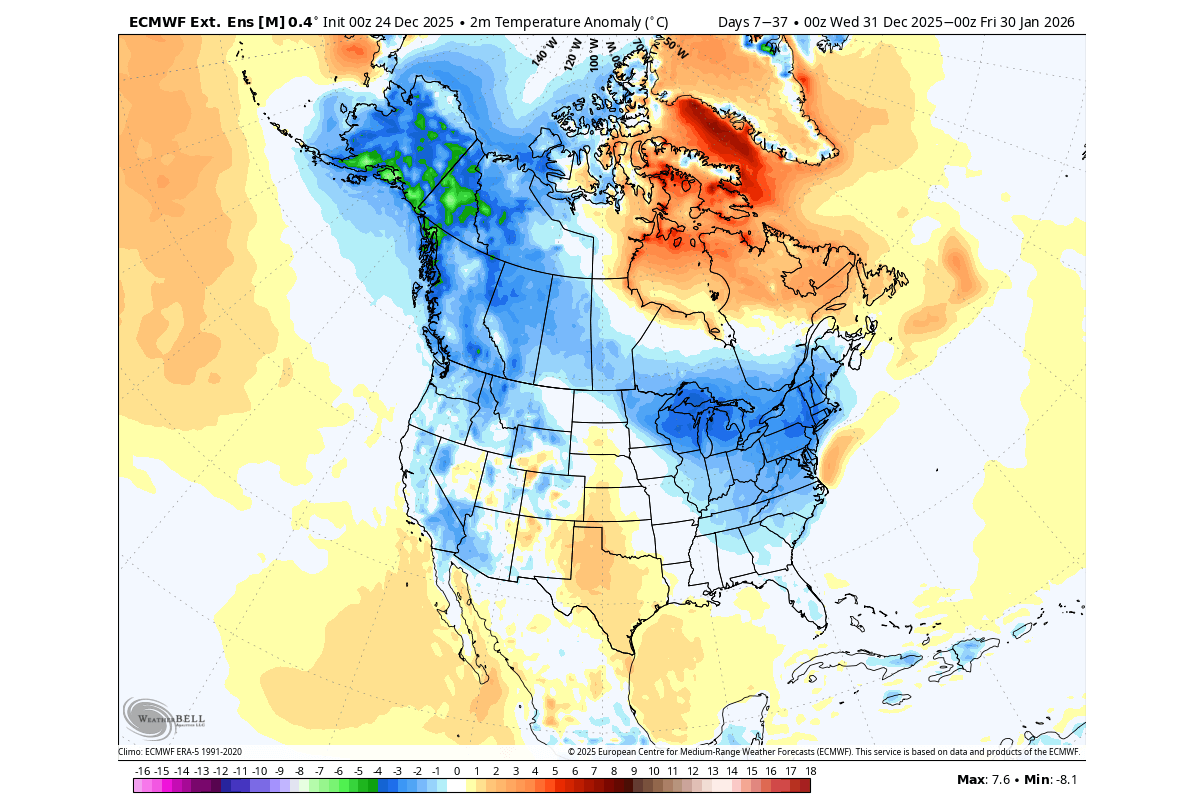
Looking at the pressure forecast for North America, we can see that the Polar Vortex core is forecast over Canada in January. This allows for a northerly and northwesterly flow from western Canada into the northern, central, and eastern United States. Having two high-pressure systems around helps to stabilize this pattern.
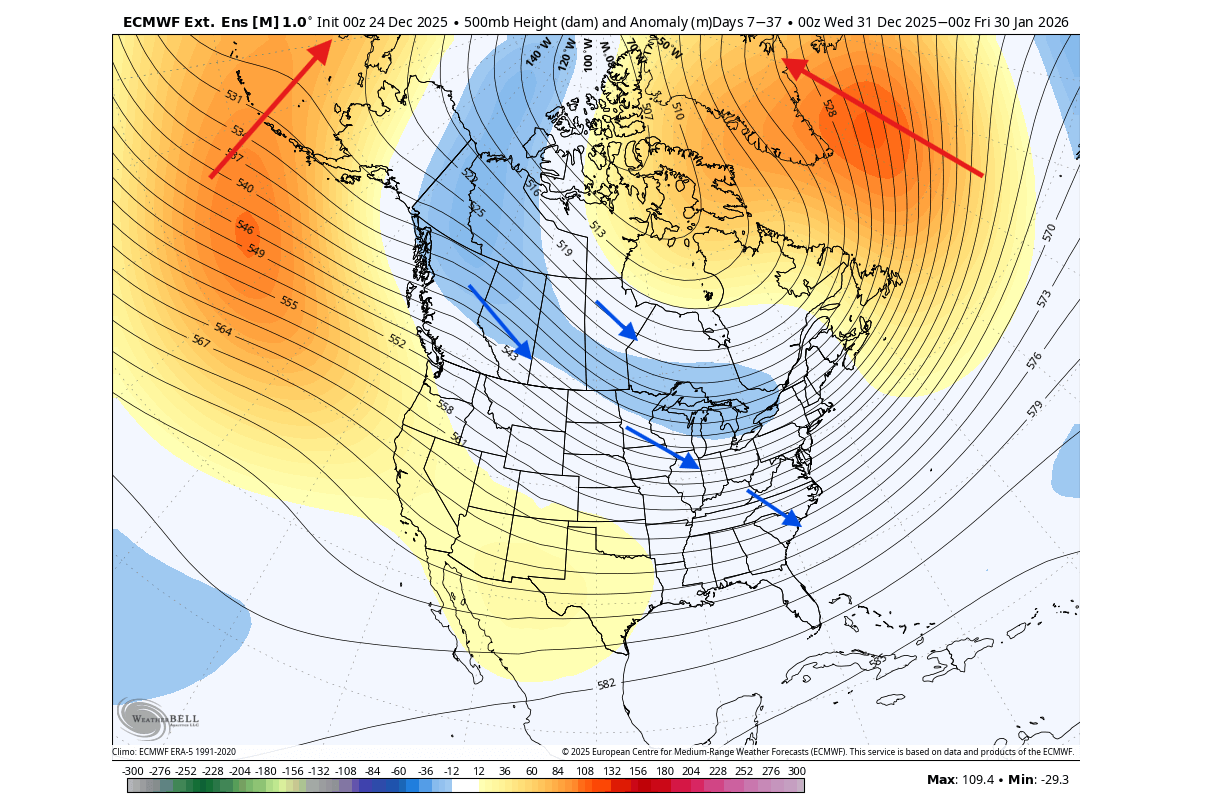
Since this is a monthly average forecast, there can still be brief “reset” periods, as the lows move in and out. But the main forecast trend shows the Polar Vortex core impacting North America throughout next month.
The monthly temperature forecast for January shows this colder pattern, with a stable cold air corridor from west-central Canada down into the northern and eastern United States. This is very similar to what the past examples have shown in a similar overall situation with the Polar Vortex, giving further confidence in this scenario
The highest snowfall potential in this pattern looks focused along the main cold trough track from Canada into the Upper Midwest/Great Lakes and then into the interior Northeast. This covers. Alberta/Saskatchewan/Manitoba into North Dakota, northern South Dakota, Minnesota, Wisconsin, Michigan (with lake-effect snow), southern/central Ontario, southern Québec, upstate New York, Vermont, New Hampshire, and interior Maine.
Of course, we have to keep in mind that this is the extended range forecast. But what gives us good confidence is that this is not some random forecast, but a pattern following a stratospheric warming event, backed by other events with similar Polar Vortex core movement in the past decades.
We will keep you updated on the global weather pattern development, so don’t forget to bookmark our page. Also, if you have seen this article in the Google App (Discover) feed, click the like button (♥) there to see more of our forecasts and our latest articles on weather and nature in general.
The main forecast images in this article are from WeatherBell, using a commercial forecaster license.
Don’t miss:
Long Range Watch: Latest Forecasts Show El Niño Returning in 2026