The important ENSO region in the tropical Pacific ocean is changing again, and that is always a big deal. We are observing a weakening of the cold ENSO phase, the La Nina, with a warming phase strengthening quietly below the ocean surface.
Global oceans are well known to play a major role in the climate and weather around the world. The most powerful seasonal impact comes from the tropical Pacific Ocean, which is now undergoing changes that could have far-reaching impacts in the coming months.
KING OF THE OCEAN
To keep it simple, there is a region in the tropical Pacific ocean called ENSO, which alternates between cold and warm ocean phases. The tropical trade winds (winds that circle the Earth near the equator) usually initiate or stop a certain phase, as they mix the ocean surface waters and alter the ocean currents.
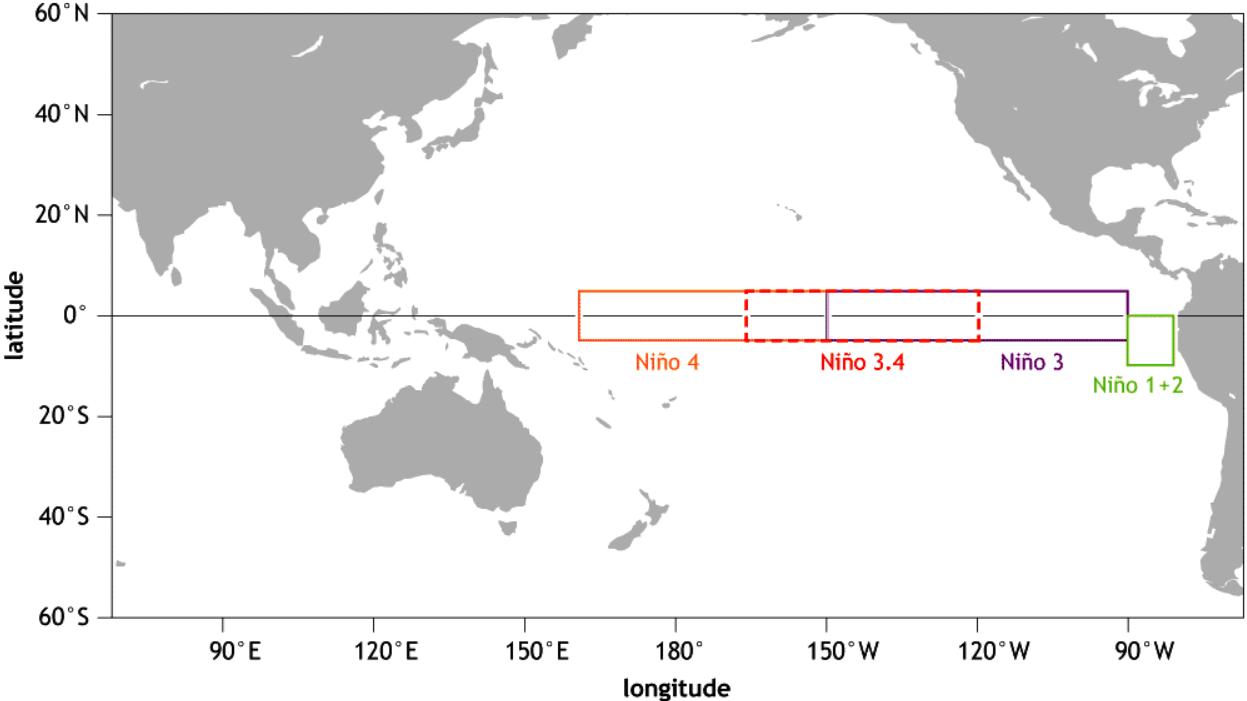
The image below shows all the ENSO / NINO regions. The main regions are 3 and 4 and cover a large part of the tropical Pacific. Most calculations and diagnosis is based on a combination of both the 3 and 4 areas, which is why we call the main region “ENSO 3.4” or “NINO 3.4”.
Below we have an image that shows the current ocean temperature anomaly analysis. It reveals where ocean temperatures are warmer/colder than normal. The region of colder than normal waters in the eastern equatorial Pacific is called the ENSO region and is currently in a weak negative (cold) phase. Take note of the cold anomalies developing in the North Pacific, along the west coast of the United States and Canada. We will get to that later.

The peak of this cold ENSO phase was around November 2020. The image below shows the ocean temperature anomaly for mid-November when the cold phase was around its peak. Cold ocean anomalies in the ENSO regions were much stronger and reaching further towards the west. But we can see a major difference in the North Pacific, as it was still warmer than normal at this point.

The cold ENSO phase is called La Nina, while the warm phase has a more famous name, the El Nino. Each ENSO phase has a different influence on the tropical weather and thus impacting the weather worldwide differently.
A specific phase (warm/cold) usually develops around late summer and autumn and can last until the next spring, or even up to two years in some cases.
We produced a high-resolution animation, which shows the ocean temperature anomalies across the tropical Pacific ocean. You can nicely see the cold ENSO phase at its peak strength in November and December 2020. Take note of how the colder waters are being pushed from east to west by the strong trade winds in the tropical Pacific region.
The image below from NOAA Climate shows the typical circulation during a cold ENSO phase. Air descends in the eastern Pacific, causing stable and dry weather, while air rises in the western Pacific, causing frequent thunderstorms and a lot of rainfall.

This way, ENSO has a major impact on the tropical rainfall and pressure patterns and the ocean-atmosphere feedback system. Through this ocean-atmosphere system, the ENSO influence is distributed globally. We usually observe a global shift in pressure patterns during the emergence and duration of the ENSO phases.
Preliminary data shows that the cold ENSO phase has already reached its peak in late 2020. While it was not the strongest ever, this cold phase was indeed quite strong. This increased the likelihood of its impact reaching into spring 2021. Despite now weakening, the ENSO phases can have a global influence even after they are gone, as it can take some time to change the global circulation.

LA NINA AND WINTER 2020/2021
One of the main influences of the cold ENSO phase (or any other phase) can be seen in the changing jet stream. For the cold phase, the most common signal is a strong high-pressure system in the North Pacific ocean.
You can see the usual winter jet stream position during the cold ENSO phases and the corresponding weather development over North America. The twisting jet stream brings colder air and storms down from Canada into northern and the northwestern United States, and warmer and drier weather to the southern parts.

But, the Winter 2020/2021 did not play nicely with the cold La Nina. Below you can see two graphics. The top one shows the air pressure anomalies during the first two winter months in winter 2020/2021. The bottom graphic shows the average air pressure anomalies during the strongest 13 La Nina events in the past 70 years.
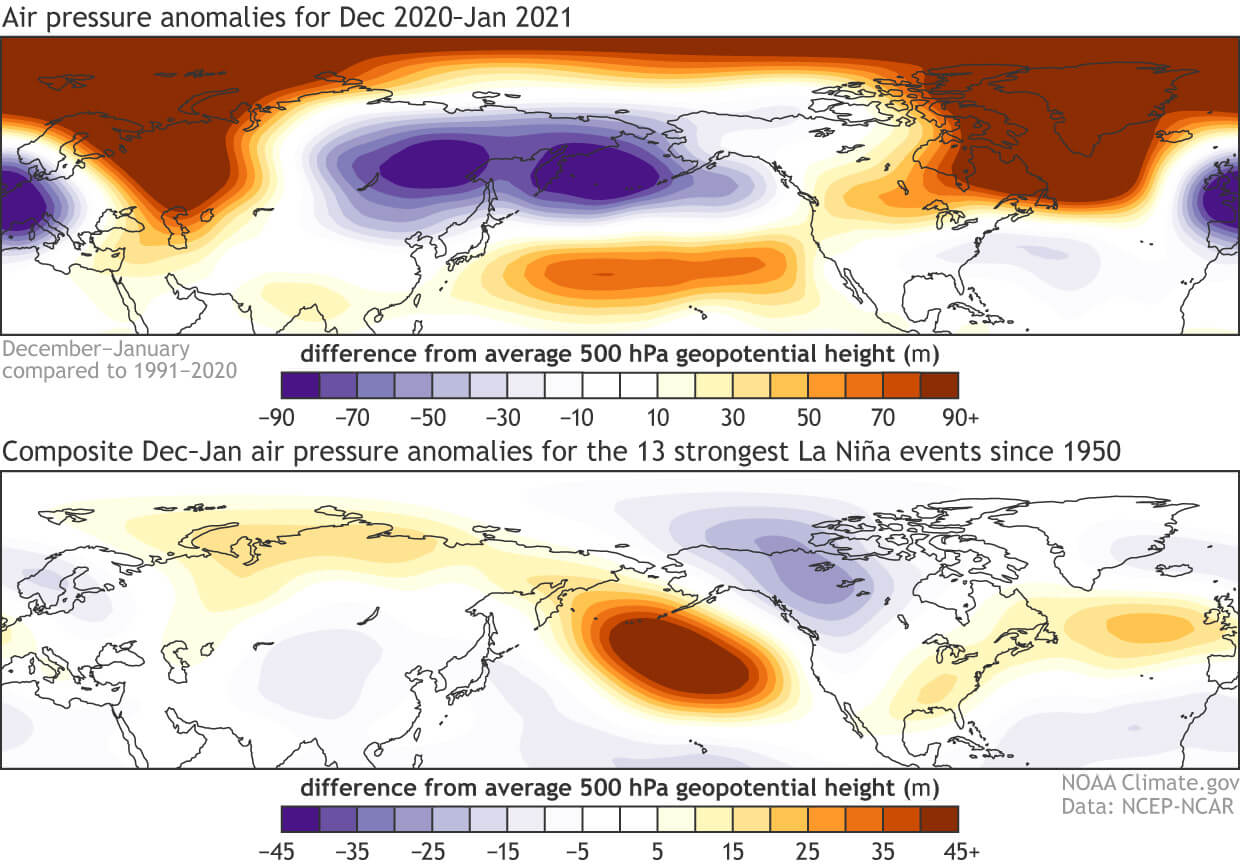
You don’t have to be a certified meteorologist or a climatologist to see that they do not fit together very well. The actual winter patterns were not showing a strong La Nina influence. In comparison, the main difference was the strong Greenland/Arctic high-pressure system this winter.
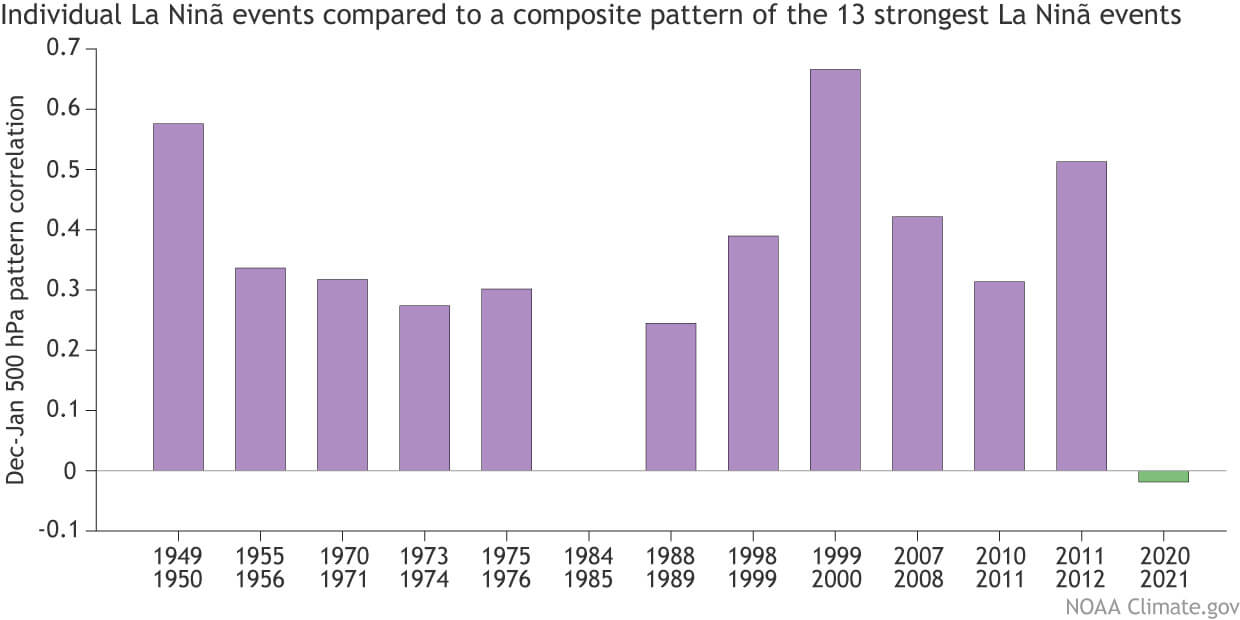
Below is another image, which shows a comparison of the stronger 13 La Nina events since 1949, to the average La Nina winter pressure pattern. Basically, this image is a rough approximation of how strong was the La Nina signal or influence during its winter season.
All years show a certain level of correlation with the expected pressure patterns. The only ones standing out are Winter 1984/1985 and of course 2020/2021. Last winter is especially interesting, as it has a negative value, indicating an almost opposite development to that expected.
The main reason behind this is perhaps not so easy to pinpoint. Based on the available data, one of the likely reasons was the strong stratospheric warming event in late December into early January.
You can see the pressure anomalies in the lower atmosphere on the image below, from the surface up to around 30km altitude. The red colors indicate higher than normal pressure, which started in the stratosphere and made its way down towards the surface. This process packs a lot of energy and can cause a big shift in the weather patterns. There were more things at play this winter, but this stratospheric warming event is the easiest to pinpoint as one of the pattern influencers.

TRADE WINDS AND OCEAN CURRENTS
As we mentioned before, the ENSO phases are driven by tropical winds (trade winds) and ocean currents. Strong easterly winds in the ENSO regions cool the ocean, as they mix the waters, and cause the upwelling of colder deeper water. Westerly winds usually mean warmer water.
Below we have an image from CyclonicWx, which shows the latest trade winds around the world at the equator. You can see the negative (easterly winds) in the ENSO regions. But these easterlies are slightly weakening in this 10-day forecast. What is more impressive, is the strong westerly wave burst to develop between 120°E and 180°.
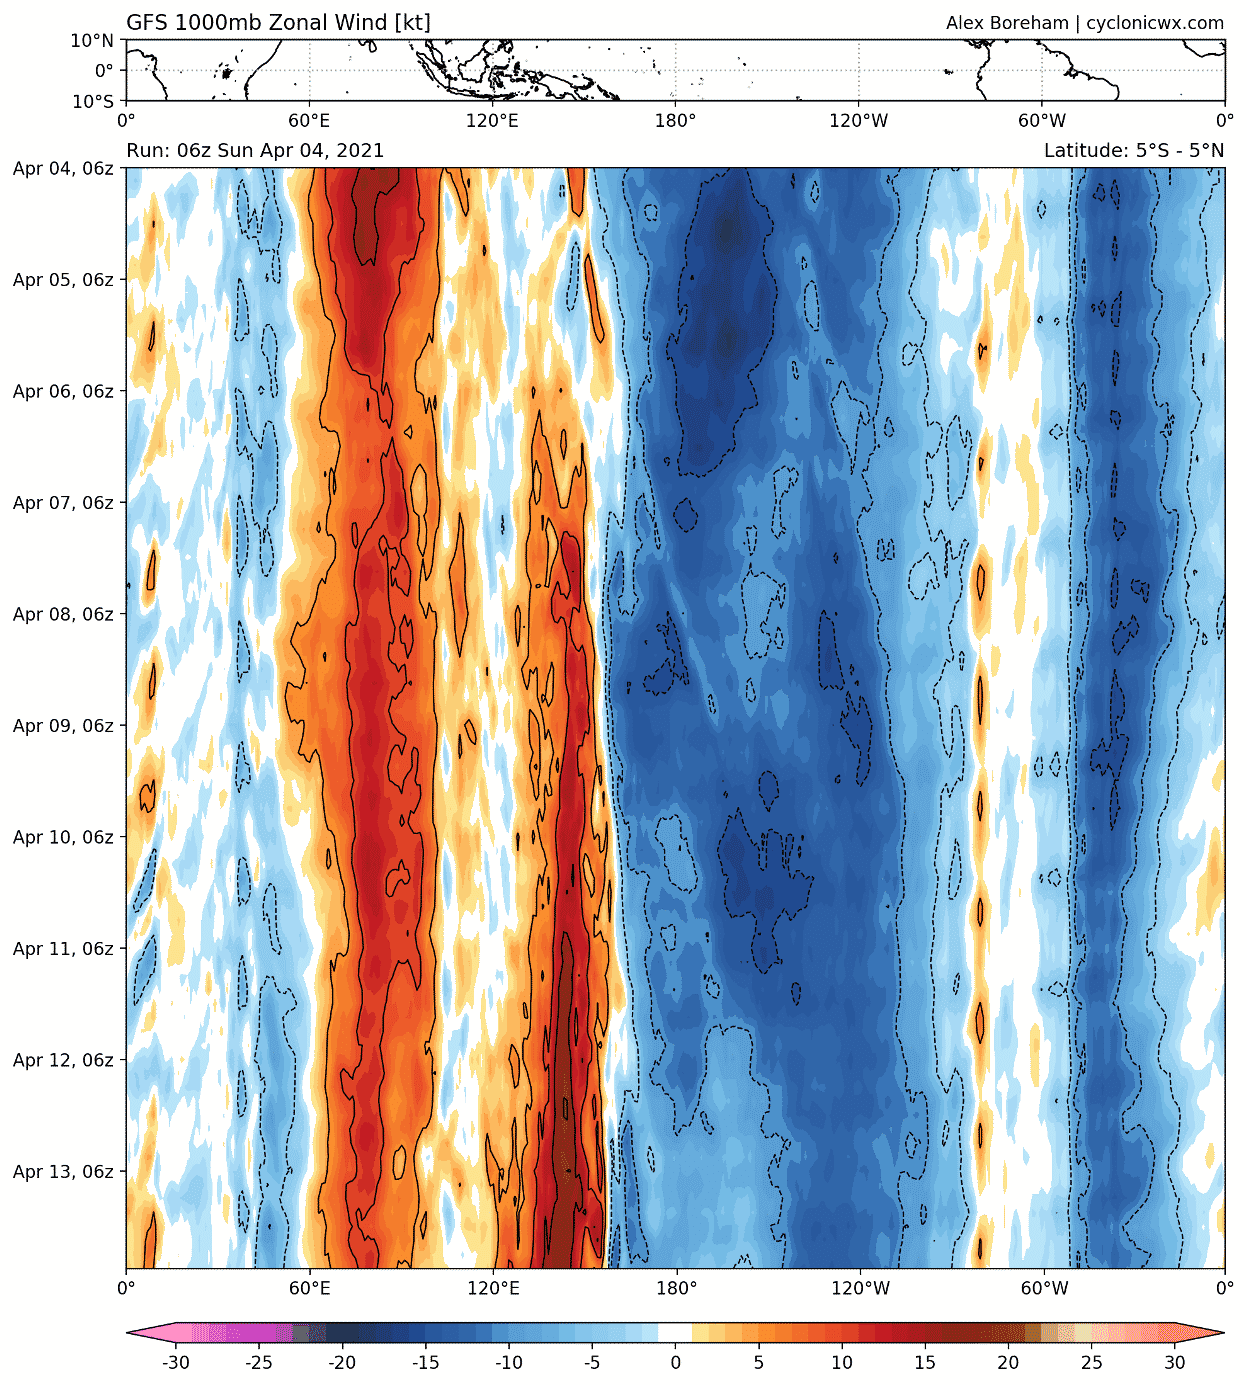
Westerly winds almost always mean warmer ocean temperatures. So these “westerly bursts” developing are always being monitored closely when approaching the ENSO regions.
Looking at the actual ocean surface currents, you can see the easterly ocean currents dominant in the east ENSO regions. The rest of the region also features easterly currents, which corresponds with the cooling and colder anomalies.
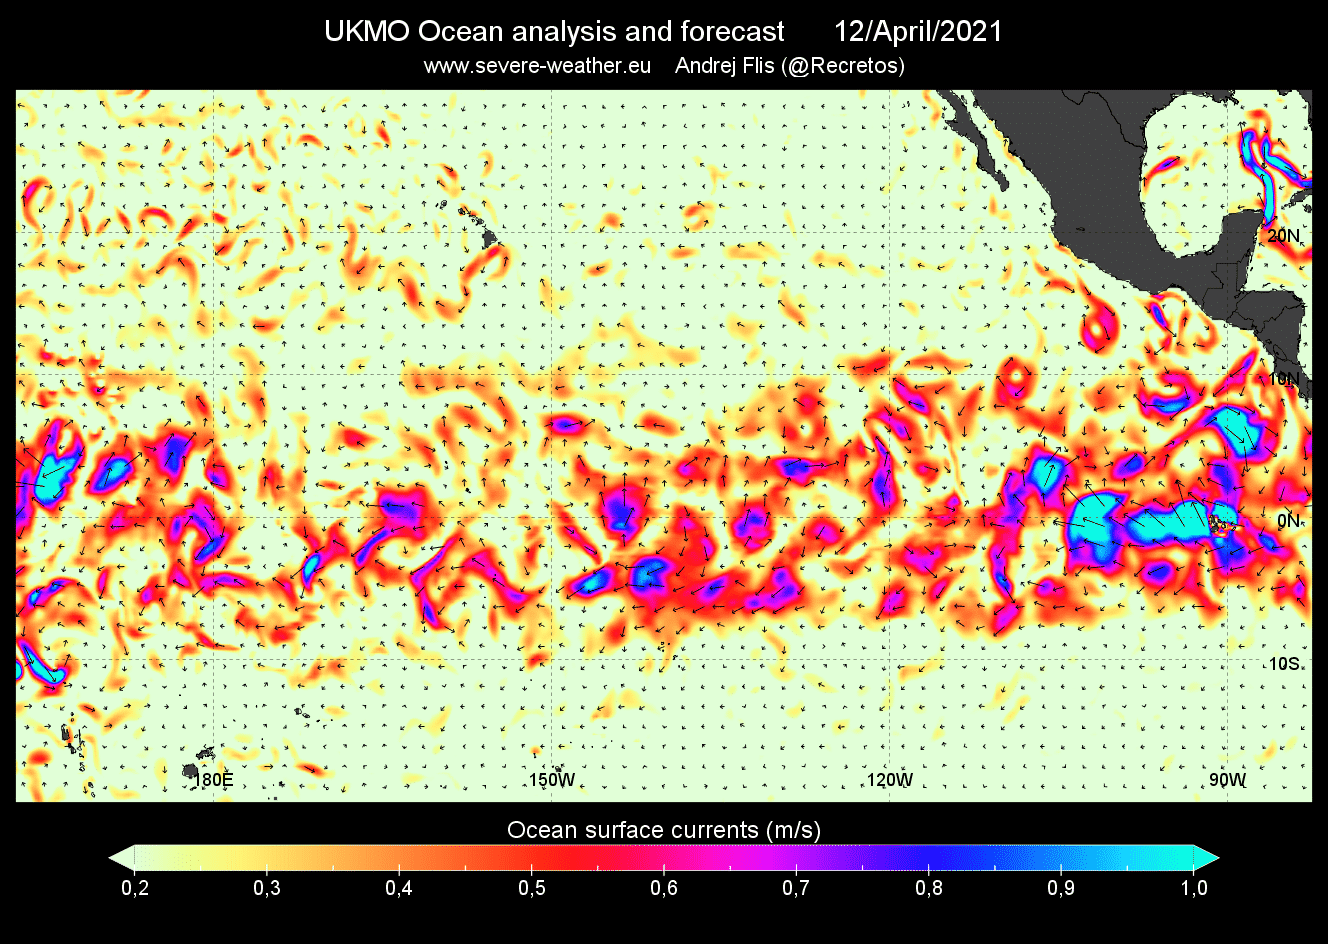
In the past days, the ENSO regions have slightly cooled, relative to normal, due to these enhanced easterly winds/currents. Below is a graphic from CyclonicWx, which shows the ENSO 3.4 region temperature anomaly. After a weakening phase, the temperature anomalies are going down again. This corresponds to the stronger trade winds across the ENSO regions.

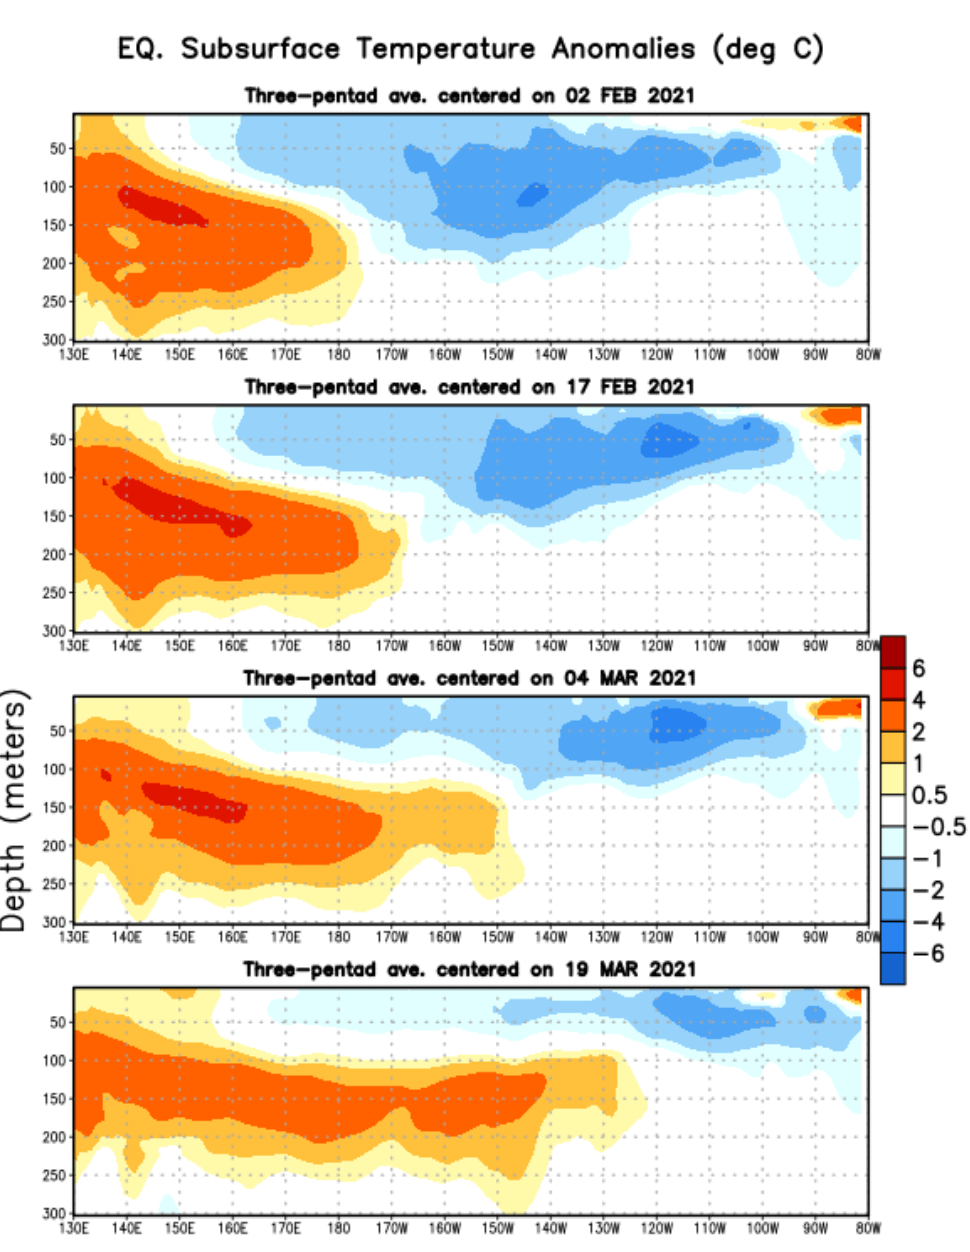
But, there is a lot going on below the surface as well. The next image shows the ocean temperature anomalies in the equatorial Pacific since February. You can see the pool of colder than normal temperatures, which is the La Nina. In the past month, this cold pool has been rapidly weakening, as was the La Nina on the ocean surface. Warmer ocean temperatures are quickly progressing from west to east, slowly pushing out the cold La Nina anomalies.
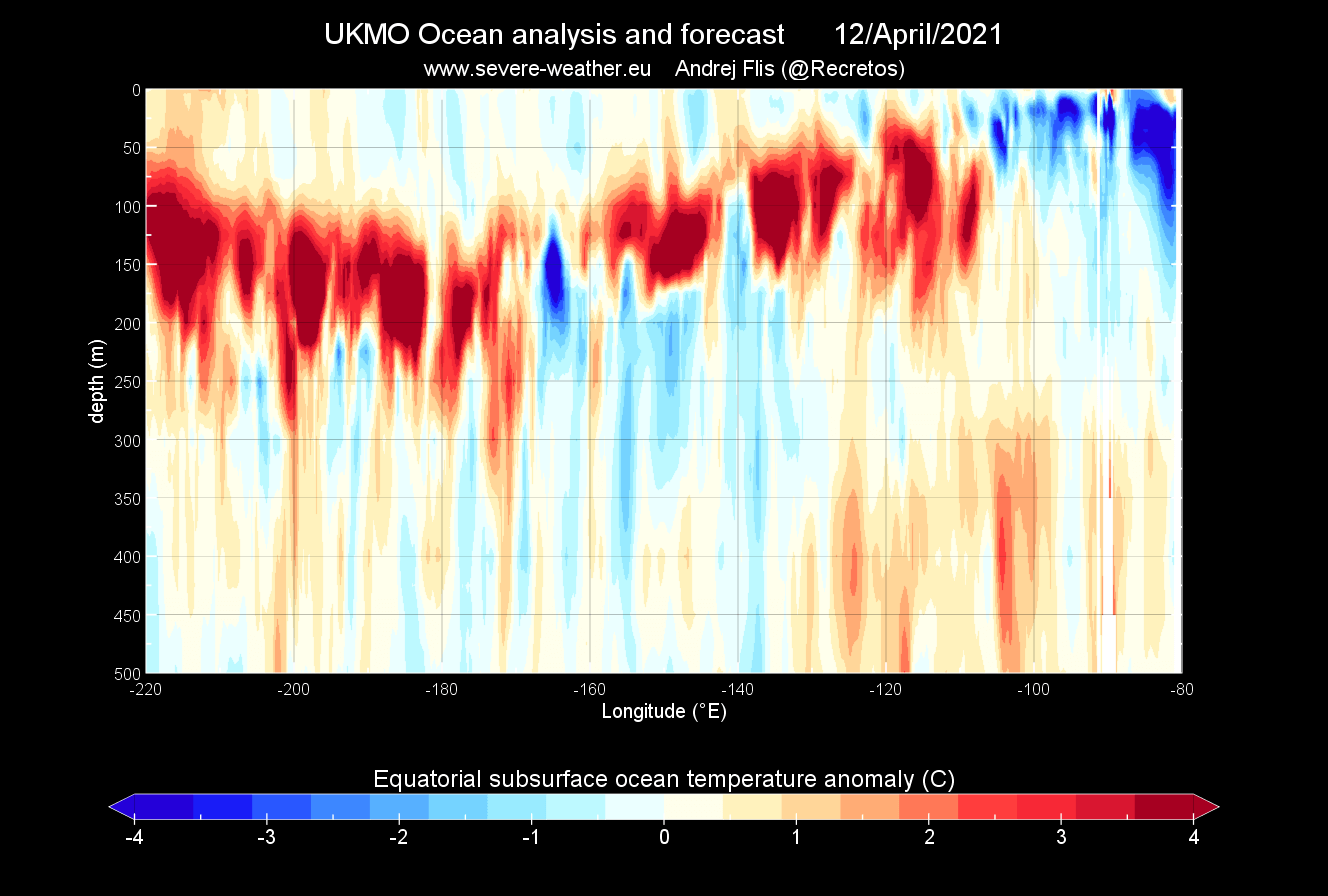
The latest forecast for mid-April, shows the progression of these warmer waters to continue. Our own image below shows the anomaly forecast, with warmer temperatures now expanding even further east, than on the images above. Warming furthest east is located between 50 and 100 meters depth.
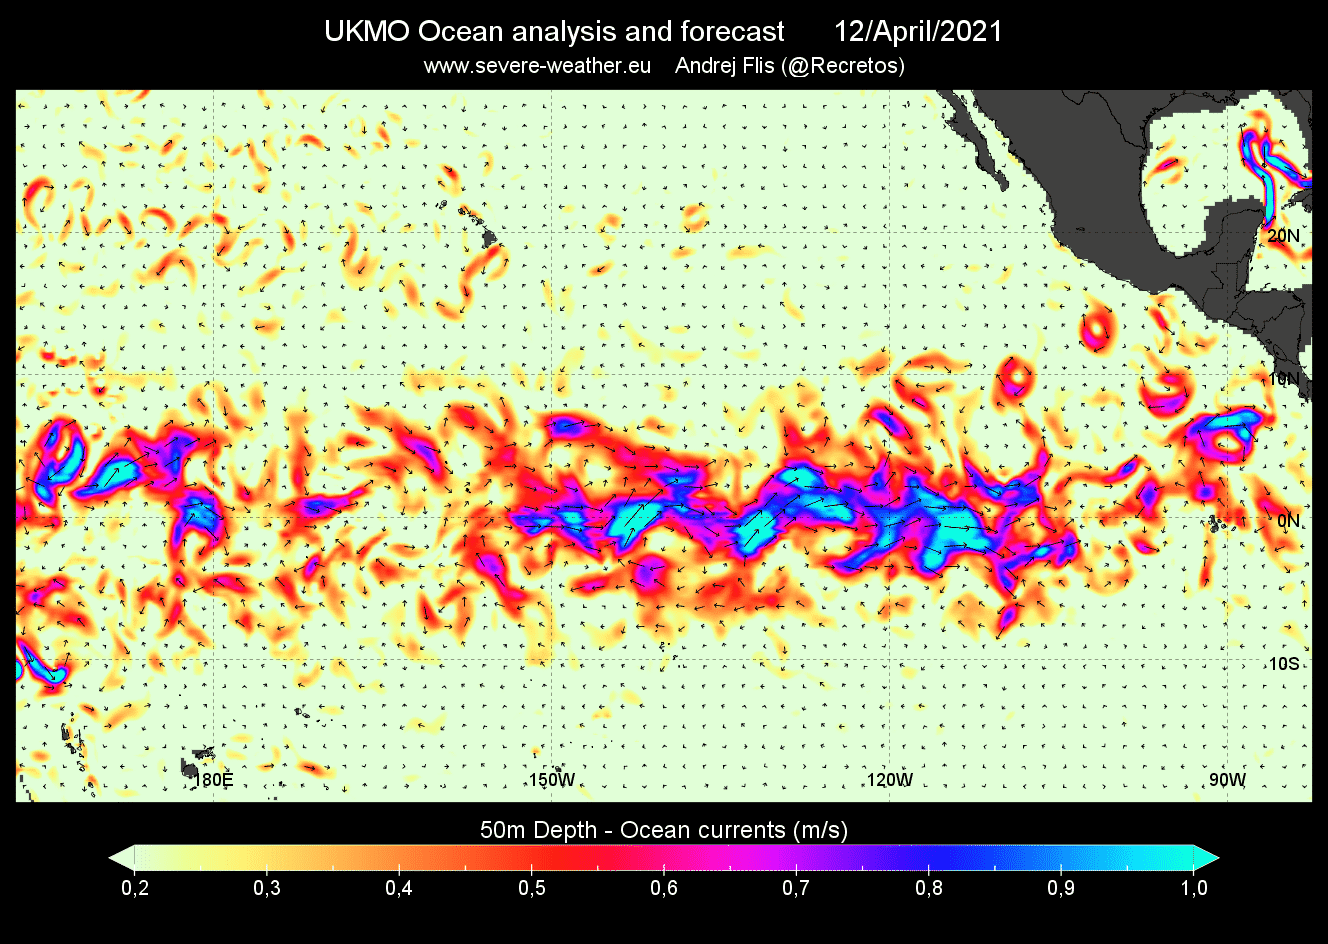
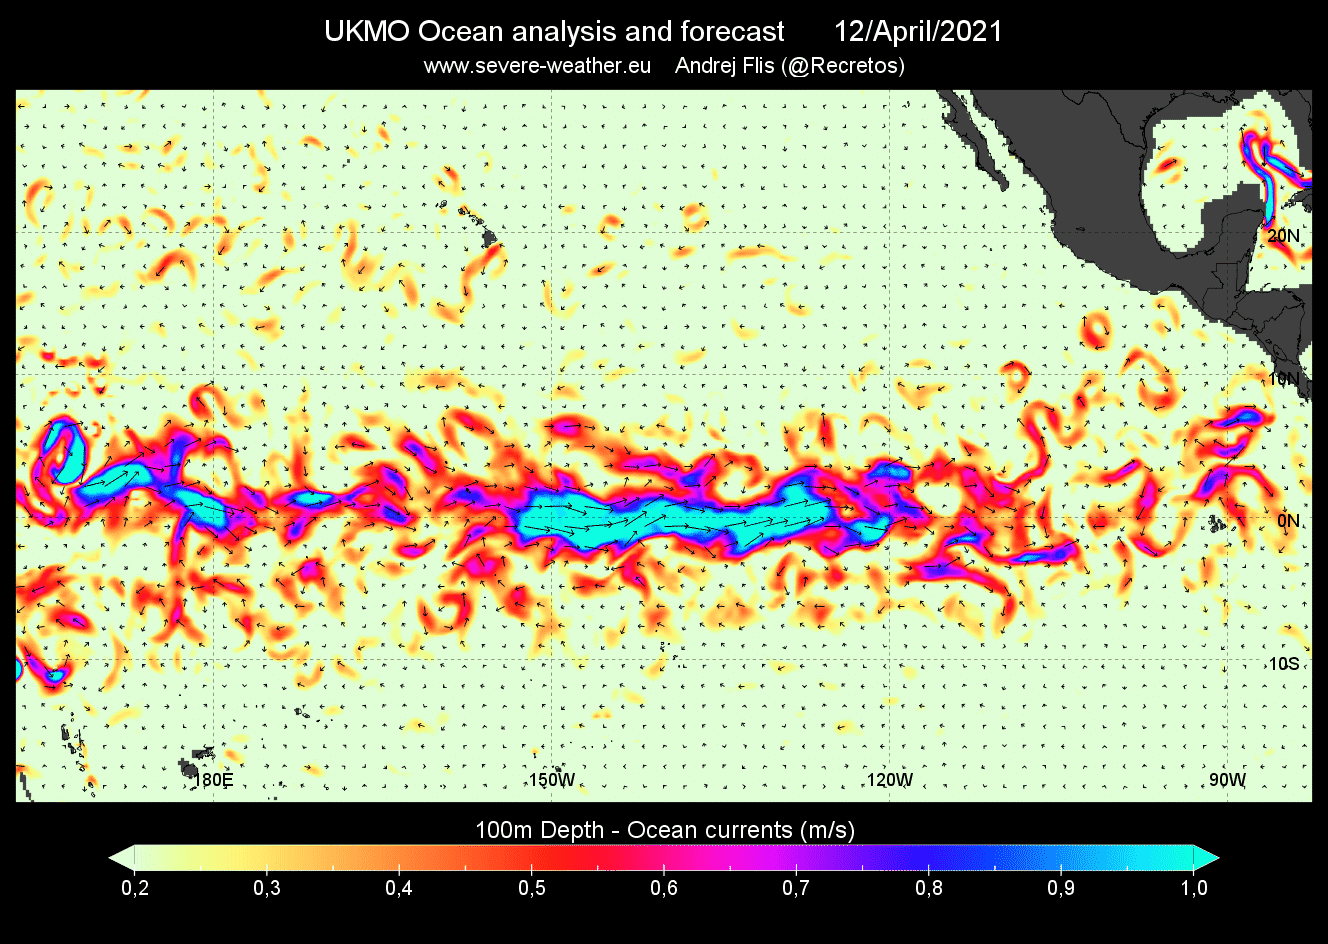
As we mentioned before, westerly currents mean warmer temperatures. We produced two images that show ocean current forecast at 50 and 100meters depth. They both show a strong wave of westerlies at these depths, corresponding to the transport of warmer temperatures at these depths.
This will be a major inhibitor to the further development of the La Nina and its sustainability. These are perhaps early signs that the balance of power might shift from the cold phase to the warm phase (El Nino) later this year.
LA NINA FUTURE
Based on what we have seen so far, La Nina is in trouble at the moment. Despite the easterly winds and currents still holding the ENSO in the cold phase, it will likely go into a neutral phase this spring.
The official probabilistic forecast from IRI, also shows the cold phase persisting into spring. But a neutral state looks to be dominant as we go further towards Summer 2021.

The ensemble forecast from ECMWF also shows the further weakening of the cold phase, going into neutral by summer 2021. This is the latest forecast from early March, as the April forecast is not yet available. We will write an updated article on the ENSO forecast, as new data will be available later this month.

Looking at all the models and statistical forecasts, it is very hard to get a clear picture. The average consensus is that the neutral phase will continue deep into Autumn 2021. But we know that spring ENSO forecasts are notoriously bad, for many reasons. A shift to either a new warm phase or the second cold phase is likely to start in late Autumn.

The actual summer ocean temperature anomaly from ECMWF shows the ENSO regions being in a neutral phase. Even some positive anomalies are developing in the far eastern regions. Take note of the warmer than normal ocean temperatures in the western North Atlantic. This is not something that we want to see in summer, prior to the start of the hurricane season.

ENSO AND HURRICANES
We have seen above that the La Nina is slowly (perhaps just temporarily) ending. But since the global climate is complicated and so large, it can take quite a while for its effects to completely filter out. So despite an ENSO phase ending, its effects can still be seen weeks or even months after.
ENSO phases are strongly related to the atmospheric circulation, as we now know. It is during the Atlantic hurricane season, that these influences are even more important. Below we have a graphic, which shows the impact of a cold ENSO phase on the hurricane season.

The main takeaway is that cold or neutral-cold ENSO conditions support more tropical systems developing and strengthening in the tropical Atlantic area. This increases the risk of long-lived tropical systems, which increases the risk of landfall in the Caribbean and in the United States.
We can also see this if we look at the historical data for pressure and lift. The image below shows the sea level pressure anomaly during the hurricane season in a cold ENSO phase. It is nicely seen, how there is lower pressure across the tropical Atlantic, supporting the development of tropical systems from Africa to the United States.
Another parameter to look at is the velocity potential. To keep it simple, we can identify areas of lift in the atmosphere. The image below shows the velocity potential in a hurricane season during a cold ENSO effect. It is obvious that we have an area of lift in the tropical Atlantic. This supports tropical cyclone development and favorable conditions for strengthening.

PACIFIC OCEAN AND THE WEATHER
The Pacific Ocean is vast, and there is more than just the ENSO and its phases at work here. There is another well-known region of the ocean here, which has an impact on weather in the United States and Canada.
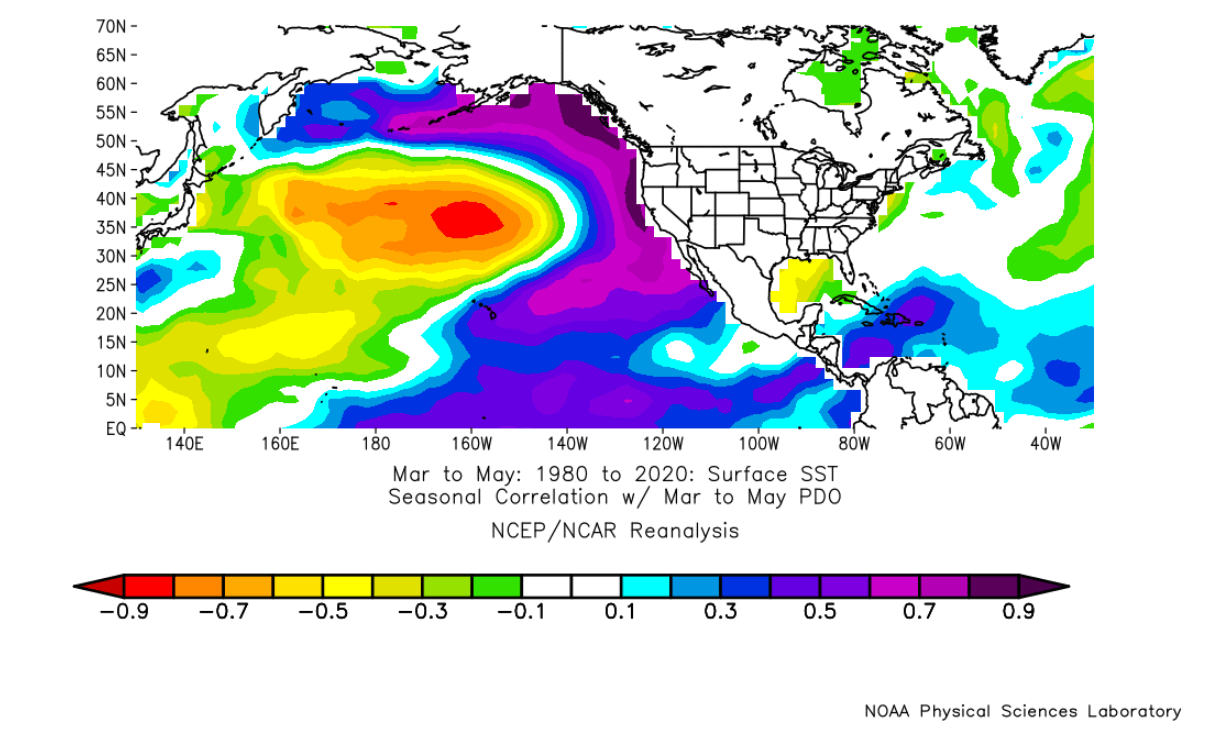
This is the Pacific Decadal Oscillation or just PDO for short. You can see it on the image below, seen as the cold ocean anomalies along the west coast of North America. Another feature of the PDO is the warm/cold ocean anomaly in the central North Pacific region. As the ocean temperatures are colder than normal along the west coast, this is known as a negative or cold PDO.

Below is a perfect example of a cold PDO, with the cold ocean anomalies in a horseshoe shape along the west coast of North America, and the warm ocean anomalies west of it. You can see that it is very similar to the actual analysis above, which confirms we are currently in a cold PDO phase.
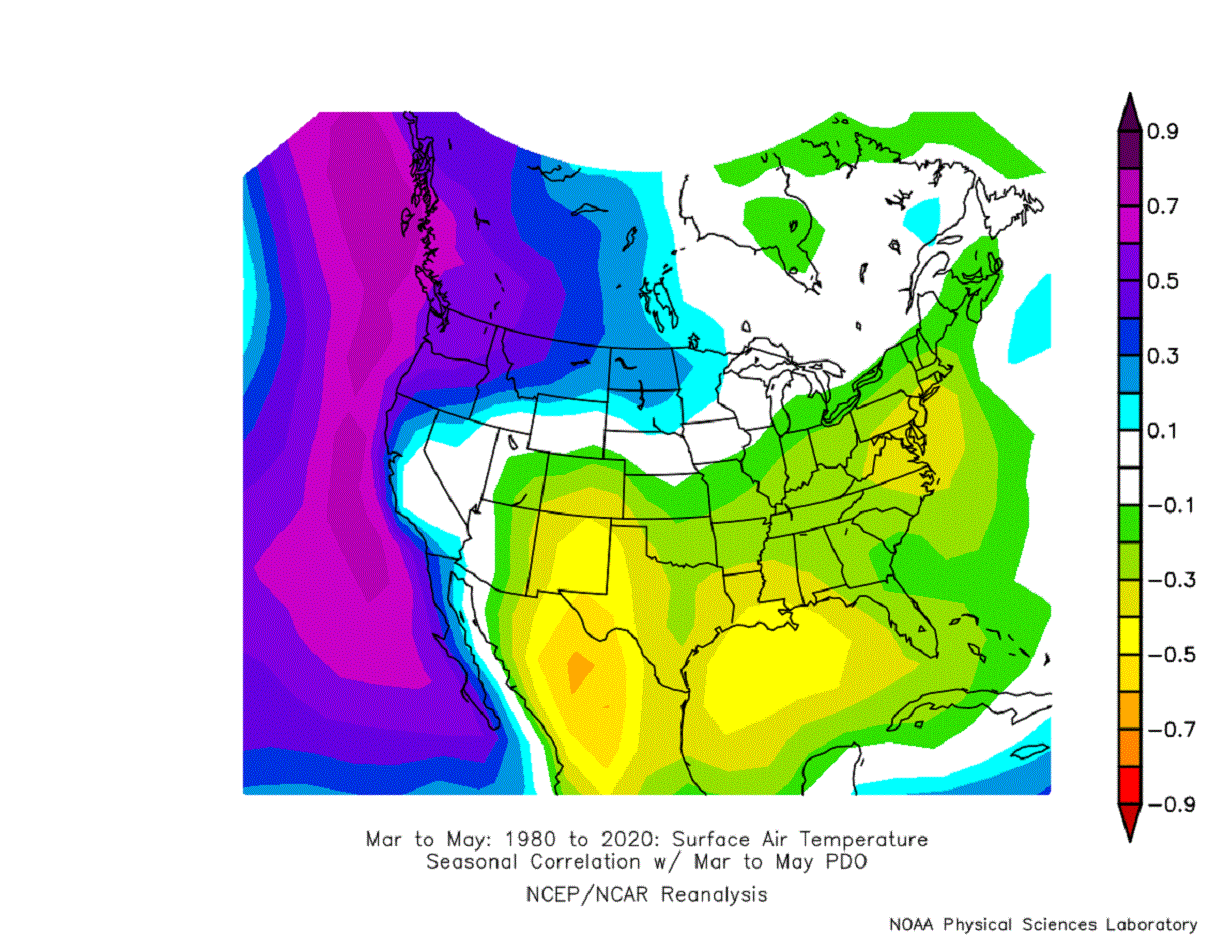
The impact of the cold PDO is felt mainly across the United States and Canada. Below is a historical analysis of the surface temperatures in a cold PDO phase. We can see colder temperatures along the west coast and further inland over the northwestern United States and western Canada. Most of the southern, central, and eastern United States is warmer than normal in a cold PDO phase.
The actual April weather outlook for the United States shows a very similar pattern. The probability forecast shows the chances for a much cooler than normal April in the northwestern United States, and likely cooler for the rest of the west coast. most other parts of the United States will be warmer than normal across the month of April. This is an exact signature as we have seen above for a cold PDO phase.
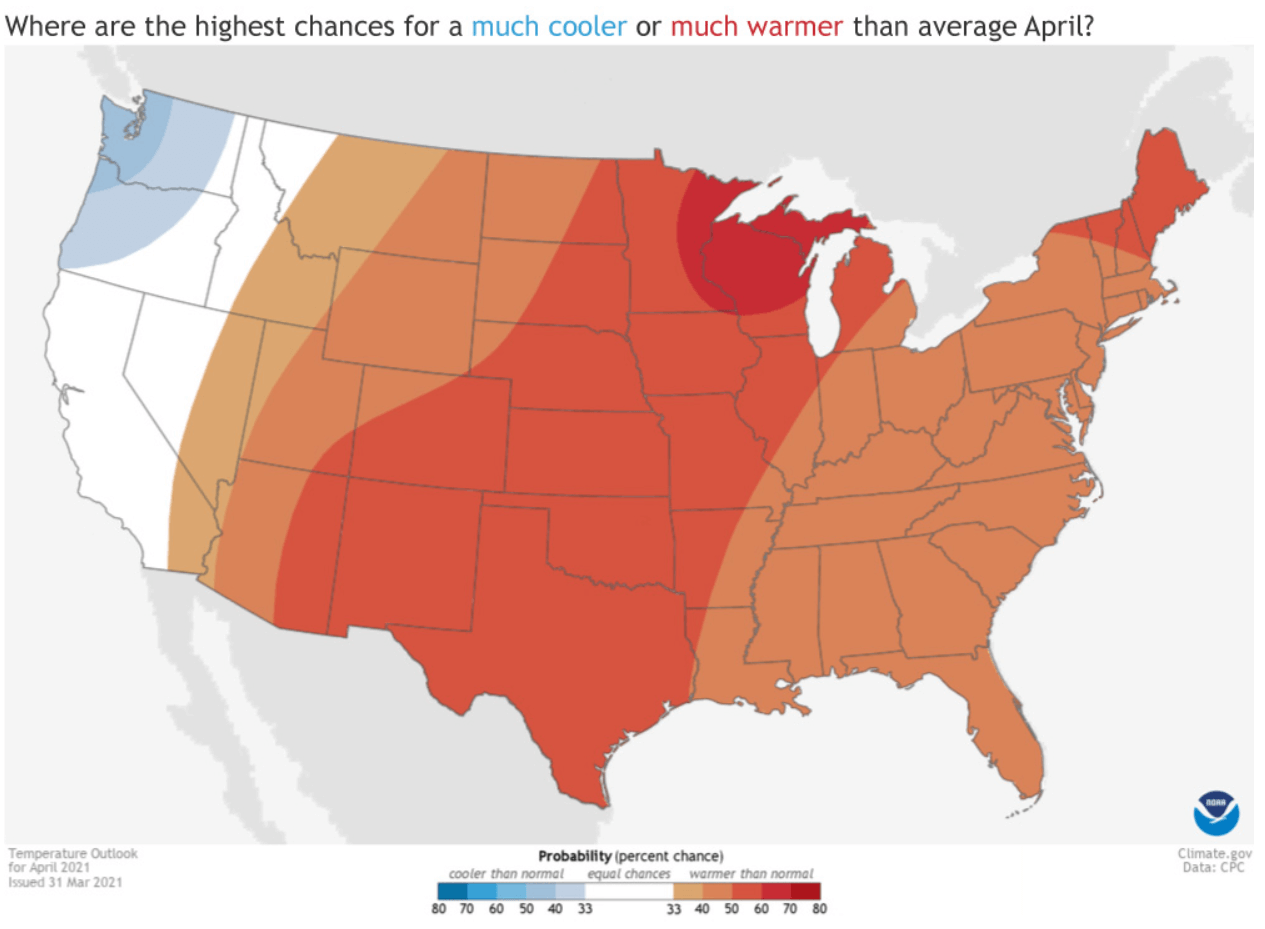
These conditions also mean that central and southern regions will be drier than normal in April. That is also indicated by the precipitation probability forecast for the United States in April.

Such temperature and precipitation distributions are also similar during a La Nina. So as always, we have a combination of multiple processes working together, each with its own influence, adding its piece to the puzzle.
Oceans always play a major role in our weather and climate, so we will closely monitor the activity. Important oceanic changes that occur in summer or even spring can have far-reaching effects. It can reach all the way to the hurricane season or even into the next winter.
We will keep you updated with fresh and updated forecasts, as more reliable data is released in the coming weeks and months. So stay tuned, and don’t forget to bookmark our page to have all the new info ready at hand.
DONT MISS: